2011–2012 Industry Measurement Survey: Commercial and Industrial Mechanical Insulation Market Moving Forward
The
mechanical insulation industry, and the economy as a whole, continues to
rebound from the recent recession. The recovery is slow and varies by region,
market segment, and even within states. The good news is that the industry is
slowly recovering and the signs are there, although fragile, for continued
moderate growth. The industry is moving forward.
After
years of significant growth (2003–2008), the commercial and industrial
mechanical insulation market saw a decline in 2009 of over 27%. The 2010 survey
indicated that the industry had potentially bottomed out and was beginning to
recover. Like many other industries, we soon found that optimism was unfounded
and we had encountered a false bottom. 2011 yielded a 14.7% decline from 2010,
which—for all practical purposes—erased the gains of 2005–2008. Margin erosion
represented a significant portion of the 2011 decline. It does appear, however,
that the bottom has been reached, with 2012 showing 3.5% growth over 2011.
While the growth in 2012 is encouraging, it is
unfortunately beginning from a smaller base, and the general economic recovery
is still tenuous and subject to sudden change. Thus it is not a question of
whether the recovery has begun, but at what pace it will continue. For the
first time, the industry survey asked respondents to provide information
relative to growth expectations for 2013 and 2014. The respondents were
confident about the recovery and indicated they were expecting, on average, a
total of 7% and 8.9% growth, respectively.
The survey was sponsored by the National Insulation
Association (NIA) Foundation for Education, Training, and Industry Advancement
(Foundation). The goal of the survey is to obtain valuable data regarding
sales, market size, and growth for the U.S. commercial and industrial
mechanical insulation market. Since the first survey was completed in 1997, the
market has shown a net growth that equates to a 2.4% annual compounded growth
rate. While that compounded growth rate may not seem overly impressive, you
must consider that the recent recession drove an industry decrease of over 35%
from 2009 through 2011. Over the 16-year period in which the survey has been
conducted, the range of growth has varied from over 22% in 2005, to a decrease
of more than 27% in 2009. That is a severe variance in a relatively short
period of time.
While
survey results are always subject to individual interpretation, the following
takeaways have been generated through discussions held both before and after
the tabulation of survey data.
- The survey is based upon dollars, not units, and a consistent approach
has been utilized over the 16-year period. Based on the survey methodology, the
results should reflect conservative numbers. The survey does not include data
related to metal building insulation; heating, ventilating, and air
conditioning (HVAC) duct liners; original equipment manufacturer products; building
insulation; refractory products; other specialty insulations; or insulation
products or technologies not currently encompassed in NIA’s scope of mechanical
insulation products. The value added by fabricators and laminators has not been
accounted for, nor has the potential impact of imported products from outside
North America. - The survey is meant to be a national picture for the respective calendar
year. Based upon observations and feedback, there are significant geographical
and product variances in the survey results. This is consistent with any survey
of such a broad nature. - The growth exhibited in 2010 could have been created by a simple spike,
or by completion of backlog carried over from 2008, which would indicate the
decline in 2009 was potentially deeper than originally reported. - The industry declined from its peak in 2008 ($13.0 billion) by 35.4%, to
what we assume/hope is the bottom of the recession ($8.4 billion) in 2011. - Every channel experienced some degree of margin reduction in the 2009
and 2010 reporting period. On average, it is estimated that the decline was 1.5
points. Over 28% of the decline in 2011 is attributable to the margin decline
in the distributor and contractor segments. The margin decline in the
manufacturing segment is not known, but it is expected to be in the same range.
In all likelihood, the decline in 2011 was closer to a 60:40 ratio—60% in units
with 40% margin erosion. The growth in 2012 appears to be substantially all
unit growth. - Accessory products on a dollar
comparative basis to core insulation materials declined similarly in 2011 as in
2010, at 11.2% and 11.9%, respectively, while core insulation product growth in
2012 over 2011 was significantly higher, at 5.0% versus 0.9%, respectively. The
breakdown of the 2011 decline is not known, but it is thought to be reasonably
split between unit decline and margin erosion. The 2012 growth seems to
indicate that growth in interior mechanical insulation systems, generally used
in the commercial market, was greater than in the industrial market, which can
require more extensive finishing systems. - Over 78% of the survey respondents provided input to the 2013 and 2014
growth expectation questions. For 2013, the growth expectations ranged from 3%
to 15%, with the average being 7%. For 2014, the range was 3% to 17%, with an
average of 8.9%. If one omits the overly modest and confident respondents, the
averages are 6.6% and 8.9%. Those expectations seem to be reasonably in line
with the overall commercial and industrial construction market forecast.
However, that also begs the question: has the mechanical insulation industry
forecast taken into consideration the lag time between construction starts and
mechanical insulation installation requirements? The industry forecast does not
differentiate growth expectations between new construction, retrofits, or
maintenance. Historically, forecasts of this nature include a blend of each,
with new construction being the largest percentage. Regardless, the forecasts
are optimistic and refreshing after four rollercoaster years. - Approximately 50% of respondents
separated their growth expectations between unit and dollar growth. Based upon
their responses, it appears that 60% of the growth for 2013 and 2014 will come
from unit growth, and the balance in dollar growth. In other words, an increase
in unit cost—or sales price, depending upon your point of view—is expected to
represent 40% of growth expectations over the 2-year period. The ratio between
unit and dollar growth is good news, as unit growth is important to sustained
growth. - Unfortunately, the survey methodology does not allow for interpretation
between the commercial and industrial market segments. As noted in previous
surveys, the unit increases or decreases were probably led by the commercial
segment, while the dollar increase may have been somewhat equivalent between
the two markets. The decline in export product sales created by global economy
issues would have contributed to the 2011 decline. - The survey readership always requests more information by segment,
region, and a host of other meaningful categories. Obtaining that type of
information, however, is dependent upon survey respondents choosing to disclose
it.
The
last several years have been difficult; although signs of recovery were evident
in 2012, it was a challenging year. All
segments—manufacturing, distribution/fabrication, and contracting—responded to
the challenges, as they have in the past (although it is much easier, and more
fun, to respond to the challenges of growth versus decline). Though the economy
has been problematic in the past few years, the future is looking much brighter,
with the potential for sustained growth.
We
should not undervalue the impact the industry’s educational and awareness
initiatives have had. Without those efforts, the bottom may have been deeper
and the recovery even slower. I would like to extend a sincere thank you to
NIA’s Associate (manufacturer) Members who participated in the survey, the
individuals who contributed to the informal survey supporting data, and to all
the contributors to the NIA Foundation for Education, Training, and Industry
Advancement. The Foundation and your support are making a difference in the
industry.
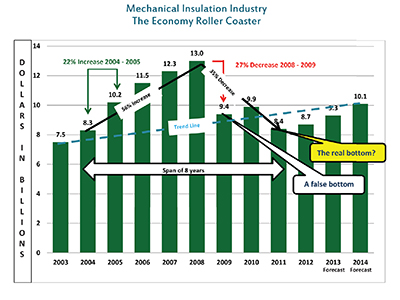 Figure 1
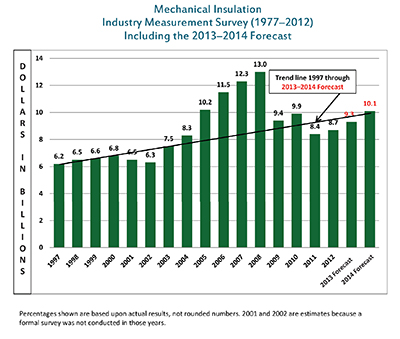 Figure 2