Life-Cycle View of Insulation Investments
Energy management investments can provide some of the best returns on investment (ROI) available to building owners. Energy efficiency improvements become permanent cost reductions for buildings and therefore are more important than the short-term gain of getting a better energy commodity price. To maximize energy management benefits, both supply-side and demand-side strategies should be pursued.
The standard method for evaluating an energy management investment (like insulation) is to use capital planning measurements like simple payback period, ROI, and net present value (NPV). An additional financial tool is asset appreciation, since the cash added to the bottom line of a business increases the value of the asset by a factor of 10 or more. If a $450,000 energy management investment yields a 3-year simple payback, then the ROI is 33 percent. The $150,000 in annual energy savings (cash via cost avoidance) also increases the value of the asset for sale or refinance by a factor of 10, making the additional cash flow (pretax profit) worth $1,500,000 in asset appreciations.
A better facilities management strategy is to consider the total benefits and cost of an investment over the effective lifetime of a project. If a lighting retrofit needs replacement lamps in 3 years, then that project life-cycle cost needs to reflect the true cash flow of the investment. If a given insulation project has an effective lifetime of 25 years, then the financial model needs to reflect its lifetime contribution to the organization long after the simple payback (break-even) period has passed. While this concept seems simple, some financial analysts need to be shown the cost savings after the break-even period. A simple bar graph, as in Figure 1, can illustrate the long-term energy cost savings.
The Sustainable Building Technology Manual, written by Public Technology, Inc., in cooperation with the U.S. Green Building Council, the U.S. Department of Energy (DOE), and the Environmental Protection Agency (EPA), is a no-cost reference manual on life-cycle costing and energy. The National Institute of Building Sciences has the publication on its website at www.wbdg.org/ccb/browse_doc.php?d=4156. One of the facts of building life is that the capital cost of purchasing a building system is only a very small percentage of its true life-cycle cost. For example, the life-cycle cost of an electric motor running three shifts in an industrial plant is 2 percent for the capital investment and 98 percent for the energy consumed. Therefore, paying a slightly higher cost for a premium-efficiency motor pays for itself many times during the life of the motor. The extra cost of a premium motor—or premium industrial insulation—is an attractive investment over the life of the investment.
This understanding of life-cycle cost (plus environmental impact) is the foundation of the “green” movement worldwide. Over the life of a building, energy use affects the profitability for the building owner, as well as the building’s contribution to environmental pollution. Since energy is lost in transmission, the real environmental and natural resources cost is much higher than most people think. The thermal losses and transmission/distribution of energy generally waste more than half the original fuel Btu content. See Figure 2 for a look at energy transmission/distribution losses.
What about Value Engineering (VE)?
The Society of American Value Engineers (SAVE) (value-eng.org) was formed in 1959 as a professional society dedicated to the advancement of VE through a better understanding of the principles, methods, and concepts involved. Now known as SAVE International, it has grown to over 1,500 members and currently has more than 350 active Certified Value Specialists (CVS) in the United States. Requirements for registration as a CVS were developed by SAVE at the request of the U.S. General Services Administration (GSA) in the early 1970s. VE can be applied at any point in a project—even in construction. Typically, however, the earlier it is applied, the higher the return on the time and effort invested. The three main stages of a project and VE’s application are described in Figure 3.
The chart in Figure 3 illustrates that the apparent “savings” from value engineering (VE) starts to disappear as soon as the building moves into its operational phase. While an Architect/Engineer (A&E) may be considered a hero during the design phase for finding a cheaper way of doing something, that A&E does not have to live with the building and its higher operating cost for the next 20, 40, or 60 years. Most of the time, the focus on “first cost” versus “life-cycle costs” is a poor investment.
Net Present Value
The capital planning tool of NPV considers the time value of money when an investment is made, versus a rhetorical investment of the same funds earning an assumed rate of return (see Figure 4).
As a result, the NPV model will demonstrate whether a given investment today (or a premium level of investment) makes good economic sense. The trick to the model is that future savings are discounted since they are not in hand today, meaning that they are worth less. If the NPV calculation results in a positive number, (a) it beats the company’s hurdle rate for internal rate of return (IRR) and (b) the investment is worthwhile. Figures 5, 6, and 7 demonstrate an NPV model.
This model assumes that the cost value of the thing saved (e.g., natural gas) will cost the same thing in the future as it does today. The more advanced NPV model will factor in the higher value of the energy units saved in future years based on the rate of inflation and energy cost increases. This is very significant now as natural gas prices are depressed in the near term and will increase in future years, as documented in the NYMEX futures market. This conservative look at natural gas prices does not include any hurricanes in the Gulf of Mexico, problems in the Middle East, Wall Street traders working the commodity markets, and other unknown factors. Clearly, the cost of natural gas, oil, and electricity will increase in future years faster than the rate of inflation.
Simple Question
Is this plant, facility, or business going to be here in “X” years? If the answer is yes, then the proposed investment in energy efficiency should make sense. Most people will answer yes without any concrete facts on which to base their opinion.
Manufacturing plants and commercial buildings of all types tend to be used for 50 years or more. If a plant expects to be operating for the next 20 years, then the simple payback period of 3 years versus a desired 2-year payback period should not be a deal killer. Simply stated, plants, facilities, and buildings are long-term investments; therefore, the period for energy savings is also long term.
While every financial analyst will run his/her own investment analysis, it is helpful to provide an illustration of the payback period, simple cash flow chart, ROI, NPV calculation, and asset appreciation for each insulation proposal. An extra hour of proposal time using Microsoft Excel should help your proposal get serious attention and an energy management investment.
Resources
While there are many guides to life-cycle cost analysis on the Internet, the DOE provides free software tools to run the analysis at www1.eere.energy.gov/femp/program/lifecycle.html. The same website lists a 2-hour online class on life-cycle cost analysis and a 2-day class on using the Building Life-Cycle Cost (BLCC) Programs. Handbook 135 (PDF 9.2 MB), the Life-Cycle Costing Manual for the Federal Energy Management Program (FEMP), explains in detail the principles of life-cycle cost analysis and integrates them with the FEMP criteria.
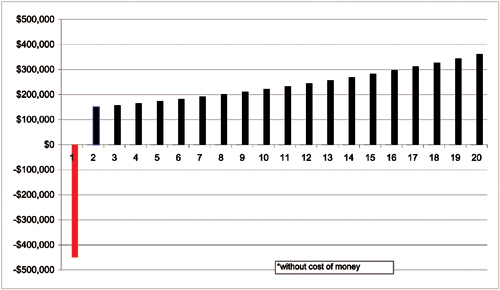 Figure 1
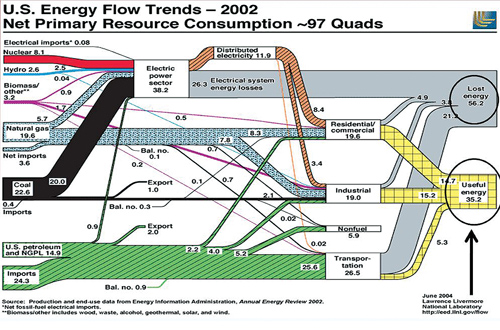 Figure 2
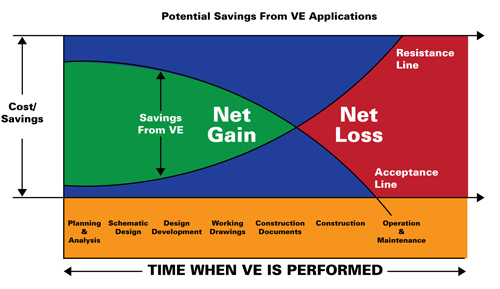 Figure 3
 Figure 4
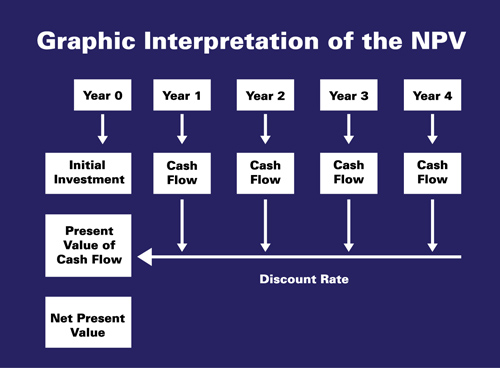 Figure 5
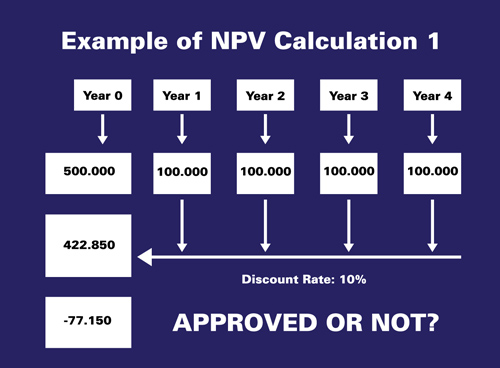 Figure 6
 Figure 7