Moving Forward Into 2014—Forecast: Economic Recovery and Continued Growth
As 2013 draws to a close, the U.S. economy is coming off a lackluster year in terms of gross domestic product (GDP) growth and employment. Real GDP for the third quarter (Q3) of 2013 increased at an annual rate of 2.8%, primarily driven by a build-up in inventories. Consumer expenditures account for about 70% of GDP and rose by 1.5%. Nonresidential
fixed investment, which includes business expenditures for enhanced capacity and productivity, increased by 1.6%.1 GDP growth for the year is expected to be 1.7%, but Q4 2013 will be more positive at 2.4%.2 Unemployment will average 7.4% for 2013 as a whole, but Q4 should show improvement to 7.1% as more jobs are added to the employment base. Inflation will again be a bright spot for consumers, with the year-end consumer price index (CPI) only up about 1.5%.3
Although the 2013 “fiscal cliff,” sequestration, and government shutdown are behind us, we face a new year with great uncertainty. In December, Congress reached a tentative agreement that the House approved on December 12. The agreement will reduce some of the uncertainty regarding fiscal policy, which may positively affect consumer confidence. We can expect a degree of conflict over federal spending and funding policy that may cause more reluctance for consumers to spend and the private sector to invest. Additionally, after the launch of the Patient Protection and Affordable Care Act (PPACA) in November 2013, there is still uncertainty regarding the cost of implementing the act to employers, consumers, and taxpayers.
Consumer and Business Confidence
A continuing concern for more robust improvement in consumer expenditures is the lack of growth in consumer confidence. As seen in Figure 1 on page 6, through October 2013, confidence indices have trended up only slightly since 2008 and remain at much lower levels than pre-recession years.4 Rising consumer confidence leads to increased consumer expenditures that, in turn, typically foster business investment expenditures.
Business confidence is also a driver of business investment decisions. The Small Business Optimism Index, published by the National Federation of Independent Business, stood at 91.6 as of October 2013. “The average value of the Index since the recovery started is 91, 8 points below the 35-year average through 2007 and well below readings typically experienced in a recovery.”5 The recent decline in the index is attributed primarily to the outlook for business conditions and for real sales growth. It is noteworthy that survey respondents indicated that the 3 most important problems their businesses face—in order—are government regulations and red tape, taxes, and poor sales.
General Economic Outlook
The 2014 outlook for the U.S. economy is for the recovery to continue at a modest pace. As Figure 2 (on page 8) indicates, real GDP forecasts for 2014 generally fall in the 2.4% to 3% range, with the unemployment rate improving to 6.8% from 7% by year end.6 The forecast for inflation for 2014 at 1.9% is only slightly higher than the previous year. The benchmark 10-year Treasury yield is expected to rise 3.1% to 3.4% as the Federal Reserve reduces its purchases of securities that have provided reserves into the monetary system. Most analysts believe that the Federal Reserve will begin tapering its security purchase program in the spring of 2014, but labor market improvements in Q4 2013 may hasten the start of this process. However, if the markets perceive that the tapering is likely to occur sooner, interest rates will rise in advance of the expected federal action, as occurred in the summer of 2012.
Credit Markets
Business credit market conditions for commercial and industrial loans should remain relatively accommodating in terms of rates, but lender credit underwriting standards will
remain largely unchanged, with some slight improvement. The Federal Reserve’s October 2013 Senior Loan Officer Opinion Survey indicates that, across all borrower size categories, only 11.1% reported that credit standards had “eased somewhat.”7 Commercial real estate credit markets have continued to improve as rents and occupancy levels rise. However, there is significant variance in activity among property types and geography. For example, the National Association of Realtors estimates that at Q4 2013, industrial vacancy rates nationwide are at 9.2%, while rates in the Los Angeles area are about 4%.8
Current Construction Industry Status
Construction employment in the United States began a slow recovery from the low point of 5.435 million in January 2011.9 Over the 41 months since, construction employment has grown at an average annual rate of 1.9%. The current employment level in October 2013 was 5.834 million, still considerably below 2003 levels of approximately 6.7 million (Figure 3). A simple comparison of the construction unemployment rate history with that of the overall economy demonstrates the severe impact of the recession and the relatively slow recovery for construction10 (Figure 4).
Figure 5 (on page 10) shows the slow, steady recovery in total construction spending to an annual rate of $908.4 billion at October 2013.11 It is also evident that the recovery for nonresidential construction has been more gradual compared to residential construction. At an annual rate of $575.6 billion (seasonally adjusted), nonresidential construction stood at about the same level as it was at the end of 2006, below the peak annual rate of $719.0 billion in October 2008.
Current Nonresidential Construction Spending
For nonresidential construction expenditures, it appears that 2014 will be characterized by modest overall growth with wide variation among sub-sectors. The American Institute of Architects (AIA) Consensus Construction Forecast predicts that total nonresidential construction spending will end the year with overall growth of 2.3%.12
In terms of the value of construction put in place, year-over-year October 2013 total private nonresidential construction spending declined by 3.4%. Most of the decrease is explained by reductions in communication and power plant spending, at -18.8% and -16.5% respectively. Lodging and commercial construction spending were the leaders, at 18.6% and 6.6%. Educational, amusement and recreation, transportation, and manufacturing all increased approximately 3%; while office and health-care expenditures increased at less than 2%.
Public nonresidential construction, dominated by state and local construction, increased by 2.4%. However, the sub-sectors most closely aligned with commercial insulation demand (health care, education, public safety, and amusement and recreation) declined by $3.3 billion or 3.8%. The only exception was transportation, which grew by 6.5%.13
2014 Nonresidential Forecast
2014 should be better than 2013, with certain sectors expected to perform much better than others. The 2014 AIA Consensus Construction Forecast (Figure 6 on page 12) is a compilation of 6 forecasts. The consensus indicates overall growth of 7.6%, with private commercial construction leading the way with 11.5% growth, followed by industrial construction at 6.3%, and institutional construction at 5.6%.14 Within the commercial category, hotel construction is expected to continue as the strongest sector at 15%. Retail and related construction is anticipated to increase by 11.7%. This growth is based on improvement in vacancy rates and retail rent rates. The National Association of Realtors expects national retail vacancy rates to decline from 10.4% in Q4 2013 to 9.9% in Q4 2014. Average rents are expected to increase by 2.2% for next year.15 For certain types of retailers, brick and mortar construction will be constrained by customers shifting to online purchases.
Industrial construction is expected to rise by 6.3%. This category includes construction of manufacturing and warehousing buildings. The return of some manufacturing to the United States bodes well for expansion for both of these classes of construction. Additionally, airport terminal improvements and expansions will add to construction demand. The continued success of the automobile industry is expected to provide additional construction opportunities.
The consensus forecast for health-care construction is expected to increase 7.7% over 2013. However, there will be countervailing influences. As the population ages, more health-care facilities serving this population segment will be needed. Conversely, shorter hospital stays and increasing pressure to contain costs will serve to dampen the need for other types of facilities. Effects of the PPACA are not yet fully understood and may increase the demand for health-care construction beyond current expectations.
Education construction expenditures, forecasted to rise by 4.8%, will struggle as budget issues continue to plague this sector. Educational construction will be strongest for those
states and municipalities that have sound budgets and are experiencing rising populations, economic growth, and tax revenues. Areas that have stagnant or decreasing populations will have limited demand for additional construction projects.
Office construction is expected to rise by 9.5%. The demand for this sector will be heavily influenced by local market conditions. Areas with high employment growth rates will experience declining vacancy rates and rising rents, creating demand for new space, while other markets will not fare as well. A headwind for this sector comes from companies reconfiguring their existing office space to more efficiently house their workforce, therefore needing less space. Additionally, new office space design reduces square feet of office space per employee.
In general, institutional construction is expected to show improvement not seen in 2013, but still at a slow pace. Construction activity for education, health care, recreation/amusement, and public safety will recover more strongly as state and local governments experience improved revenues and financial condition.
Associated Builders and Contractors’ (ABC’s) Construction Confidence Index tracks 3 facets of the nonresidential construction industry: sales prospects, profit margins, and staffing level expectations. Index values are calculated at 6-month intervals. The latest report, for the first half of 2013, indicated slight improvement over the last half of 2012. According to ABC Chief Economist Anirban Basu, “Overall, contractors are saying positive factors will outweigh negative ones, helping create an improved construction environment in 2014.”16 Further, ABC believes that 2014 will experience high single-digit growth in nonresidential construction, with the industry continuing to add jobs.
Leading Indicators for Nonresidential Construction
As 2013 comes to a close, leading indicators of nonresidential construction demand are indicating that 2014 will see positive, but still recovering, growth in the industry.
ABC’s Construction Backlog Indicator (CBI) is a forward-looking national economic indicator that reflects the amount of work that will be performed by commercial and industrial contractors in the coming months. The index generally has trended upward over the past 4 years, with the October 2013 reading at 8.21 months.17 ABC’s analysis of the backlog data at Q3 2013 indicates that the CBI varies significantly by region: South, 9.79 months; Northeast, 8.23 months; West, 7.38 months; and the middle states at 6.15 months. The South and West regions are likely to experience the most expansion in backlog going forward.
AIA’s Architecture Billings Index is a leading economic indicator that predicts nonresidential construction activities for the upcoming 9 to 12 months. Any score above 50 indicates an increase in billings. The Index stood at 51.6 in October 2013, down from August and September readings of 53.8 and 54.3. The regional indexes for October saw the West at 55.9, followed by the South at 54.4, the Midwest at 51.6, and the Northeast at 49.7. AIA’s index for new project inquiries rose in October to 61.5 over September (at 58.6), but down from August (at 63.0). AIA Chief Economist Kermit Baker noted that the continuing uncertainty surrounding the overall U.S. economy has affected the demand for nonresidential facilities and, therefore, slowed progress on new building projects.18
Summary
As the new year unfolds, the nonresidential construction industry will continue its slow, steady recovery, with some sectors and geographic regions performing better than others. Improving labor market conditions during Q4 2013 may well portend more positive momentum in the economy. Uncertainty regarding monetary policy, credit market conditions, and regulation implementation will likely hold back more rapid recovery.
Notes
- News Release, U.S. Department of Commerce, Bureau of Economic Analysis, November 7, 2013.
- Bloomberg Monthly Survey, Catarina Saraiva, October 10, 2013; U.S. Economic Forecast, Wells Fargo Securities, LLC Economics, Group, November 1, 2013; Survey of Professional Forecasters, Research Department, Federal Reserve Bank of Philadelphia, November 25, 2013.
- U.S. Economic Forecast, Wells Fargo Securities, LLC Economics, Group, November 1, 2013.
- Surveys of Consumers, Thomas Reuters, University of Michigan (monthly updates); Consumer Confidence Index, Conference Board (monthly updates).
- William C. Dunkelberg and Holly Wade, Small Business Economic Trends, National Federation of Independent Business, November 2013.
- Catarina Saraiva, Bloomberg Monthly Survey, October 10, 2013; Survey of Professional Forecasters, Research Department, Federal Reserve Bank of Philadelphia, November 25, 2013; U.S. Economic Forecast, Wells Fargo Securities, LLC Economics, Group, November 1, 2013; Minutes of the Federal Open Market Committee, Board of Governors of the Federal Reserve System, September 17-18, 2013; U.S. Forecast, the Conference Board, November 13, 2013.
- “The October 2013 Senior Loan Officer Opinion Survey on Bank Lending Practices,” Board of Governors of the Federal Reserve System, November 4, 2013.
- “Modest Growth Seen in Commercial Real Estate Markets,” National Association of Realtors News Release, November 22, 2013.
- U.S. Bureau of Labor Statistics Survey, December 3, 2013.
- Ibid.
- U.S. Census Bureau Survey, November 2013.
- AIA Chief Economist Kermit Baker, Consensus Construction Forecasts, the American Institute of Architects, July 2013.
- U.S. Department of Commerce Census Bureau, Value of Construction Put in Place—Seasonally Adjusted, October 2013.
- AIA Chief Economist Kermit Baker, Consensus Construction Forecasts, the American Institute of Architects, July 2013.
- “Modest Growth Seen in Commercial Real Estate Markets,” National Association of Realtors News Release, November 22, 2013.
- “Despite Headwinds, Contractor Confidence Rises in first Half of 2013,” Associated Builders and Contractors, September 25, 2013.
- Associated Builders and Contractors News Release, Backlog Indicator Charts and Graphs Index, November 2013.
- Architecture Billings Index Slows Down,” the American Institute of Architects’ Press Release, November 20, 2013.
 Figure 1
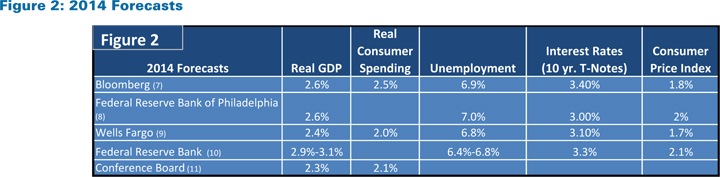 Figure 2
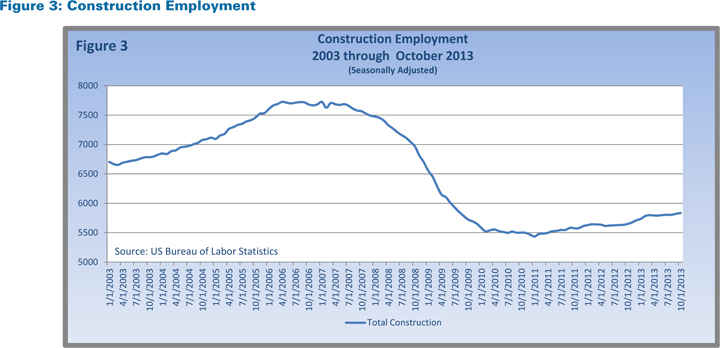 Figure 3
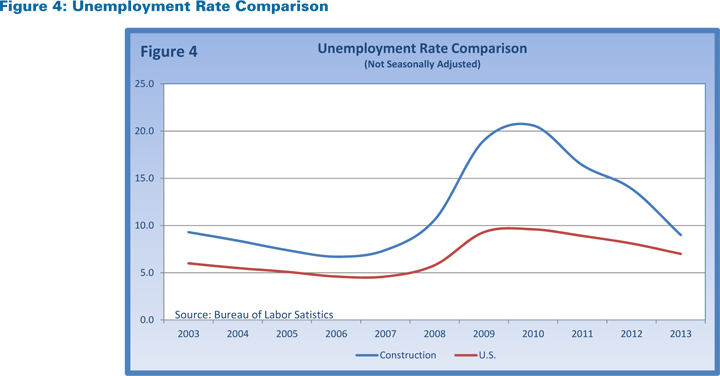 Figure 4
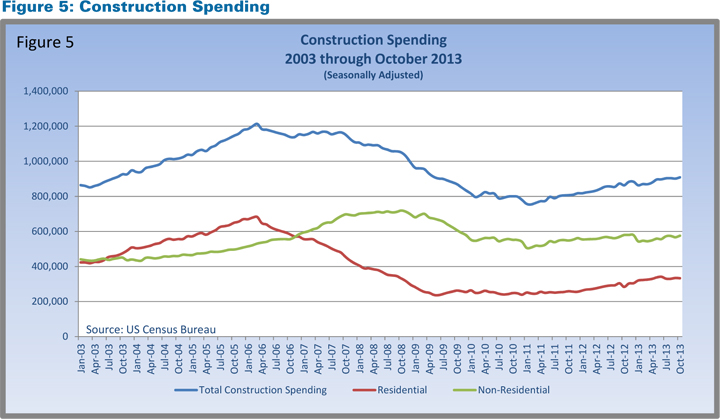 Figure 5
 Figure 6