Multiple Choice, Part 1
Selecting Proper Insulation Thickness Helps Increase Energy Efficiency
An interesting paradox of the past several years is that energy prices have more than doubled while thermal insulation thicknesses for hot piping and equipment have not increased. In fact, most insulation thickness tables for hot service industrial piping and equipment were written before 2000—well before the recent energy price bonanza—and most of these tables have not been upgraded to reflect the higher energy prices.
This has caused facility owners to spend more money for energy than is necessary, when energy use could be cost-effectively reduced with appropriate insulation thicknesses. It also raises the following questions: How should insulation thicknesses be selected, and how should economic thicknesses of insulation be selected (economic thicknesses being that balance of energy savings with first cost plus maintenance cost of the installed insulation system)? This article will answer the first of these questions, and the second question will be addressed in more detail in a follow-up article in the December issue.
According to the National Insulation Association’s (NIA’s) National Insulation Training Program (NITP), the four primary reasons for insulating (excluding specialty cases of noise reduction and fire protection) include the following:
- Process Control
- Personnel Protection
- Condensation Control
- Energy Savings
In the NITP, students are introduced to the computer program 3E Plus®, available now in Version 4.0, Build 33, for free download from the North American Insulation Manufacturers Association (NAIMA) at www.pipeinsulation.org. With this computerized heat-transfer tool, plus appropriate design conditions and thermal conductivity information on a particular type of insulation, users can determine appropriate thicknesses using criteria for one of the above four reasons for insulating. NIA offers a comprehensive, 3.5-hour training program for 3E Plus users. To learn more, please visit www.insulation.org/training/seminar.
Thermal insulation markets—and, therefore, specified insulation thicknesses—are directly affected by trends in energy prices. Before one can determine insulation thicknesses, it is important to understand the latest trends.
Thermal Insulation Thicknesses and Energy Prices
The world watched in amazement as spot market crude oil prices rose from about $10 per barrel in 1998 to more than $77 per barrel in midsummer 2006, dropped back to below $60 per barrel, and then rose again to the $79- to $83-per-barrel range in early fall 2007. Natural gas rose from a wholesale price of around $3 per thousand cubic feet (mcf) 5 years ago to about $6 per mcf. The price of natural gas has been even more volatile than that for crude oil: It rose to more than $15 per mcf in September 2005, immediately following Hurricane Rita, and then dropped below $5 per mcf during the summer of 2006. This wholesale price of natural gas was about $6.70 in early fall 2007.
Wholesale prices of crude oil, gasoline and its distillate products, and natural gas have at least doubled in the past several years. As an example of the trend in energy prices over the past decade, Figure 1 shows the variations in average (as opposed to spot) annual crude oil prices from January 1997 to July 2007. (The spot price of light sweet crude at the time this article was updated, for November 2007 delivery, was actually about $80 per barrel.)
The price for natural gas also has been erratic over the past decade but generally has increased, as shown in Figure 2.
Comparing Figures 1 and 2, it is apparent that natural gas prices have been even more erratic than those of crude oil. Natural gas prices are more severely affected by events like long, cold winters and natural disasters.
What effect have these increasing crude oil and natural gas prices had on thermal insulation markets? As predicted in the November 2003 Insulation Outlook article “The Impact of High Natural Gas Prices on the Mechanical Insulation Industry” (see www.insulation.org/articles/article.cfm?id=IO031102), the markets for mechanical insulation have grown dramatically and clearly will continue to grow in the future. Reasons for this include the following:
- New construction in the electric power and oil industries, as well as retrofit of existing coal-fired power plants, have combined to make the mechanical insulation opportunities in the power sector the best they have been in more than 20 years.
- Mechanical insulation contractors are enjoying a robust business in both the environmental retro-fit of existing coal-fired electric power plants and the construction of new ones.
- Insulation opportunities in new natural gas turbine generators continue in spite of today’s much higher natural gas prices.
- New construction projects in the Oil Sands area of northern Alberta, Canada, are huge. Collectively, they form perhaps the largest group of construction projects in any one geographic area in North America. All of the projects have an extensive quantity of new hot service piping and equipment that needs to be insulated.
- The petrochemical industry, enjoying record revenue in the past few years, is undertaking extensive upgrades to existing facilities, as well as capacity expansions. Construction of a large new oil refinery—the first such new American refinery in some 35 years—is being planned on the U.S. Gulf Coast.
- The mechanical insulation distributors, fabricators, and contractors along the U.S. Gulf Coast of Texas and Louisiana are enjoying a brisk business, as are those in northern Alberta near Fort McMurray—the “home base” for the Canadian Oil Sands development. Business should continue to be good there in the future as well.
With all of this new mechanical insulation activity—much of it driven by rapidly increasing prices for crude oil, crude oil products, and natural gas—it is logical to expect significant increases in the specified insulation thicknesses on various projects. It would make sense for thermal insulation thickness tables for hot service piping and equipment—the matrix tables with pipe temperatures across the top and pipe diameters down the side—to have been updated recently and to require at least a 50-percent increase in thicknesses from the requirements of the 1990s.
While energy prices have more than doubled in the past few years, there has not been a wholesale rewrite of the old pipe insulation thickness tables. When it comes to insulation thickness tables, the rule seems to have always been: “If it isn’t broke, don’t fix it!” However, the old adage does not necessarily hold true in this situation. The rest of this article explores how to select insulation thicknesses for piping and equipment, and takes an in-depth look at the mysterious relationship—or lack of relationship—between rising energy prices and specified insulation thicknesses.
Insulation Thickness Tables: A Closer Look
Different design firms and industrial facilities have their own insulation thickness tables for hot service piping and equipment. They may have several tables—one for each type of insulation approved for use at the facility. If a company has one facility located along the Gulf Coast and another near Chicago, the tables for a given type of insulation will probably be different in each location to account for differences in weather. There is no single correct insulation thickness table, even for a given type of insulation. For the purposes of this article, the petrochemical industry is a valid example. However, the information provided here is applicable to many industries and is not limited to petrochemical facilities.
Process Industry Practices (PIP) (Revision 1, 1999) for insulation represents a petrochemical industry cooperative effort. It contains 22 insulation thickness tables. For above-ambient service temperatures, there are tables for calcium silicate, cellular glass, fiberglass, mineral wool, expanded perlite, and polyisocyanurate. For each type of insulation, the following three tables are included: 1) an economic thickness table, 2) a table to limit the maximum surface temperature to 140°F, and 3) a table that gives the largest thickness of the two. Because of temperature limitations of the materials, the calcium silicate, mineral wool, and expanded perlite tables extend to 1,200°F; the cellular glass tables extend to 800°F; and the fiberglass tables extend to 850°F. The polyisocyanurate tables only extend up to 250°F. For each table, there is a thickness for each temperature column, based on 50-degree increments, for each standard pipe size between ½-inch iron pipe size (IPS) and 36-inch IPS, as well as for flat surfaces. These tables are good references because they are sometimes used by the petrochemical industry as thickness standards.
Design Information
The following specifications are for a facility in or around the U.S. Gulf Coast:
- Average pipe temperature: 600°F
- Average ambient temperature: 60°F
- Average wind speed: 5 miles per hour (mph)
- Average pipe size: 8-inch nominal pipe size (NPS)
- Insulation type: Commercially available, preformed, mineral wool pipe insulation that meets the requirements of American Society for Testing and Materials (ASTM) C547 Type II and has the thermal conductivity data in Figure 4 (Table 1)
- Metal-jacketing emissivity: 0.1 for oxidized aluminum jacketing
Based on this example, one can look at the four reasons for insulating to generate an insulation thickness table.
Process control. To determine a thickness using process control as the design criteria, usually some fluid temperature needs to be maintained. For a hot fluid being piped from point A to point B, the heat loss/unit pipe length in British thermal units per hour-lineal feet (Btu/hr-LF) would need to be kept to some maximum value. For a pipe length of 1,000 LF and a heat loss that must be limited to 300,000 Btu/hr over that length, the maximum allowable heat loss/unit length would be 300,000/1,000 = 300 Btu/hr-LF.* Inputting the above information into 3E Plus shows that a thickness of 2 inches is required to meet the condition that heat loss/unit length < 300 Btu/hr-LF.
So, for process control, how would one generate an insulation thickness table using the above criteria for one pipe size at one temperature and a maximum allowable heat loss/unit length of 300 Btu/hr-LF? Well, one cannot—at least, not in any simple way. Each pipe size and temperature would need to be considered separately. The value could, however, be expressed in terms of a single value of heat loss/unit surface area of insulation. For this specific example, the equivalent heat loss/area would be 82.6 British thermal units per hour-square feet (Btu/hr-ft2).
Using this single value (rounded up to 85 Btu/hr-ft2 for simplicity), an insulation thickness table for pipe temperatures from 200°F to 800°F in 100-degree increments from ½-inch IPS to 36-inch IPS can be generated. 3E Plus conveniently has an option called Heat Flow Limitation that has an input box for the maximum allowable value (in this case, 85 Btu/hr-ft2). It seems simple to use just one design heat loss value for all pipe sizes and operating temperatures, but this approach leads to a major problem.
A fixed heat loss/insulation surface area is not likely to work for all processes at a facility. Each process line is a different length; diameter; and, perhaps, service temperature. Users must realize that for the above example, for each square foot of pipe area there are 1.24 square feet of insulation surface area at a thickness of 2 inches thick. For a thickness of 3 inches, that same pipe would have 1.71 square feet of insulation surface area for each square foot of pipe area.
If this seems confusing, that is because it is. The use of a single heat-loss limitation value for all pipe sizes and temperatures, expressed as heat loss/insulation surface area, may be easy mathematically and save the specifier lots of work. It also may save the facility owner money otherwise spent to pay an engineering company to generate insulation thicknesses for each pipe at the facility. However, that approach does not work because it does not consider the heat loss from each lineal foot or each lineal meter of pipe length, which is what process control requires. Therefore, using a single value of heat loss/insulation surface area is misleading and is basically a poor way for specifiers to generate insulation thickness tables.
Energy prices have not had any influence on the insulation thicknesses determined by process control limits. Natural gas prices could increase from $8 to $100 per mcf and the insulation thicknesses determined by process control limits would remain unchanged.
Personnel protection. Another common way of generating insulation thickness tables is to limit the insulation surface temperature to some value that will keep personnel from getting burned if they come in contact with the insulation surface (or the metal jacketing that covers the insulation). In many cases, 140°F is the specified maximum allowable surface temperature. The design conditions used are generally a warm summer day when the air temperature is high and the wind speed is low (conditions that increase the insulation surface temperature). For the above 8-inch IPS, 600°F pipe with preformed mineral wool pipe insulation, warmer, calmer conditions might be used. These could include an ambient temperature of 90°F and no wind, rather than an average ambient temperature of 60°F and average wind speed of 5 mph. For this specific case, 3E Plus can be used with Calculation Type: Personnel Protection. The design data in Figure 4 (Table 1), along with the 140°F maximum allowable surface temperature, also can be input.
The calculated insulation thickness using 3E Plus for these specific conditions is 3.5 inches. The specifier then can take each pipe diameter and temperature, run 3E Plus with these conditions and with this particular mineral wool pipe insulation, and generate a complete thickness table for all standard pipe sizes and service temperatures—perhaps from 200° to 1,200°F in 200-degree increments—in just a few hours.
By contrast, PIP recommends only 2.5 inches of mineral wool to limit the surface temperature to 140°F on a 600°F, 8-inch IPS pipe. Apparently, more lenient design conditions were used to generate PIP’s surface temperature limitation tables.
The cost of energy did not influence the thickness table based on personnel protection. Oil could increase to $200 per barrel and the thicknesses required for personnel protection would remain the same. The price of energy has nothing to do with selecting an insulation thickness for personnel protection.
Condensation control. On below-ambient-temperature pipes, the overriding concern in almost all applications is the prevention of surface condensation. Condensation control is important for thermal insulation design on below-ambient service temperatures. This article focuses on hot service piping and equipment, however, and does not consider condensation control.
Energy savings. Thermal insulation definitely saves energy and money. While process control, personnel protection, and condensation control can be confusing, energy savings is quite simple. The basic concept is to reduce heat loss (or heat gain) from a pipe or piece of equipment and thereby use less energy. To understand how energy savings determine insulation thicknesses, the concept of economic thickness must be explored. (See “Multiple Choice, Part 2” in the December issue.)
A Fresh Approach
What about existing insulation that is economically insufficient? To maintain a competitive advantage, process industries must adapt to the sudden rise in energy prices seen in this decade. The prospect of tearing off and disposing of existing insulation and jacketing that is in good condition so that new, thicker insulation can be installed clearly would not be cost-effective. In fact, that process would generate a lot of scrap that would cost even more money to remove and dispose of properly.
A more efficient and cost-effective solution is to wrap new insulation over the top of the existing system. Figure 3 illustrates this concept using an overwrap of 1 inch of a mineral wool pipe and tank insulation on top of the existing system consisting of metal-jacketed, 3-inch-thick, commercially available, preformed mineral wool pipe insulation. For the example of a 600°F, 8-inch IPS pipe in a 60°F ambient temperature, this would decrease the heat loss from 197 Btu/hr-LF to 161 Btu/hr-LF, an 18-percent reduction. An economic thickness analysis with results generated by 3E Plus concludes that 1 inch of the mineral wool pipe and tank insulation is the economic thickness for this insulation retrofit.
The Wrap-Up
Energy prices have increased dramatically in the past decade. To combat the high prices, thermal insulation for hot service piping and equipment is a cost-effective way of reducing heat loss. At today’s energy prices, thermal insulation on hot service piping and equipment typically has a payback of less than 1 month compared to uninsulated surfaces. The insulation thickness tables used by industry today typically were generated when energy prices were much lower. This raises the question, Why not revise the existing insulation thickness tables to reflect today’s increased energy costs?
For new construction, or for a total insulation retrofit of existing piping and equipment, specifiers and facility owners should discard old insulation thickness tables and generate new ones using current energy costs. Use of the old insulation thickness tables results in unnecessary waste of money for heating energy. Use of new insulation thickness tables, generated using economic thicknesses and resulting in greater insulation thicknesses, will result in greater energy efficiency and can be cost-effective.
For existing insulated piping and equipment, an economical and practical option is to retrofit the insulation system with an overwrap of mineral wool pipe and tank insulation with new metal jacketing. There is the practical advantage that this work could be executed on a flexible schedule to accommodate the availability of insulators to do the work.
The choice is the facility owners’ to make: They can either waste money on heating energy by using obsolete insulation thickness tables or take steps to improve the thermal efficiency of their insulated piping and equipment by generating new, up-to-date thickness tables. The time spent doing this will be offset by cost-effective energy savings both immediately and in the future.
* Additional engineering would be required to derive the assumed 300,000 Btu/hr-LF number, but that is beyond the scope of this article.
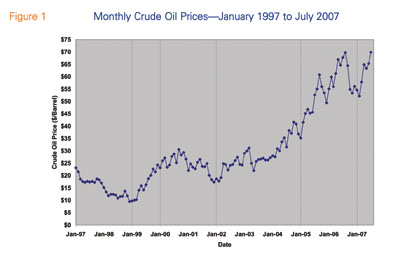 Figure 1
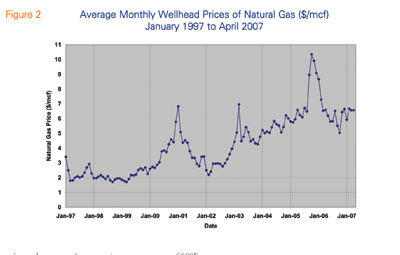 Figure 2
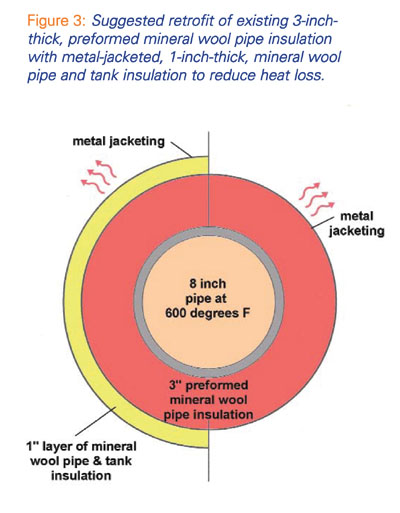 Figure 3
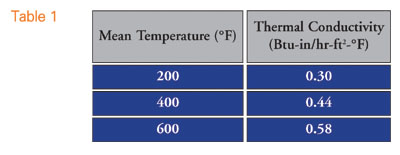 Figure 4