Recovery Gaining Traction in 2011
In 2010, the economy continued to dig itself out of the largest hole since the Great Depression. Despite growth of 2.8 percent, GDP remains below pre-recession levels, as do many key economic indicators. Going into the end of 2010, however, there was a notable shift in momentum toward greater confidence and increased spending by households and businesses. Consumer sentiment has improved significantly since mid-2010, with a better-than-expected holiday spending season. While consumers remain cautious, spending has returned to levels not seen in 3 years. Indeed, consumer spending is expected to grow by 3.0 percent in 2011 as some pent-up demand is released. This follows 2 consecutive years of contraction, again something not seen since the 1930s. This is good news, as the consumer sector accounts for 70 percent of the U.S. economy.
However, households continue to struggle with a weak housing market, high unemployment, high debt loads, and the destruction of household wealth. Since its peak in the second quarter of 2007, household wealth was still off $10.9 trillion at the end of the third quarter 2010. At its lowest, household wealth was down by $16.8 trillion, so only a third of the lost wealth has been regained. Since mid-2008, households have been steadily working to reduce debt loads. This lengthy course correction is typical in recessions sparked by financial crises. At the end of 2010, however, the debt-to-income ratio was at its lowest level in more than a decade as household balance sheets are slowly realigned.
With confidence improving and growth in U.S. exports abroad, there has been a significant and sustainable improvement in underlying final demand in the manufacturing, wholesale, and retail sectors. Due to the depth of the downturn, however, there remains a good bit of slack in the economy, both in productive capacity (with several exceptions in some materials industries) and the labor market. During the recession, 8.4 million jobs were lost. Since the beginning of 2010, the economy has recovered more than 1 million jobs. While this is an improvement, the economy has thus far not grown fast enough to absorb the vast number of unemployed and underemployed, which together now account for nearly 17 percent of the labor force. The unemployment rate rose to 9.6 percent during 2010 from 9.3 percent in 2009 as the number of new and returning entrants to the labor market more than offset net job growth. As the job market improves, the unemployment rate will ease to 9.4 percent in 2011 before falling to 8.4 percent in 2012.
The weak link in the recovery continues to be the housing market, which continues to struggle. Following 4 consecutive years of steep declines, housing starts rose 6.1 percent in 2010 as demand for housing grew in some areas while remaining stagnant in others. Home sales and home prices, however, continued to slide despite the homebuyer tax credit that expired in April. With nearly one in four mortgages underwater, defaults and foreclosures continue to add pressure to an already oversupplied housing market. This has created a huge “shadow” inventory of homes that are vacant or soon-to-be vacant but are not yet listed as inventory available for sale. By some estimates, this shadow inventory may be as high as 5 million. With high unemployment and debt levels, credit remains tight for many borrowers, restricting the pool of potential home buyers. As the number of households grows and the employment situation improves, so will housing. Housing starts are expected to improve in 2011, rising to 700,000 and then over 1 million in 2012 as a combination of job growth, healthier household balance sheets, and the release of pent-up demand generate momentum.
With the exception of several episodes of “flight to safety” after the collapse of Lehman Brothers in 2008 and the Greek meltdown this past spring, the U.S. dollar has been steadily depreciating vis-a-vis other major currencies since 2003. With a weaker dollar, anemic domestic consumer spending, and strong demand abroad (especially from emerging markets), U.S. trade has become more balanced. As the U.S. recovery gains traction in 2011, however, imports are likely to rise, partially reversing the recent trade balance improvement.
With a second $600 billion injection into credit markets, also known as quantitative easing II (QE II), the increased liquidity has further weakened the value of the dollar and renewed fears of an inflationary environment. Because world oil prices are denominated in dollars, dollar depreciation has contributed to higher oil prices. According to the U.S. Energy Information Administration (EIA), oil prices are expected to stay above $85 through 2012. That higher prices for energy and other commodities have not yet translated into broadly higher consumer prices likely reflects the reluctance of businesses to raise prices while consumers are still cautious. Should demand suddenly firm across all sectors, inflation could rise quickly.
During 2010, business investment in equipment and software surged as surviving businesses with plump balance sheets took advantage of deals and the opportunity to retool. This was offset, however, by declining investment in nonresidential structures, resulting in a 5.8 percent gain in overall business investment. Now that the virtuous cycle has reengaged, business investment is set to grow by 11.5 percent in 2011 as both segments grow together before slipping to an 8.5 percent growth rate in 2012.
As the recovery advances and business and household balance sheets improve, the unabated growth in government debt will demand some serious attention. The federal deficit was virtually unchanged at $1.4 trillion in 2010 and is projected to ease in the coming years as tax revenues rise. However, fiscal deficits are projected to remain above $1 trillion for the next several years. Current projections show total U.S. debt ballooning from 62 percent of GDP to nearly 100 percent in the next 5 years. Recently published research suggests that debt levels in excess of 100 percent of GDP tend to impose penalties on an economy’s growth potential.
Industrial Outlook
In the industrial sector, 2010 started out strong as momentum from the inventory rebuild was still playing out. As inventories were replenished, industrial production continued to advance on strong export demand. Industrial production rebounded 5.6 percent in 2010, with nearly all segments posting increases. Looking ahead to 2011 and 2012, industrial production will continue to advance as increasing domestic demand is added to continuing strength in exports.
Petroleum Refining. With the rise in industrial demand, firming consumer spending, and a slowly improving employment picture, gasoline demand has surpassed pre-recession levels. Declining inventories of refinery products will boost refinery production in 2011 and 2012. Looking ahead, projected high oil prices and tightening fuel efficiency standards will restrain gasoline demand growth in the future. Demand for other refinery products may also be impacted as EPA asserts its authority to regulate greenhouse gas emissions. As oil prices remain high, demand for biofuels, in particular corn ethanol, will grow. According to EIA, ethanol production is expected to grow from 860,000 barrels per day in 2010 to 910,000 barrels per day in 2011 and 920,000 barrels per day in 2012.
Gas Processing. Recent developments in shale gas have reversed concerns that the United States was running out of natural gas. With the development and implementation of new technologies, natural gas supplies from tight shale formations, once uneconomic, are now flooding the market, boosting inventories to record levels. The Marcellus formation that lies across parts of West Virginia, Pennsylvania, and New York is by some estimates the world’s largest natural gas reserve. As this industry progresses, demand for gas processing will increase significantly. Some energy analysts have suggested that Pittsburgh may become the next Houston, and the chemical industry has recently announced several expansions and new projects to take advantage of new ethane supplies.
Chemicals. As a supplier to most other industrials in some form or another, the chemical industry was among the first industrial sector to turn around. Chemical output (excluding pharmaceuticals) rose 7.0 percent in 2010 following 2 years of declines. A weak dollar, robust demand from emerging markets, and low natural gas prices created a favorable environment for the industry. According to the American Chemistry Council (ACC), chemical output is expected to advance further, growing by 2.8 percent in 2011 and 2.7 percent in 2012. ACC also projects that capital spending by the chemical industry is set to increase 6.0 percent in 2011 and 8.4 percent in 2012 as the industry makes investments to take advantage of new supplies of ethane from shale gas.
Food Processing. Following 2 years of decline, the output of the food processing sector rebounded 4.0 percent during 2010 as consumers who had cut back during the recession returned to some of their previous spending habits. Grocery sales were higher on increased sales of convenience foods, beverages, and organic/natural products. Also, inflation-adjusted spending at restaurants grew in 2010 for the first time since 2007. The outlook for food processing is for more modest growth during 2011 and 2012. Of concern are rising global food prices, which hit a new high at the end of 2010.
Pulp and Paper. The pulp and paper sector also rebounded in 2010 following steep declines during the recession; however, demand for paper continues to wane as more media outlets shift toward electronic delivery and the low cost and convenience of e-mail and electronic forms continues to chip away at traditional paper uses. Paperboard, largely used for shipping, has improved as the industrial sector has improved. According to the American Forest and Paper Association (AF&PA), the industry continued to trim capacity during the recession as structural shifts in the paper market combined with an exceptionally weak economy caused paper sales to collapse. AF&PA expects that paper capacity will be stable during 2011 and 2012 as demand for paper and paper products returns.
Shipbuilding. Following an upturn during the beginning of the year, shipbuilding remains weak going into 2011. Despite improvements in the fundamentals for shipbuilding, U.S. shipbuilders face increasing competition from Chinese and Indian shipbuilders that are taking an increasing share of the global shipbuilding business. Trade volumes rebounded in 2010 from an unprecedented collapse sparked by the financial crisis. According to the International Monetary Fund, trade volumes are set to expand 7.0 percent this year. Rigs from global offshore energy producers are a source of growing demand. In addition, a trend toward direct ownership of ships by the major producing companies themselves is emerging that could bolster shipbuilding demand in the years ahead.
Summary
Following the worst period in U.S. economic history since the Great Depression, the U.S. economy has returned to a growth trajectory that will put millions of unemployed Americans back to work. Greater confidence by households and business, improved private sector balance sheets, and continued strength from exports are propelling the economy forward. U.S. GDP is expected to grow by 3.2 percent in 2011 and 2.8 percent in 2012 as the recovery gains traction and a positive feedback loop strengthens. Still weakened by the continuing fallout from the housing debacle, a permanent shift in consumer attitudes, and unsustainable federal debt growth, the outlook is for modest but solid growth in the years ahead. There are several risks to the outlook (including terrorism, sovereign default, and currency war), any one of which could destabilize this fragile recovery.
 Figure 1
Key Economic Indicators
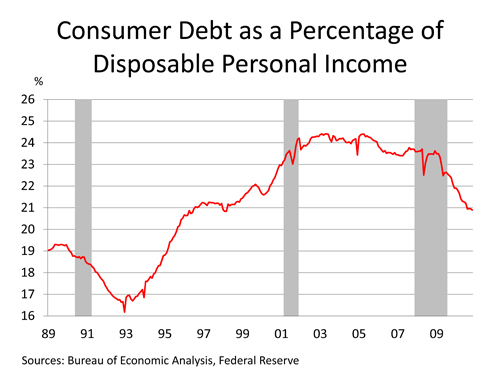 Figure 2
Consumer Debt as a Percentage of Disposable Personal Income
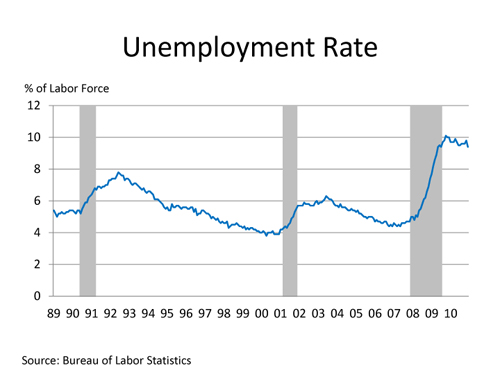 Figure 3
Unemployment Rate
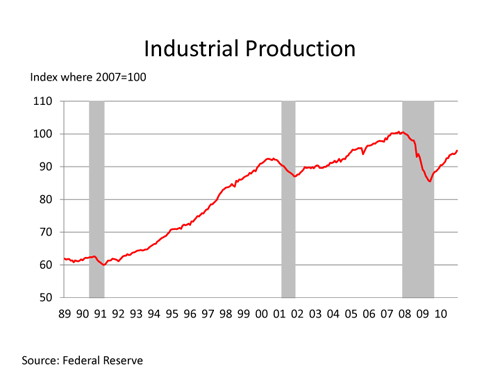 Figure 4
Industrial Production