The Role of Insulation In a Comprehensive Industrial Energy Efficiency Program
The U.S. Department of Energy (DOE) Save Energy Now (SEN) program has sponsored numerous steam Energy System Assessments (ESAs) that have identified a range of energy conservation measures to reduce the cost of generating steam in industrial facilities. The assessments use the BestPractices Steam tools as the basis for the analytical methodology. The energy conservation measures that are typically considered are listed in Table 1.
The 21 measures represent a range of opportunities that include operational changes, low-cost projects, and higher cost projects. Experiences with Measure 16, “Improve Insulation,” are the subject of this narrative, as observed by SEN program practitioners during the course of 11 ESAs.
Critical Questions
The assessments use the following BestPractices Steam tools:
- The Steam System Scoping Tool (SSST), which is an operational practices self-evaluation checklist
- The Steam System Assessment Tool, which contains calculation algorithms to evaluate the energy cost reduction opportunity for the 21 measures
- The 3E Plus® insulation assessment tool
The SSST serves as an excellent diagnostic tool to guide the in-plant analyses conducted during a 3-day, on-site activity. During this part of the assessment, the following questions posed to the operators often provide the most useful input for the analyses:
- How many steam traps are in the distribution piping, and are they routinely maintained?
- What is the condition of insulation on the piping, tanks, and valves?
- What is the approximate length of steam mains and laterals in the system?
Questions 2 and 3 set the stage for the insulation analysis to be performed. Most operations personnel are realistic in their responses to Question 2, though there are differing perceptions about the importance of condensate pipe insulation. Based on responses to Question 3, the length of the principal pipe segments in the system is often not readily known.
System Characteristics
The systems assessed by the authors of this article thus far:
- were installed for eight different industrial process sectors;
- had installed capacities ranging from more than 1 million pounds per hour (PPH) to less than 50,000 PPH;
- had pressures of 1,000 pounds per square inch gauge (PSIG), with superheat to 5 PSIG; and
- had distribution pipe networks of lengths that range from more than 2 miles to approximately 3,000 feet.
The condition of insulation on the steam distribution piping varied widely, but in all cases some level of improvement opportunity was identified. Conditions ranged from deterioration over a period of years and lack of reinsulation when piping changes had been made to missing insulation on steam laterals and complete subsystems, as well as uninsulated condensate return piping. Valves, sensors, elbows, and other system appurtenances are frequently totally or partially uninsulated.
Estimating Losses
A two-step methodology is employed to estimate losses. An important part of the on-site investigation is “walking the system” to observe the distribution piping, including lengths and locations, pipe sizes, and insulation types and condition. The information collected during the field survey is entered into a site-specific spreadsheet that results in a baseline estimate of piping system losses. Table 2 is a partial example of the spreadsheet. It lists the approximate lengths and condition of the various segments of pipe observed during the field survey. Total length of uninsulated pipe is listed, and a weighted average pipe diameter is determined. These are inputs needed to run the 3E Plus model.
For this case, the system was transporting steam at 5 PSIG, which has a saturation temperature (the temperature at which condensation occurs at this pressure) of 228°F.
As noted above, valve bodies are often left uninsulated or have their insulation blankets removed and not replaced. To include some allowance for insulated valves in the insulation measure evaluations, tables were developed that interpret losses in “equivalent feet” of pipe. The tables are based on information contained in U.S. DOE Steam Tip 17, which lists savings potentials for installing removable covers on valves. The losses in British thermal units per hour (Btu/hr) relate to about 3.5 linear feet of bare pipe for fluids of 400°F. The basis for this estimate is indicated in Table 3.
With the benefit of the survey and analysis, the 3E Plus tool can be used to determine the heat lost from the bare pipe segments and the savings due to insulation. Assuming 2 inches of calcium silicate with an aluminum jacket, the average size 6-inch-diameter pipe will change from losing 360 Btu per square foot (Btu/sq ft) of pipe surface to losing just 21 Btu/sq ft.
The annual cost savings resulting from insulation repairs for this project now can be estimated, as indicated in Table 4.
The results shown in Table 4 are not for an actual site but are representative of a heating plant with a relatively extensive piping network. The savings shown are for steam piping only.
Similar analyses for a condensate system showed comparable savings. The temperature of the condensate pipe is lower than the steam pipe (150°F to 180°F compared to 228°F for steam in this case), and condensate piping is smaller in diameter than the steam pipe-typically half the size. However, the quantities in linear feet of uninsulated condensate pipe tend to be larger, sometimes representing more than 50 percent of a condensate network.
For the SEN ESAs, the results of this methodology, along with the other measures, are then used in the Steam System Assessment Tool analyses to determine the aggregate energy cost reduction opportunity.
While cost estimates for the energy conservation opportunities are not generated as part of the assessments, rough budgetary estimates are reported to the DOE based on experience with other projects. Short-term paybacks, in the range of 2 years to less than a year, are frequently observed.
What Does This Mean To Managers and Owner?
It is interesting to consider the characteristics of this hypothetical system from the perspective of lessons for management. As Table 4 shows, annual losses for the reinsulated steam system are 1,190 million Btus (mmBtus) on an annual basis. While only about 15 percent of the existing piping required reinsulation, thermal losses will be reduced by 60 percent.
To put these values in an operational perspective, the energy required to keep the steam lines in steady-state operation can represent a significant portion of plant capacity or a single boiler’s output. The analysis shows that, with a properly insulated system, losses can be cut in half or reduced even more than that.
In some cases, where large distribution systems serve small boiler plants, uninsulated pipe also can cause operating problems, such as low condensate return temperatures, or poor-quality steam before reaching the end of mains or laterals. These issues increase boiler maintenance costs and can cause premature equipment failures.
Based on the SEN assessments, there are substantial cost-effective opportunities to reduce steam system inefficiencies by applying insulation to bare or damaged pipe segments, tanks, and valves. In some circumstances, a secondary benefit due to reductions in other maintenance costs will also occur.
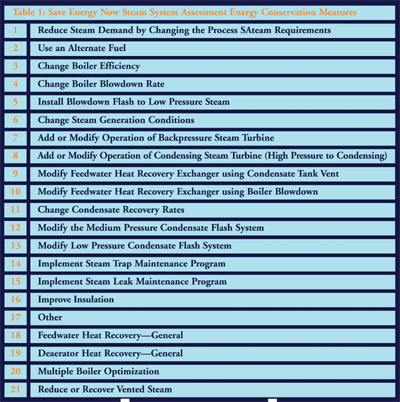 Figure 1
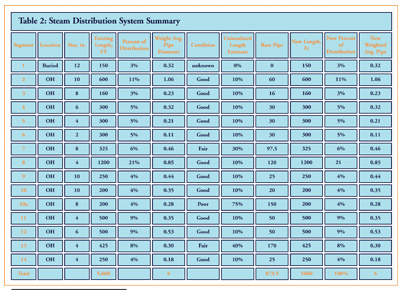 Figure 2
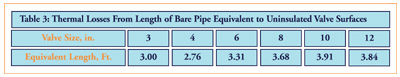 Figure 3
 Figure 4