What Is Average?
Thermal insulation materials are commercially available in a variety of forms, shapes, and sizes, including blankets, boards, loose fill, pre-formed pipe, rigid foams, flexible foams, and spray foams. The materials appear to be simple but are highly engineered to optimize different properties, such as thermal performance, high-temperature performance, compressive strength, rigidity or flexibility, water repellence, flame spread prevention, inhibition of metal surface corrosion, and various health and safety considerations. To meet quality standards, these materials must retain the same properties consistently from production batch to production batch. Additionally, they often must be made in a form that is relatively easy to install so as to be economical in their final application. Each different type of material is designed to perform in particular applications over a particular temperature range.
Various organizations publish standards for thermal insulation materials and for testing and applying the materials. These include ASTM International, International Organi-zation for Standardization (ISO), and the German Institute for Standardization (DIN—Deutsches Institut fur Normung). They sometimes coordinate internationally so each type of generic material meets minimum performance criteria. Standard test procedures are used to measure performance as determined by material properties. If two companies manufacturing the same generic material use different test procedures, it is challenging and perhaps even impossible for users to compare performance of the two materials. Additionally, government organizations need to be able to specify materials using industry standards and reference standard test procedures.
ASTM materials standards can list typical or limiting values as a guide for comparing available products and making informed purchase decisions. Reference values are generally based on “average” values for typical products, but these average values must be accurately determined to serve as a useful guide. Understanding the methods used as the basis for different standards can help users choose their reference points appropriately.
Defining “Average”
The following hypothetical situation illustrates how different approaches to averaging can yield vastly different values. Jack and his sister Jill both started businesses on January 1, 1998. Their business histories over the first 11 years show striking similarities—and differences:
- Both businesses had sales of $1 million the first year (1998), and
- Both businesses had sales of $11 million the eleventh year (2008).
But
- Jack’s business increased by a steady $1 million per year over 10 years, while
- Jill’s business increased by a steady 27 percent per year over the 10 years.
When they compared performance, they looked at “average” annual sales for the 11-year period.
Jill calculated her average three ways, getting different answers each time:
- She calculated total sales for all years and divided by 11: $4.336 million [=47.7 / 11]
- She averaged the endpoints: (Year 1 + Year 11) / 2:
$6 million - She took the sales figure for the midpoint of the range, Year 6: $3.3 million
- With linear plots (such as Jack’s case), one can arrive at the “correct” result by averaging using a variety of methods.
- With curved plots (such as Jill’s case), one must average using the correct way only.
- Definition Difference—The thermal conductivity value listed by C201 is defined differently than that for C177, so one should not expect to find the same values listed.
- Different Tools Are More Accurate for Different Measurements—Despite the conflicting definitions, the two sets of numbers should be consistent after the appropriate mathematical adjustments are made; that they are not suggests that different methods are more accurate for different applications.
- For thermal insulations, the correct term to use for the heat transport coefficient is “apparent thermal conductivity”—rather than simply “thermal conductivity”—to emphasize that heat moves through the insulation not only by conduction, but also by radiation (see ASTM C168 and ASTM C1045 for details). For brevity, the shorter “thermal conductivity” is used in this article, but in each case it should be understood to mean “apparent thermal conductivity.”
- ASTM C892-05, “Standard Specification for High-Temperature Fiber Blanket Thermal Insulation,” Annual Book of ASTM Standards, Vol 04.06.
- ASTM C201-93(2004), “Standard Test Method for Thermal Conductivity of Refractories,” Annual Book of ASTM Standards, Vol 15.01.
- ASTM C177-04, “Standard Test Method for Steady-State Heat Flux Measurements and Thermal Transmission Properties by Means of the Guarded-Hot-Plate Apparatus,” Annual Book of ASTM Standards, Vol 04.06.
Jack calculated his average the same three ways, but he got the same result each time: $6 million.
Figure 1 shows these values graphically so they can be more easily compared.
What conclusions can be drawn from comparing Jack’s and Jill’s businesses?
In Jill’s case, the true average is $4.336 million per year, which can be tested by multiplying it by the number of years in business to get the total sales for the period (4.336 x 11 = 47.7). But Jill’s true average is not equal to the sales figure for the “average” year, Year 6.
The Laws of Average and Thermal Performance of Refractory Insulation Materials
Depending on the application, refractory insulation uses two types of thermal testing standards: ASTM C201—the water calorimeter method—and ASTM C177—the guarded hot plate method. These may present a situation similar to the Jack-and-Jill example. Test method C201 measures average thermal conductivity1 taking two temperature points (one at a very low temperature and one at a very high temperature), calculating the average of those two data points, and designating that the average for the entire range. If the thermal conductivity-mean temperature relationship is linear, or nearly linear, this approach will suffice. However, for a highly non-linear relationship (i.e., a curve), the farther apart the two temperature values, the greater the potential for error. By contrast, test method ASTM C177 takes much smaller increments of temperature and represents the mean temperature as the average of those narrow increments.
This is an important concept for anyone using ASTM standards for specifying and testing refractory insulation materials to understand because it gives context to seemingly conflicting information on limiting values for thermal conductivity in ASTM C892, “Standard Specification for High-Temperature Fiber Blanket Thermal Insulation,” published in the ASTM Book of Standards, Volume 04.06. ASTM C892 allows thermal testing to be conducted by either ASTM C177 or ASTM C201. C892 lists thermal conductivity values in two sections, one as determined by C177, and the other by C201. In most cases, the values for a specific grade at a specific mean temperature are significantly different.
Here is an example: commonly used Grade 8 blanket insulation material. As with all insulation materials, its thermal conductivity changes with mean temperature. C892 lists quite different thermal conductivity values (one for each of the two methods) for this grade, shown in Table 2.
The C177 values range from 33 percent greater to 1 percent lower, depending on the mean temperature. Except at a mean temperature of 2,000°F, thermal conductivity values reported using C201 simply look lower—and possibly better—than those using C177.
Figure 2 presents the same information graphically.
Why do the different thermal test procedures offer two different sets of results for the same material, tested at the same mean temperature? The answer appears to have two roots:
Definition Difference
With ASTM C177, the measured thermal conductivity value associated with a specific temperature is the actual value of thermal conductivity at that mean temperature—i.e., it is independent of the temperature difference (dT) involved in the measurement, provided the difference is small. One would thus measure the same value for thermal conductivity at 800°C whether hot and cold surfaces are at 850°C and 750°C, 820°C and 780°C, or 801°C and 799°C because the mean temperature is always 800° F. (Mathematically, it is the thermal conductivity one approaches, in theory, as the dT used in the measurement approaches zero.)
In contrast, the thermal conductivity value ASTM C201 associates with 800°C is the average thermal conductivity value for a sample that spans a large dT range whose average temperature is 800°C (e.g., a dT range from 50°C to 1,550°C). The value obtained by running the test method over such a wide temperature range is generally not equal to the thermal conductivity at, in this example, 800°C; in fact, the variance using large temperature ranges can be quite large.
The different approaches illustrate that the average thermal conductivity value over a large temperature range, in general, can be significantly different from the thermal conductivity value at the average temperature of that range. The fact that the two methods define “average thermal conductivity” somewhat differently should not necessarily present a problem to ASTM C892 users, as long as they are aware of the differences.
Choosing the Right Method for Given Conditions
The C201 method was originally developed for rigid, higher density refractory materials with thermal conductivity values 3 to 10 times greater than those for typical thermal insulation materials. Design limitations in the C201 apparatus limit the ability to make thermal performance determinations over the lower half of the C892 temperature range. As mean temperature increases, therefore, the correspondingly larger test temperature differences make it more difficult to devise effective thermal guarding techniques, resulting in greater measurement deviations due to increases in extraneous heat loss.
The guarded hot plate test method that is the basis for ASTM C177 more successfully accommodates temperature ranges below 2,000°F. It is generally regarded as the method of choice for the lower half of the C892 temperature range. At temperatures above 2,000°F, however, C177 tests become increasingly difficult to conduct, and C201 becomes the better option. The two methods are thus complementary for application over the entire C892 temperature range.
Conclusions and Recommendations
Material and test standards for thermal insulation materials provide valuable support to specifiers, designers, and users working with high-temperature products. Thermal conductivity data tabulated in ASTM C892 is based on studies made more than 30 years ago; it may be time to reexamine the standard to enhance its usefulness. The guarded hot plate test method could be considered a primary resource for generating new thermal conductivity data, and C201 tests could be used for the top end of the temperature range. It would be important to design a coordinated program to harmonize data by the two methods in the overlapping temperature range.
References
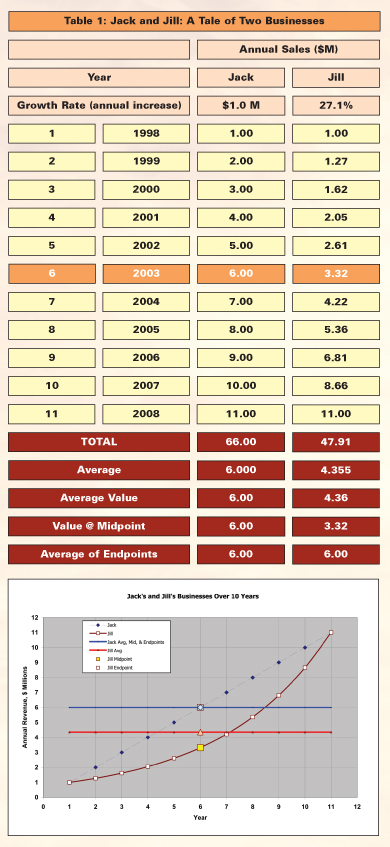 Figure 1
Over 10 years, Jack’s business grew linearly at a rate of $1 million per year, while Jill’s grew at a rate of 27 percent per year, resulting in different revenue averages. Note that there are 11 data points, since each curve has a beginning and ending data point.
 Figure 2
Maximum allowable thermal conductivity values for high-temperature fiber blanket thermal insulation tested using ASTM C177 and ASTM C201 test procedures (from ASTM C892, Table 1).
 Figure 3
Thermal conductivity values based on ASTM C177 and ASTM C201 test methods.