Insulation and Temperature–A Useful Relationship
Introduction
Understanding that the temperature profile across an assembly varies in proportion to the R-values of the individual components is a useful tool for predicting the temperature gradient in a wall. The insulating ability of insulation is mainly characterized by its R-value or resistance to heat flow. The units of R-value (square feet * degrees F * hour)/BTU seem unnatural but are easier to understand if put in context.
The basic heat transfer equation is:
Q (BTU/hr) = U (overall heat transfer coefficient)
x A (square feet) x ∆T (degrees F)
The units of U (overall heat transfer coefficient) are therefore BTU/hr per square foot per degree F. It makes sense. For a unit area (1 square foot), U describes the heat flow (BTU/hour) for a 1°F temperature difference driving force.
R is 1/U, so the units of R become (square feet * degrees F)/BTU per hour or (square feet * degrees F * hour)/BTU. Understanding the units of R explains what the insulation community knows intuitively: as R-value increases, U and resulting heat transfer rate decrease. While R-value affects the key parameter of heat flow, it does not tell the whole story. The temperature profile or gradient across an assembly can also be important.
Temperature Profile
The temperature change across an element of an assembly is proportional to that element’s share of the total R-value of the assembly. To illustrate that principle, consider the simplified case of a wall section with R-13 batt insulation in the stud cavity and a continuous layer of 1″ foam insulation as shown in Figure 1 (framing, inside finish, sheathing, and siding are not shown to keep the example simple). For an indoor temperature of 68°F and an outdoor temperature of 8°F, the temperature at the interface between the batt and the foam will be 27°F (effect of indoor and outdoor air films is omitted).
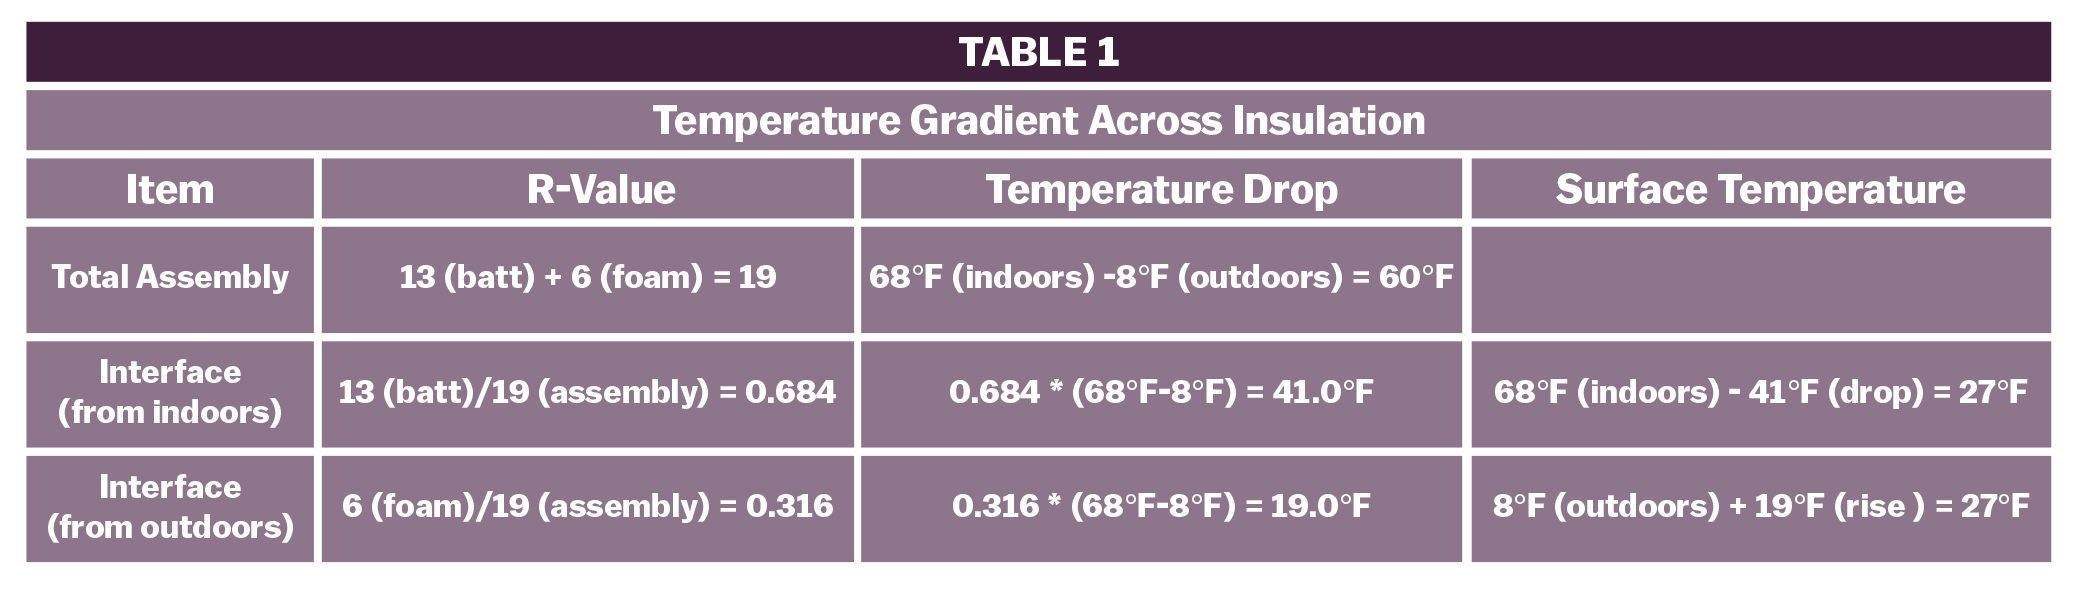
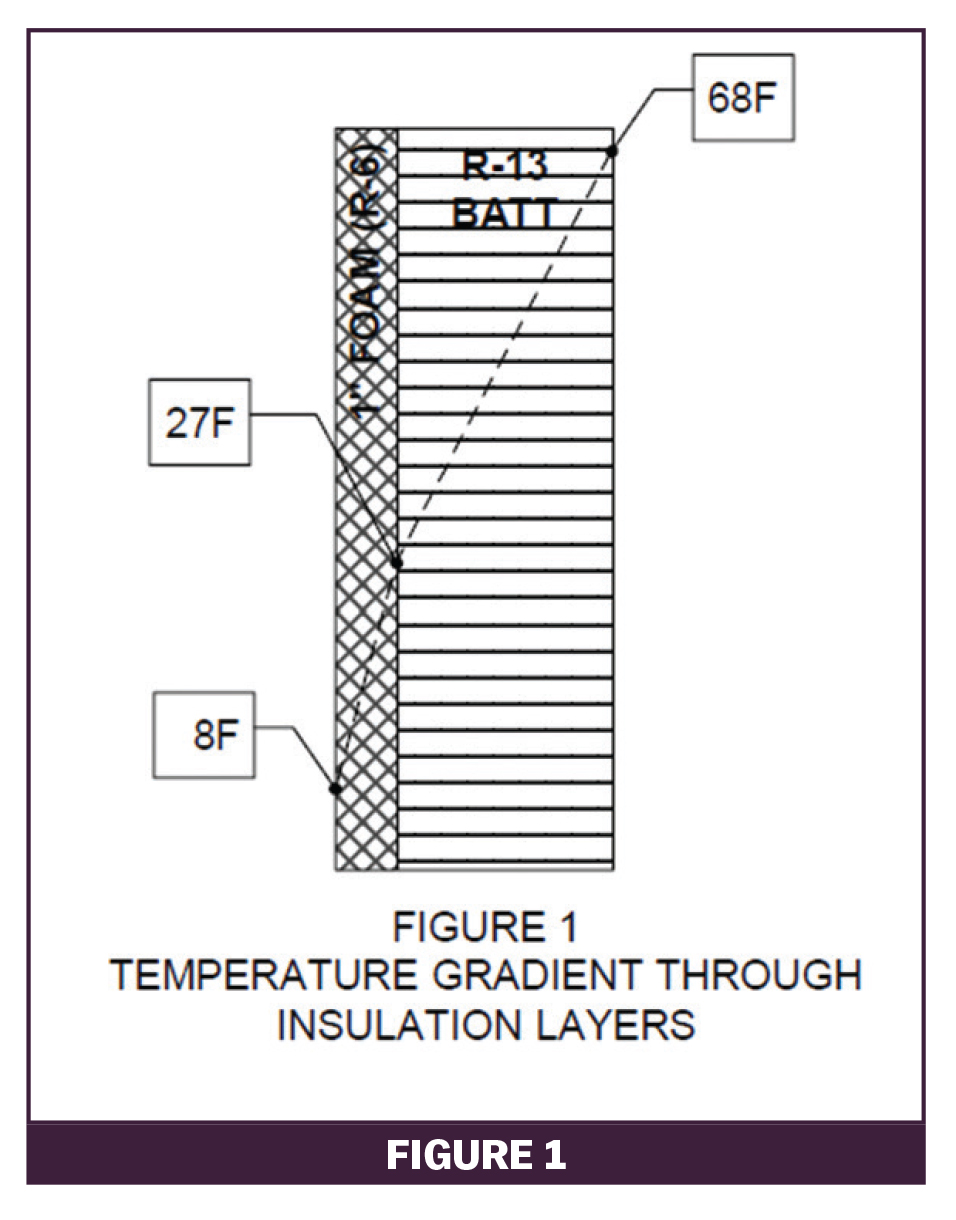
Table 1 shows the calculation for the example in Figure 1. The technique applies to any number of component layers in an assembly.
An Application That Matters
From the standpoint of heat flow, the general rule is that more insulation is better (lower heat flow). Heat flow is not always the only consideration.
Consider a building with an insulated steel deck roof, a suspended ceiling, and ducted HVAC return, so the cavity above the ceiling is not a return air plenum. Table 2 shows the U-value calculation for this assembly.

Applying the temperature gradient calculation to the uninsulated ceiling construction predicts a ceiling cavity temperature of 66°F on a design day (70°F indoors/0°F outdoors):
- Assembly R-value: 33.36
- R-value from outdoors to ceiling cavity: 31.50
- Temperature difference: (31.50/33.36)*(70 − 0) 66.1°F
- Ceiling cavity temperature (0°F outdoors + calculated difference): 66.1°F
With a 66°F ceiling cavity temperature on the coldest day, there is no risk of pipes freezing and ducts can be insulated to the thickness required for ducts within the conditioned space.
Suppose the owner decides to insulate the ceiling with R-21 fiber glass batts for additional energy savings. Would that decision be smart? To determine an answer, the designer has to consider both the cost of energy saved as well as the impact on the temperature of the air in the ceiling cavity.
- With R-21 insulation added to the ceiling, the assembly U-value (outdoors to occupied space) would drop from 0.030 to 0.018. The resulting design day heat loss for 1000 square feet of roof/ceiling assembly would drop from 2100 BTUH to 1260 BTUH.
- With annual heating energy use of perhaps 750 equivalent full load hours (reasonable for a commercial building with internal heat gains from lights, people, and equipment), the added insulation would save 7 therms of gas or $8.40/year at $1.20/therm.(2100 – 1260) BTU/hr * 750 hours
100,000 BTU/therm * 90% efficiency = 7 thermsBased on perhaps $1/square foot to insulate 1000 square feet of ceiling, the simple payback on the investment would be more than 100 years. Not harmful, but not economical. - The more important question is what would happen to the ceiling cavity temperature. The added insulation above the ceiling changes that component’s R‑value and the resulting temperature profile.Assembly R-value 54.36
R-value from outdoors to attic: 31.50
Temperature difference (31.50/54.36)*(70 − 0): 40.6°F
Ceiling cavity temperature (0°F outdoors + calculated difference): 40.6°F
While there is still no risk of pipes freezing at 40°F, the temperature is close enough for worry if the building goes into setback mode over a weekend. Plus, the HVAC ducts are now outside the effective building insulation envelope. Heat loss from supply ducts to the colder ceiling cavity will lower heating supply air temperature to the occupied space. That lower supply air temperature might leave some occupied rooms short of heat. Likewise, for cooling ducts will be in a warmer than anticipated environment with corresponding unwanted (and possibly unexpected) supply air temperature ride that reduces space cooling capacity.
Adding insulation would reduce heat loss, but the cost to install might or might not provide attractive operating cost savings. And it is just as important to consider the change in temperature profile when deciding how much insulation to add and where to put it. In this case, adding insulation on top of the ceiling reduces the ceiling cavity temperature enough to cause concern.
Wood Frame Construction
Wood frame construction is popular for light commercial buildings or 2 or 3 floors of apartments over first floor commercial space. Cavity insulation in a 6″ stud wall might be R-21. The R-6.88 insulating value of a 2×6 wood stud is so much less than the R-21 cavity insulation that U-value calculations have to recognize the difference. The U-value calculation for wood framing (stud wall or joist/rafter ceiling or roof assembly) uses an area weighted average technique. The weighted average accounts for the lower insulating value of the wood framing compared to the cavity insulation. Wood framing is common for walls but is also used for roof/ceiling construction on small buildings. Table 3 shows the U-value calculation for a wood frame roof assembly with an unvented attic and insulation in the roof rafters.
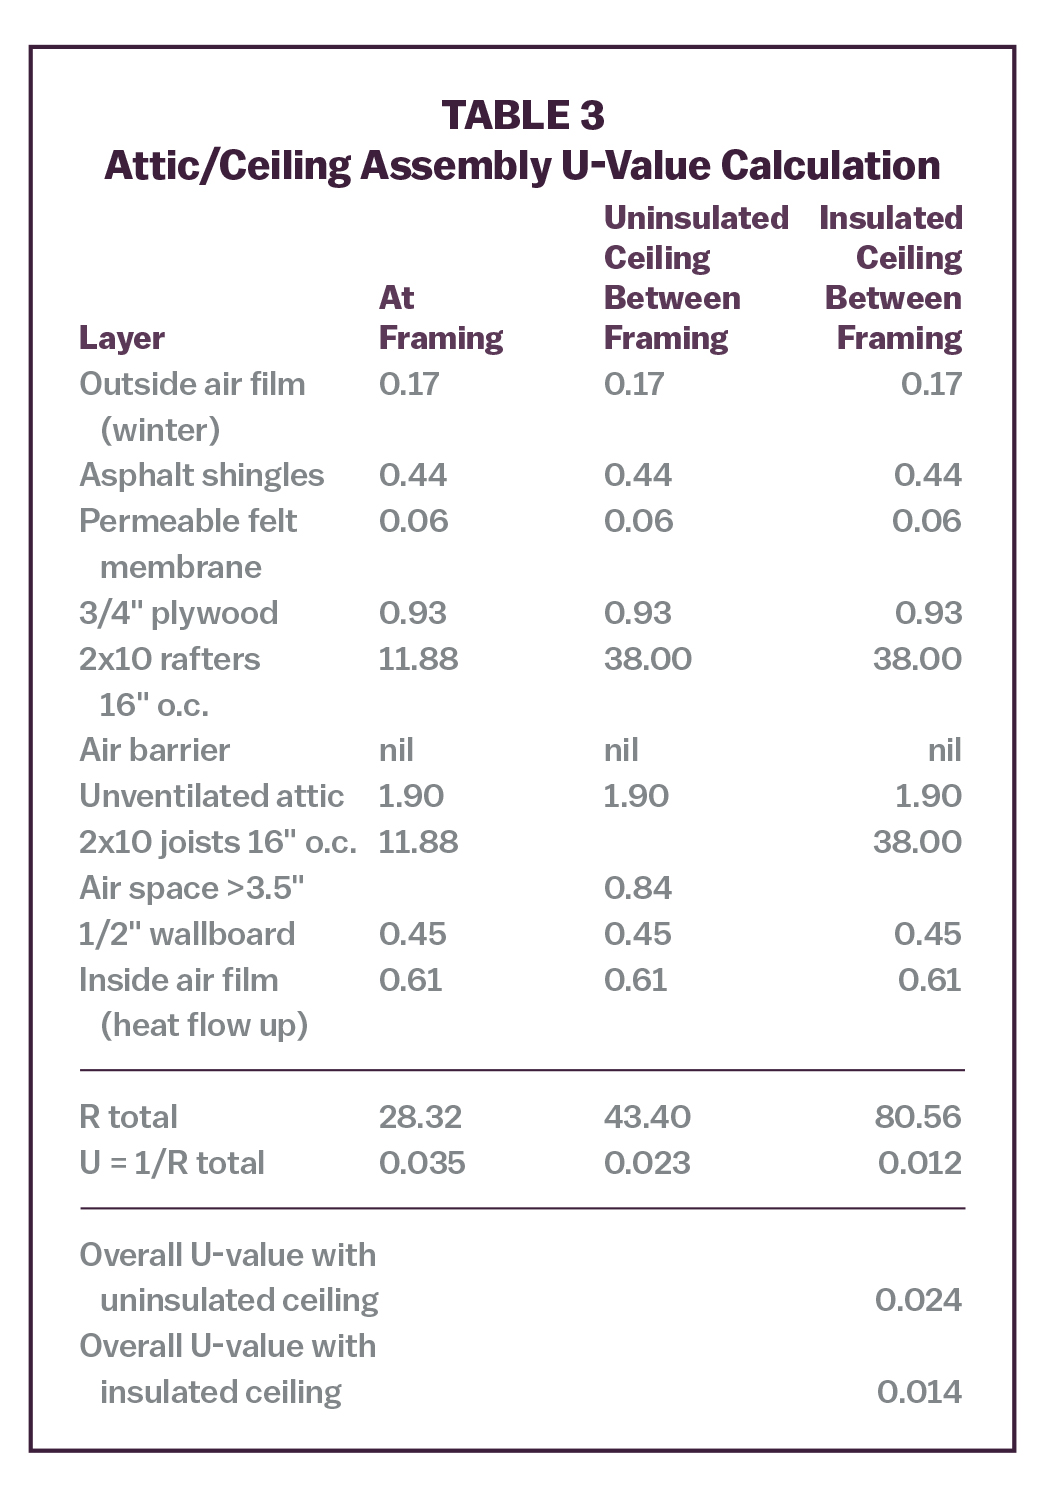
Consider a variation on the ceiling plenum example above—a small, wood frame office building with the roof construction as shown in Table 3. The middle of the attic might be finished space with knee walls and unoccupied eave space left for HVAC equipment and ducts. The eave space is within the insulated envelope, so HVAC ducts and equipment can be insulated to the standards for equipment in conditioned space. With insulation in the rafters and an unvented attic, the floor of the eave space/ceiling of the occupied space below is typically not insulated.
The temperature gradient calculation for this construction predicts a temperature of 60°F in the eave space on a design day (70°F indoors/0°F outdoors):
- Assembly U-value (weighted average of at and between studs): 0.024
- Assembly R-value (1/U): 41.67
- U-value from outdoors to attic (weighted average): 0.028
- R-value from outdoors to attic (1/U): 35.71
- Temperature difference (35.71/41.67)*(70 − 0): 60.0°F
- Eave space temperature (0°F outdoors + calculated difference): 60.0°F
With 60°F in the eave space on the coldest day, there is no risk of pipes freezing and minimal waste heat loss from the heating system ducts.
Suppose the owner decides to insulate the ceiling of the floor below. With an additional R-38 insulation in the ceiling joist bays, the assembly U-value (outdoors to occupied space) would drop from 0.024 to 0.014.
The added insulation in the ceiling joist bays (eave space floor) changes that component’s share of the assembly R-value and the resulting temperature profile:
- Assembly U-value (weighted average of at and between studs): 0.014
- Assembly R-value (1/U): 71.43
- U-value from outdoors to attic (weighted average): 0.028
- R-value from outdoors to attic (1/U): 35.71
- Temperature difference (35.71/71.43)*(70 − 0): 35.0°F
- Eave space temperature (0°F outdoors + calculated difference): 35.0°F
While there is still no risk of freezing pipes that run through the eave space, the temperature is dangerously close. At a setback temperature setting of 55°F, the eave space temperature could drop below 32°F and risk pipe freezing if the outdoor temperature drops below 9°F.
More importantly, high R-value of the insulation in the floor of the ceiling below puts the heating system outside the effective insulation envelope. Like the example of the insulated ceiling cavity, heat loss from supply ducts to the colder eave space will lower supply air temperature to the occupied space. The lower supply air temperature from adding insulation to the eave space floor might leave the occupied rooms below short of heat.
Thermal Bridges and Surface Temperature
The wood frame construction example illustrates a weighted average technique to account for thermal bridges that have some insulating value. Thermal bridges like steel studs that have no insulating value present a different problem.
ASHRAE Standard 90.1 and the International Energy Conservation Code (IECC) contain adjustments to cavity insulation R‑values to account for the thermal bridging effect of steel studs. The developers of the table calculated the multidimensional heat flow to provide adjustment factors that eliminate the need for the weighted average calculation used for wood framing. Table 4 lists some common cases from the Standard 90.1/IECC tables.
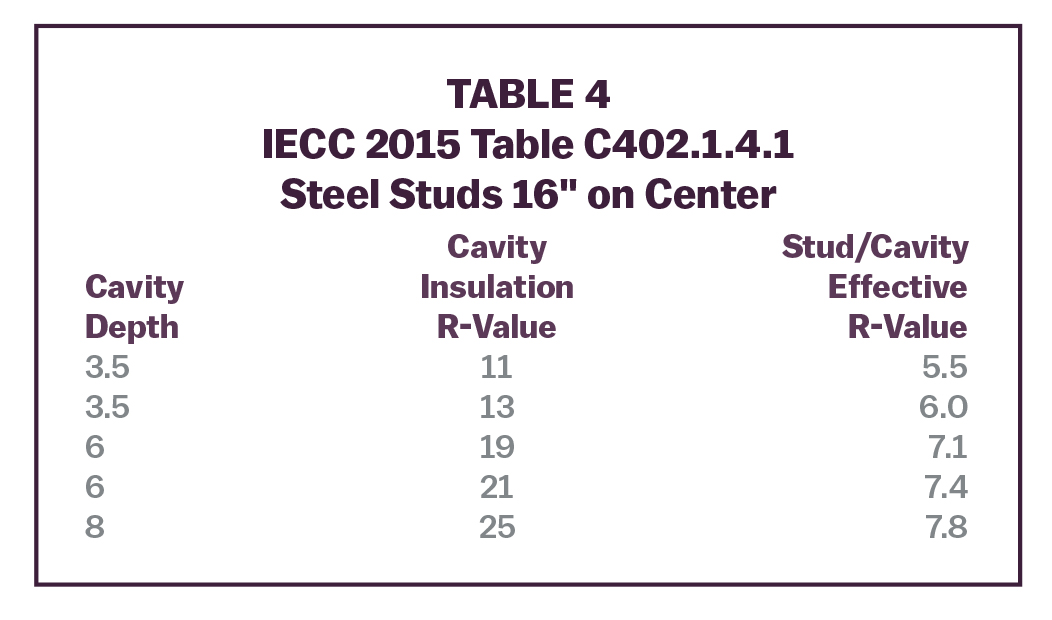
The effective cavity R-values represent the combined performance of the stud (or joist or rafter) and the insulation. There is no need for the weighted average calculation (at framing/between framing) used for wood frame construction. The R-values in the table apply to heat loss and space temperature calculations.
Condensation risk and the related phenomenon of “ghosting” (fine dirt particle deposits that highlight studs) depend on local surface temperature. The R‑value/temperature gradient calculation that predicts the temperature profile in an assembly also works to predict inside surface temperature. For that calculation, the R‑value from outdoors to the inside surface is the R-value of the assembly minus the R-value of the inside air film:
- 0.68 for vertical surfaces
- 0.61 for horizontal surfaces with heat flow up
- 0.92 for horizontal surfaces with heat flow down
Condensation forms on any surface whose temperature is below the dewpoint of the adjacent air. If the surface temperature is below 32°F (as could happen on door and window frames), condensation appears as frost. Ghosting or dirt deposits tend to occur where the local surface temperature is lower than the adjacent surfaces.
Steel studs have such high thermal conductivity compared to insulation that analysts need a technique to estimate surface temperature at the “framing” in steel stud frame construction. The Modified Zone Method for Metal Stud Walls with Insulated Cavities1, 2 provides a workable technique.
Consider 2 frame wall constructions with similar U-values: 2×6 studs with R-21 cavity insulation (assembly U=0.106) and 2×4 studs with R-11 cavity insulation and R‑3 continuous insulation outside the studs (assembly U=0.095). Table 5 presents the U-value calculations for those 2 walls.
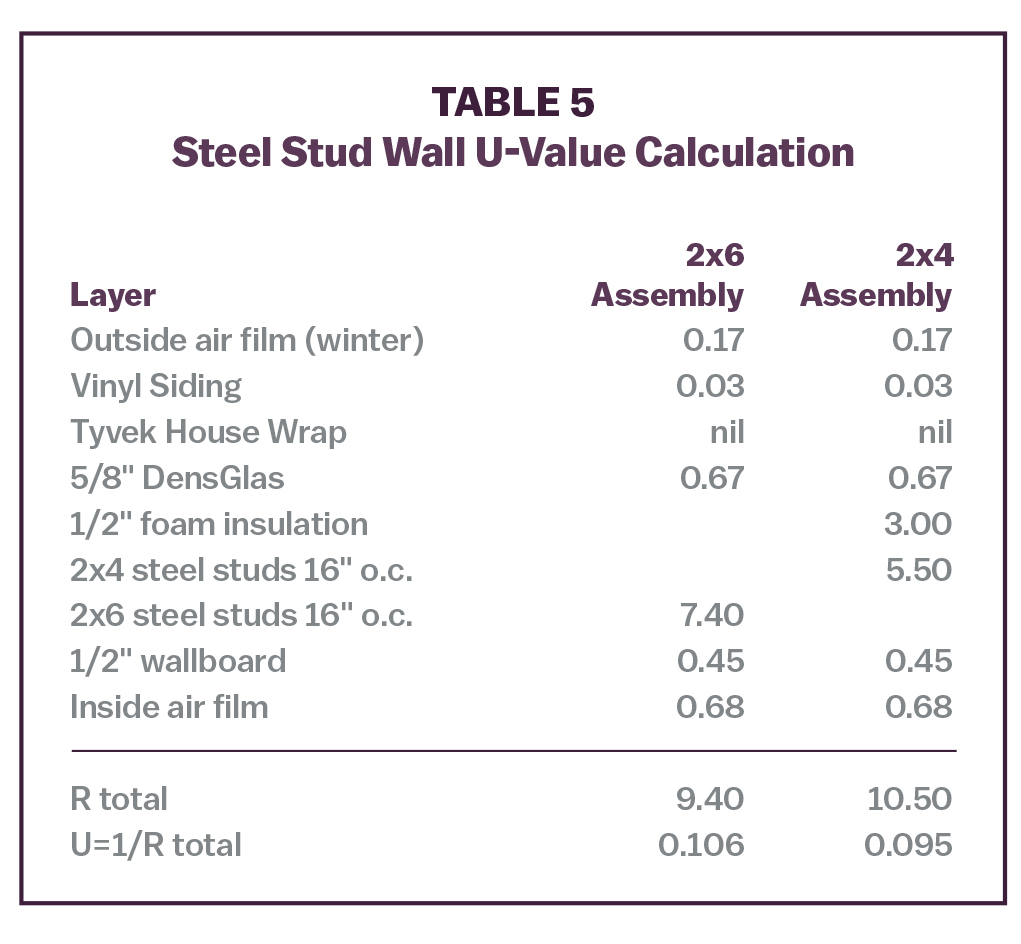
The 2×4 wall has a slight edge in terms of lower heat loss, but the energy savings compared to the 2×6 wall might not justify the added labor and material cost to install the foam insulation layer. (Unattractive economics does not stop the building code from requiring the continuous insulation layer for steel stud cavity wall construction.)
Analyzing surface temperature with consideration of the steel stud thermal bridge might lead to a different conclusion.
The thermal conductivity of steel studs (314 BTU/hr/F per inch of thickness) is so much higher than fiber glass batt (0.29 BTU/hr/F per inch of thickness) that the thermal bridge effect of the steel stud extends beyond the width of the stud. The high thermal conductivity (low R-value) of the steel stud means the cold region of the studs extends well into the wall structure. With those cold sections in the middle of the wall structure, heat flows across the width of the insulated cavity (toward the cold stud) in addition to flowing in the main direction through the wall thickness. That heat flow across the wall (as opposed to through the wall) increases the area of influence or the effective width of the thermal bridge of the steel stud.
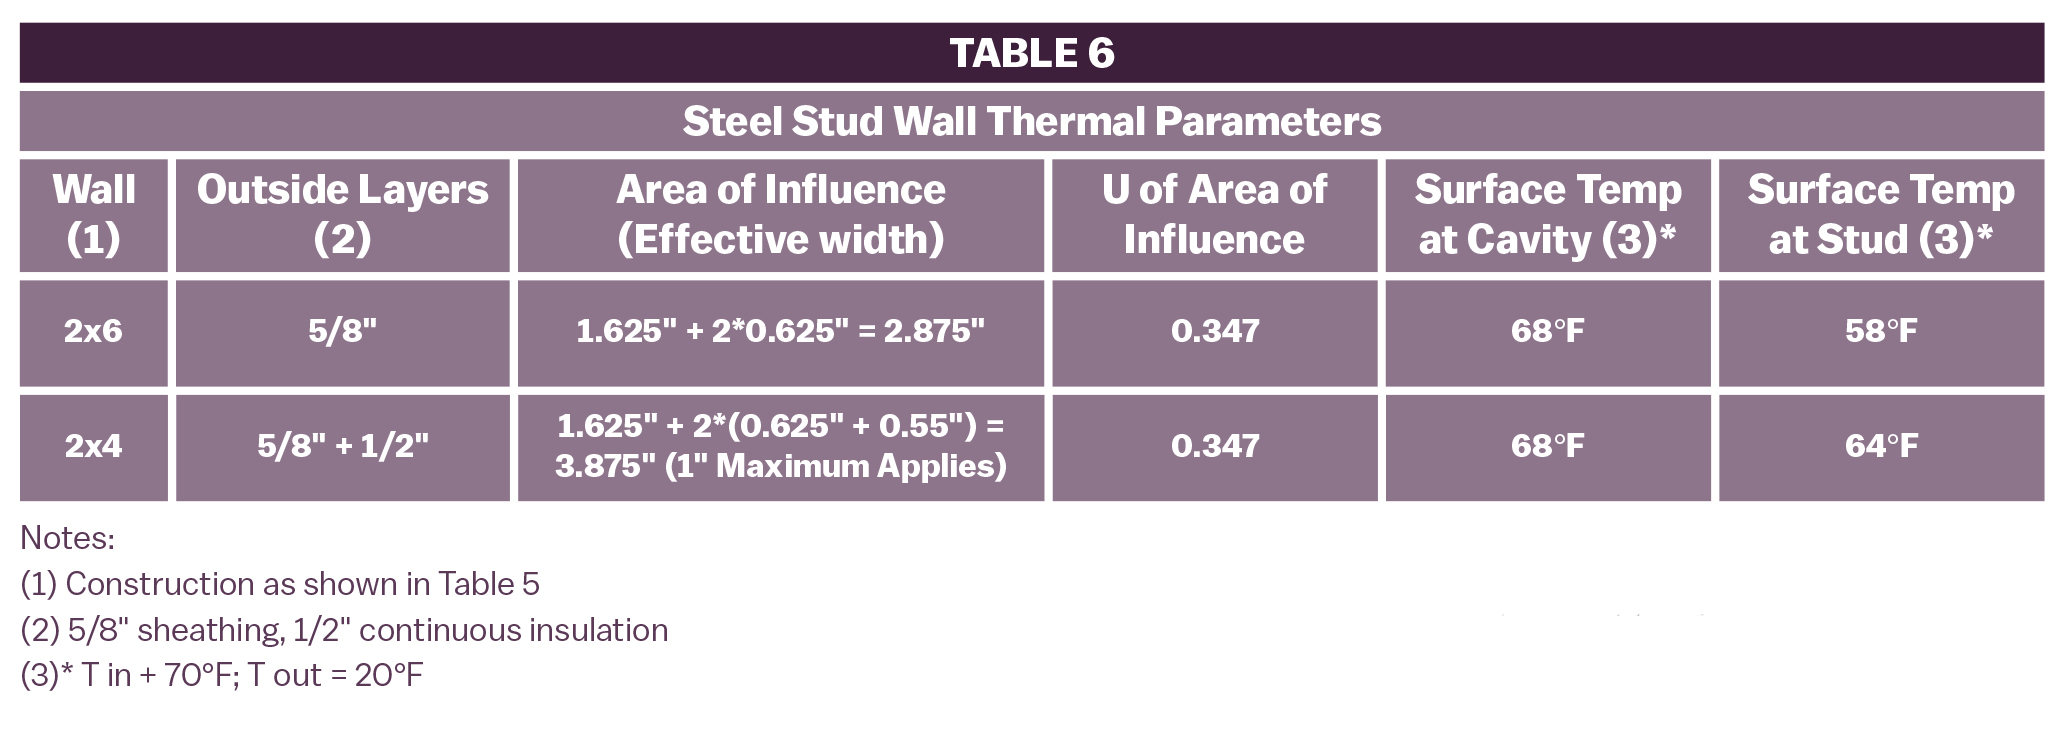
The area of influence or effective width of the steel stud can be estimated as the width of the flange (typically 1‑5/8″) plus twice the depth of sheathing and other elements attached to the outside of the stud with a maximum of 1″.3 Table 6 shows the areas of influence, U-values, and surface temperatures for the example 2×6 wall and 2×4 wall with R-3 continuous insulation.
* T in = 70°F; T out = 20°F
The U-value calculation for the area of influence uses a weighted average technique like the method used for wood framing with a small difference. For steel studs, the method treats the flanges and the web of the stud as separate calculation layers.4
The surface temperatures in Table 6 were calculated using the R-value/temperature gradient method used for the ceiling and eave space cases above. For example, the surface temperature of the 2×4 stud wall with 1/2″ foam continuous insulation is:
- Assembly U-value (weighted average for area of influence): 0.180
- Assembly R-value (1/U): 5.56
- R-value from outdoors to surface 4.88
- Temperature difference (4.88/5.56)*(70 − 20): 43.9°F
- Attic temperature (0°F outdoors + calculated difference): 63.9°F
As was the case for the ceiling cavity and eave space temperatures, total R‑value does not tell the whole story. The layer of continuous insulation in the 2×4 wall shields the highly conductive steel stud from exposure to near outdoor temperature. It reduces the consequence of the thermal bridge and raises the inside surface temperature. The building code requirement for a layer of continuous insulation outside steel stud cavity wall construction serves a useful purpose.
Take Away Message
Understanding that the temperature profile across an assembly varies in proportion to the R‑values of the individual components is a useful tool for predicting the temperature gradient in a wall. Calculating temperature profiles can inform designers on where to place insulation within an assembly. It can also predict surface temperatures and condensation risk and provide a tool to evaluate design alternatives.
Sources
- American Society of Heating, Refrigerating and Air-Conditioning Engineers. 2017 ASHRAE Handbook: Fundamentals. Inch-pound ed. Atlanta, GA.: ASHRAE, pp 27.5-27.6.
- Barbour, E., Goodrow, J., Kosny, J., and Christian, J.E., Mon. “Thermal performance of steel-framed walls. Final report.” United States. doi:10.2172/111848. https://www.osti.gov/servlets/purl/111848
- American Society of Heating, Refrigerating and Air-Conditioning Engineers. 2017 ASHRAE Handbook: Fundamentals. Inch-pound ed. Atlanta, Ga.: ASHRAE, pp 27.5-27.6.
- American Society of Heating, Refrigerating and Air-Conditioning Engineers. 2017 ASHRAE Handbook: Fundamentals. Inch-pound ed. Atlanta, Ga.: ASHRAE, example 5, pp 27.5-27.6.