Decreased Thermal Performance—An Often-Neglected Outcome of Moisture-Saturated Insulation
Thermal insulations are known as a cost-effective means of heat conservation in process equipment, pipelines, and piping circuits. Thermally insulated systems subjected to poor maintenance, as well as a lack of health checks, become receptive to moisture through direct infiltration and/or buildup via condensation, which trigger the risk of corrosion under insulation (CUI) and stress corrosion cracking (SCC). Many modern industrial facilities have established programs to inspect for and manage CUI and SCC risks. However, the ongoing thermal losses that also occur from moisture are often not accounted for or controlled.1 While thermal insulation provides an economical means of heat conservation, the presence of moisture in thermally insulated systems can lead to aggravated and irreversible thermal losses. Earlier published literature suggests that the presence of moisture in thermal insulation as low as 5% can increase thermal losses by 25%.2 In real-life applications, when an insulation system is compromised and moisture enters, even higher levels of thermal loss often result.
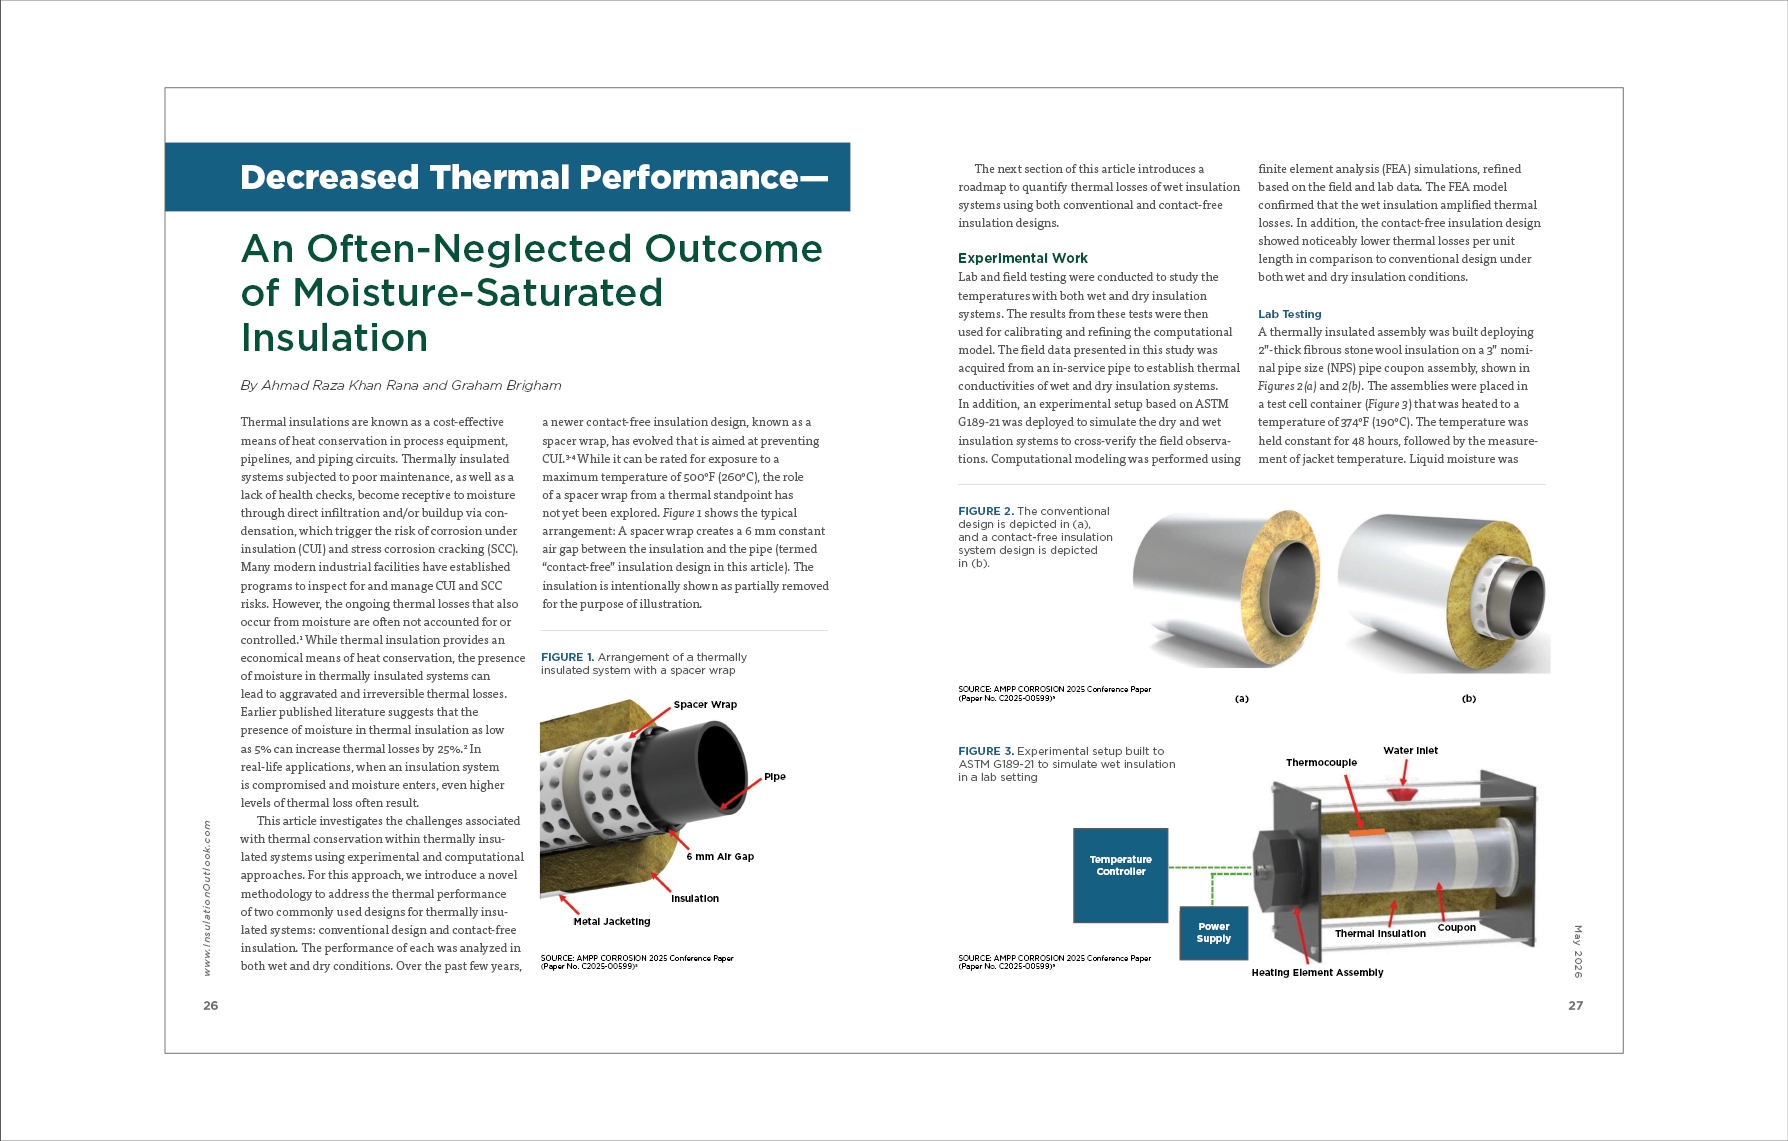
This article investigates the challenges associated with thermal conservation within thermally insulated systems using experimental and computational approaches. For this approach, we introduce a novel methodology to address the thermal performance of two commonly used designs for thermally insulated systems: conventional design and contact-free insulation. The performance of each was analyzed in both wet and dry conditions. Over the past few years, a newer contact-free insulation design, known as a spacer wrap, has evolved that is aimed at preventing CUI.3-4 While it can be rated for exposure to a maximum temperature of 500°F (260°C), the role of a spacer wrap from a thermal standpoint has not yet been explored. Figure 1 shows the typical arrangement: A spacer wrap creates a 6 mm constant air gap between the insulation and the pipe (termed “contact-free” insulation design in this article). The insulation is intentionally shown as partially removed for the purpose of illustration.
The next section of this article introduces a roadmap to quantify thermal losses of wet insulation systems using both conventional and contact-free insulation designs.
Experimental Work
Lab and field testing were conducted to study the temperatures with both wet and dry insulation systems. The results from these tests were then used for calibrating and refining the computational model. The field data presented in this study was acquired from an in-service pipe to establish thermal conductivities of wet and dry insulation systems. In addition, an experimental setup based on ASTM G189-21 was deployed to simulate the dry and wet insulation systems to cross-verify the field observations. Computational modeling was performed using finite element analysis (FEA) simulations, refined based on the field and lab data. The FEA model confirmed that the wet insulation amplified thermal losses. In addition, the contact-free insulation design showed noticeably lower thermal losses per unit length in comparison to conventional design under both wet and dry insulation conditions.
Lab Testing
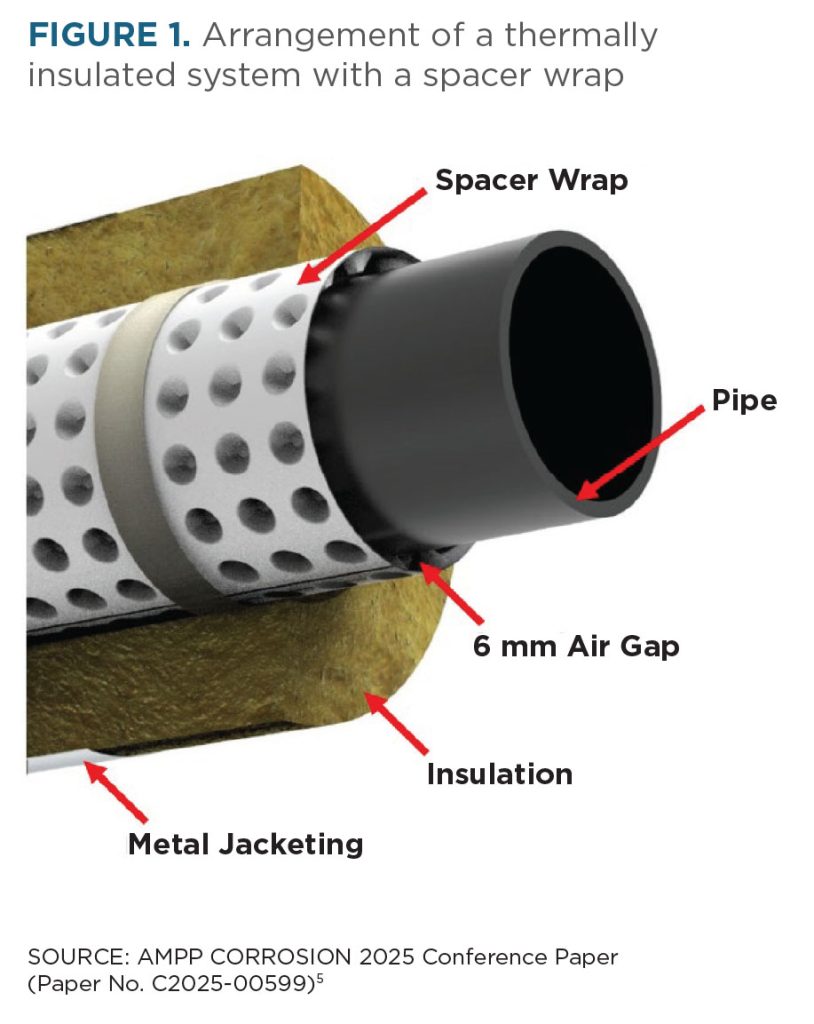
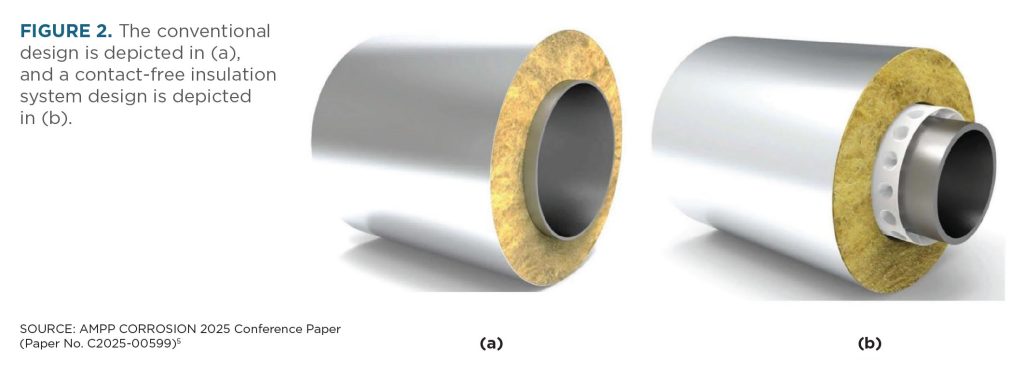
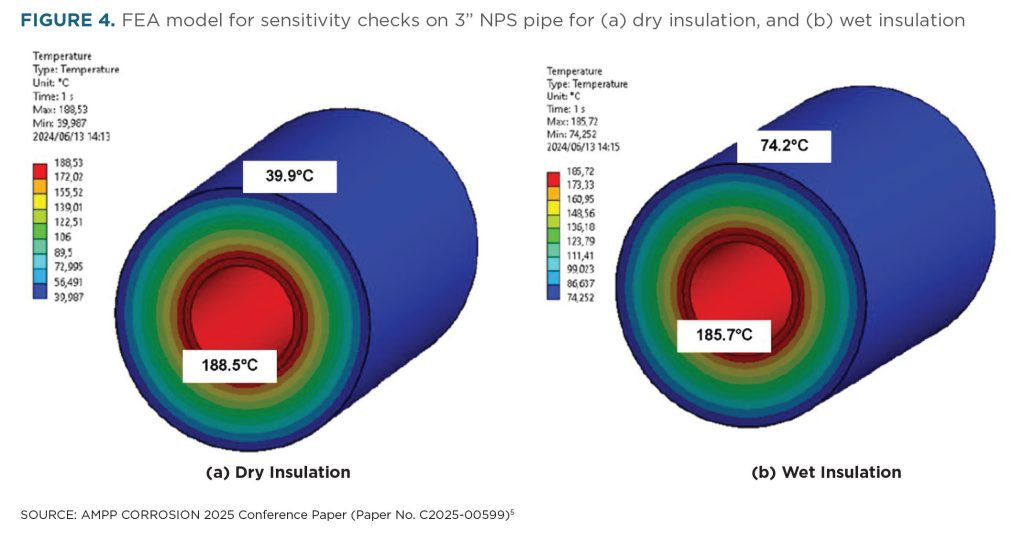
A thermally insulated assembly was built deploying 2”-thick fibrous stone wool insulation on a 3” nominal pipe size (NPS) pipe coupon assembly, shown in Figures 2(a) and 2(b). The assemblies were placed in a test cell container (Figure 3) that was heated to a temperature of 374°F (190°C). The temperature was held constant for 48 hours, followed by the measurement of jacket temperature. Liquid moisture was then introduced into the test cell (on a periodic basis) by pouring from a 12 o’clock position to fill the cells to keep the insulation moisture-saturated (to simulate a wet insulation environment). Testing was conducted for 30 days, and the jacket temperature was allowed to stabilize for 3 days at a time, followed by measurement of the jacket temperature. In total, 10 readings were taken for wet insulation.
The jacket temperatures for the dry and wet insulation configurations from the conventional design were later used to calibrate the thermal conductivity of stone wool in the FEA model (termed a “sensitivity check”). Figures 4(a) and 4(b) show the jacket temperatures for the sensitivity checks of the built FEA model.
Field Testing
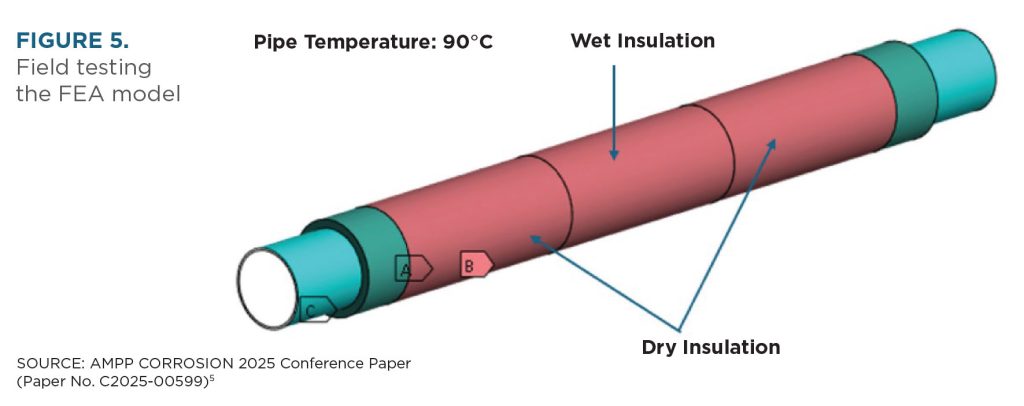
To ensure the accuracy of the FEA model, a second round of sensitivity checks was executed using the temperatures from a 16” NPS thermally insulated pipe carrying boiler feed water (temperature of 194°F / 90°C) in the field setting. The insulation section on this pipe was compartmentalized and soaked with moisture (to mimic the wet insulation), followed by measurement of the jacket temperature. Jacket temperature also was measured from sections of the pipe that were completely dry. Jacket and pipe temperatures were then fed into the FEA model to refine it further. Figure 5 shows the FEA model geometry and the boundary conditions used for sensitivity check of the model (for field testing data).
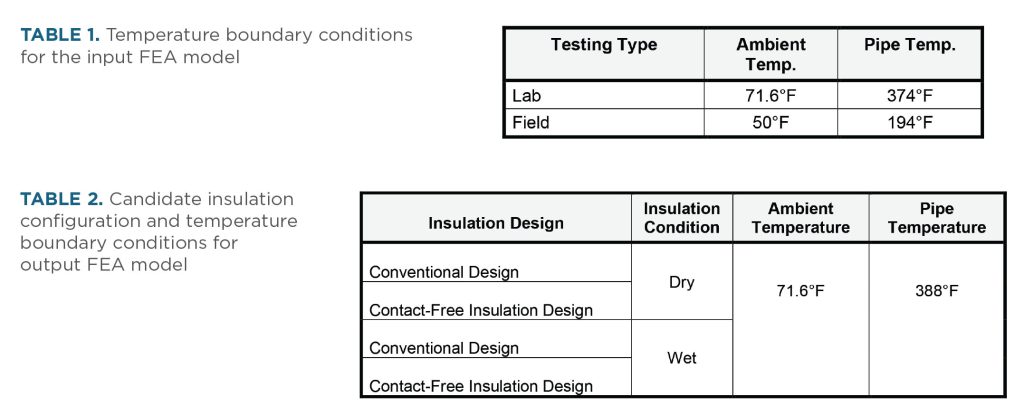
After the field and lab studies, and the sensitivity checks using FEA modeling, the established thermal conductivities of dry and wet insulations were plugged into another FEA model comprising 24” pipe and 3”-thick fibrous stone wool insulation (termed “output model”). FEA simulation was performed deploying steady-state thermal analyses using ANSYS SpaceClaim 2021R2. Table 1 shows the temperatures from the lab and field tests used for the convergence study of FEA models.
Table 2 shows the boundary conditions for the candidate insulation systems in the output models. Heat loss per unit length was calculated by the FEA model for the candidate insulation systems subjected to wet and dry insulations.
Results and Discussion
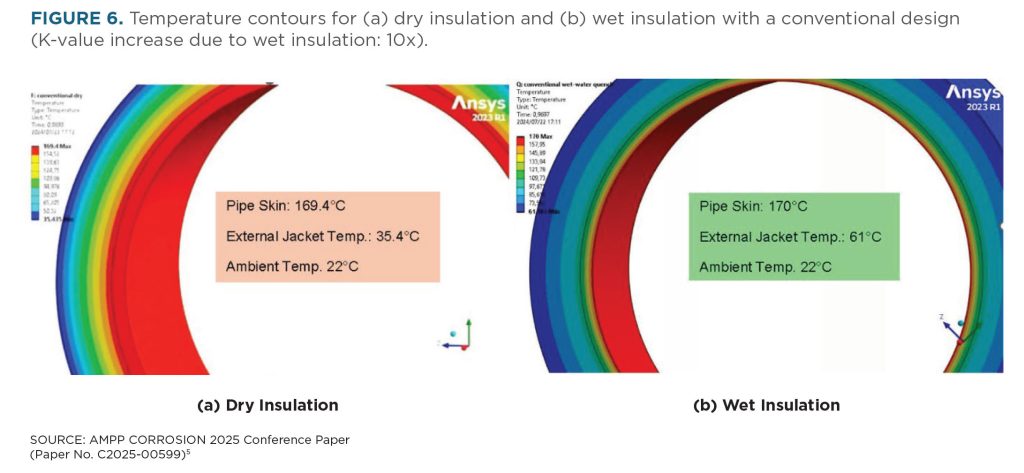
From the sensitivity checks based on field and lab results, it was found that in the conventional design, the moisture-saturated insulations had an approximately 10-fold (i.e., 1,000%) increase in thermal conductivity in comparison to the dry insulation. Figures 6(a) and 6(b) show the temperature contours and boundary conditions for the output FEA models with dry and wet insulations, respectively, for a conventional design. These models reveal the temperature gradient alongside the thickness of insulation, whereas jacket temperature for wet insulation can be seen as 142°F (61°C), which is substantially higher than dry insulation—96°F (35.4°C). From the output FEA model, the computed overall heat loss per unit length was found to be threefold higher for the wet insulation in comparison to the dry, which can be attributed to the increased thermal conductance.
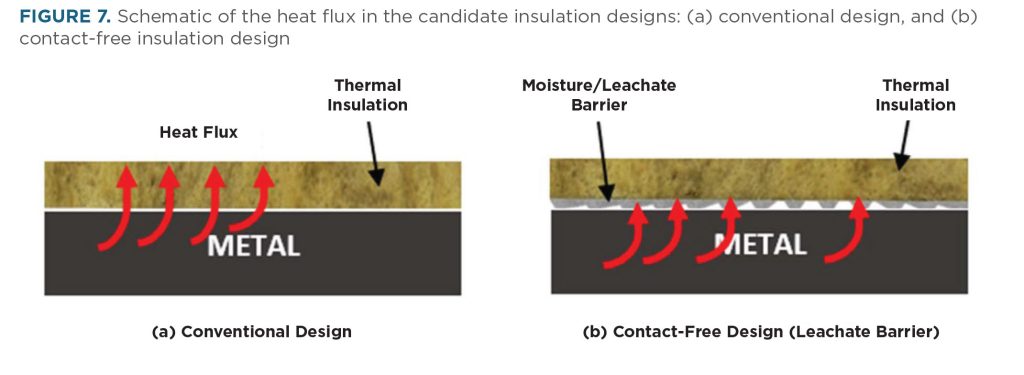
The contact-free design also revealed noticeable decrease in thermal loss versus the conventional design, for both wet and dry insulation configurations. This can be attributed to the standoff and impermeable separation between insulation and the pipe provided by the contact-free insulation system studied. Figure 7 shows a schematic of heat flux for the candidate insulation designs. The standoff provides an air gap, reducing thermal conductance. Hence, the effect of moisture saturation on thermal losses from thermally insulated systems is also influenced by the insulation systems’ design.
Closing Thoughts
Thermally insulated systems subjected to wet conditions are destined to experience aggravated and irreversible thermal losses in addition to CUI. While proper material selection, design, installation, and maintenance are critical to prevent moisture ingress, the infiltration of moisture can be triggered from insulation damage or inadequate design and installation. Although thermal insulation is an economical means of heat conservation, its ability to achieve thermal performance is affected by moisture infiltration. A comprehensive approach deploying experimental testing, field validation, and computational modeling (via FEA) helped quantify thermal losses for the wet insulation and contact-free insulation designs. While the wet insulations amplify thermal conductance and losses, the contact-free design showed some noticeable reduction in thermal losses in comparison to conventional contacting design. Further research is needed in this area, studying different insulation systems and application temperatures.
REFERENCES
- AER Directive 077, https://static.aer.ca/prd/documents/directives/Directive077.pdf.
- Bundesfachabteilung, Technical Letter, 3rd Edition (May 2016), p. 3.
- Ahmad Raza Khan Rana, Graham Brigham, “Insulation-Metal Interaction Outlook for Thermally Insulated Systems –A New Perspective for Insulation Driven Stress Cracks and CUI,” CORROSION 2025 Nashville, TN, Paper No. 00600, Houston, TX: AMPP, 2025.
- Ahmad Raza Khan Rana, Graham Brigham, Kyle J. Williams, “Case Studies – Learnings from CUI Failures and Inspection Challenges,” CORROSION 2024 New Orleans, LA, Paper No. 21070, Houston, TX: AMPP, 2024.
- Ahmad Raza Khan Rana, Graham Brigham, “Performance Outlook of Thermally Insulated Systems Using Experimental Data and Computational Analysis,” CORROSION 2025 Nashville, TN, Paper No. 00599, Houston, TX: AMPP, 2025.