Multiple Choice, Part Two: How to Choose Economic Thickness of Insulation
The November 2007 Insulation Outlook article “Multiple Choice, Part One” discussed the paradox of the past several years of energy prices more than doubling while thermal insulation thicknesses for hot piping and equipment have not increased. Most insulation thickness tables for hot service industrial piping and equipment were written before 2000, and most of these tables have not been upgraded to reflect the higher energy prices.
In the November article, the question of how insulation thicknesses should be selected was addressed. This follow-up article will look at the related question, “How should economic thicknesses (the thicknesses that balance energy savings with first cost plus maintenance cost of the installed insulation system) of insulation be selected?”
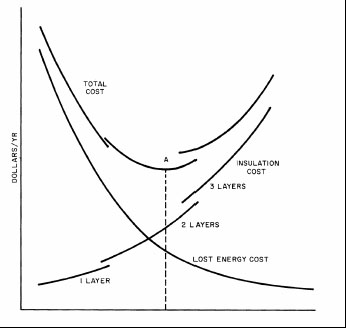
A government paper titled “Economic Thickness of Industrial Insulation”1 explains the concepts of economic thickness quite well with the qualitative graph shown in Figure 1.
The generic graph in Figure 1 shows lost energy cost, insulation cost, and total cost used to determine economic thickness for an insulated pipe.
The following three sets of curves are represented in Figure 1:
- A curve that shows the decreasing lost energy cost for increasing insulation thicknesses
- A curve showing the increasing installed cost for increasing insulation thicknesses (with jumps where the number of layers is increased from one to two, then from two to three layers)
- A Total Cost curve that shows the sum of the previous two curves (the lowest point of this curve corresponds to the economic thickness)
There are many economic considerations for determining economic thickness. Rather than exploring all of them, for the purposes of this article, all variables will be held constant and only the cost of energy will vary. To determine a price for the delivered energy, as well as average ambient conditions, an 8-inch iron pipe size (IPS) insulated pipe operating at 600°F with an average annual ambient temperature of 60°F, average wind speed of 5 miles per hour (mph), and oxidized aluminum jacketing with an emissivity of 0.1 will be used. The heat source considered will be natural gas selling over a wide range of different delivered prices from $2.50 per mcf to $20 per mcf. (At press time, the delivered price to an industrial user was in the $9- to $10-per-mcf range).
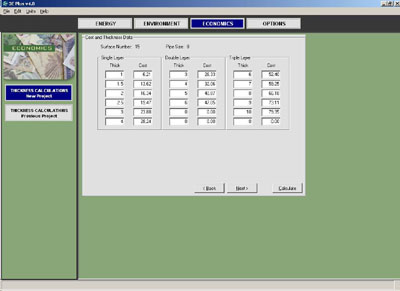
To determine an economic thickness using 3E Plus®, users should select the Economics tab, give the problem an identification, and proceed. Many default conditions—such as a natural gas heating value of 1,026 British thermal units (Btus) per cubic foot, a combustion efficiency of 75 percent, and an annual fuel inflation rate of 3 percent—can be applied. A 60°F Average Annual Ambient Temperature and a 5-mph Average Annual Wind Speed should be entered. A Reference Thickness for Payback Calculations of 0 inches also should be entered for this problem. Users should select the same mineral wool pipe insulation that was used in the previous problems, and select External Jacketing Material of Aluminum, Oxidized in Service. The Installation Complexity entered should be Average, which is the default value.
The Material Price should be entered in dollars per lineal foot (LF) for 2- x 2-inch pipe insulation. 3E Plus has a default value of $4.97 per LF, including jacketing. As for the (fully burdened) Labor Rate, one can assume the default value of $38.25 per hour and place the job in Texas, where so much industrial insulation work in the United States is done. Selecting the detailed engineering report provides valuable information.
Figure 2 gives the computed installed cost of this pipe insulation at different thicknesses. Figure 2 shows that the 2-inch-thick insulation has an installed cost of $16.34 per LF and the 21/2-inch-thick insulation has an installed cost of $19.47 per LF. For thicknesses greater than 4 inches, the generated table jumps to a double-layer system. Therefore, the installed costs also jump to $40.87 per LF and $47.05 per LF to get a 5- or 6-inch thickness, respectively. Users can select 3- and 4-inch thicknesses in double layer as well, but these are somewhat more expensive than the same thicknesses in single layer. This is due to the greater number of labor hours required to install double-layer insulation.
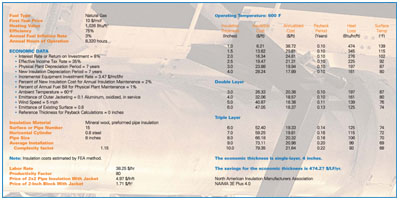
By clicking Calculate, a detailed engineering report (see Figure 3) is produced. The table shown is for midrange, $10-per-mcf natural gas.
The result of this problem for economic thickness, using $10-per-mcf natural gas, is 4 inches. This is the insulation thickness with the lowest annualized cost (shown in the third column of numbers).
The PIP Economic Thickness chart for mineral wool insulation on a 600°F, 8-inch IPS pipe gives an economic thickness of 2.5 inches, significantly less than the 4 inches found using natural gas priced at $10 per mcf. While this 2.5 inches is only one point on one insulation economic thickness table, the comparison is representative of the existing insulation thickness tables and those economic thicknesses generated using current natural gas prices.
The jump in first cost from 4 inches ($28.24 per LF) to 5 inches ($40.87 per LF) is due to the need to go from single layer to double layer. This factor has a significant impact on limiting the economic thickness to 4 inches (as opposed to 5 inches). Also, the savings for economic thickness is $474.27 per LF per year—impressive for an insulation system that originally cost $32.06 per LF installed with metal jacketing. The payback given is 0.1 year, the minimum value given by 3E Plus. By dividing $32.06 per LF by $474.27 per LF per year, one gets an amazingly short payback of 0.068 years, which is well under 0.1 year and the equivalent of only 25 days. These numbers demonstrate convincingly that thermal insulation is extremely cost-effective in saving energy.
If this pipe were insulated with 6 inches of mineral wool instead of 4 inches, the payback would still be less than 0.1 year, but the annualized cost would be higher.
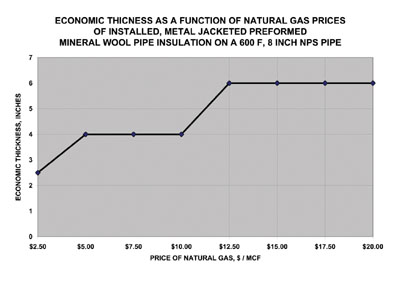
It is also interesting to run the same problem using natural gas prices at different points between $2.50 per mcf and $20 per mcf. Figure 4 shows the results of those 3E Plus calculations for economic thickness.
The chart shows that 2.5 inches is the economic thickness with natural gas priced at $2.50 per mcf, which corresponds to the PIP Economic Thickness for the same conditions. The April 1999 revision to the PIP Economic Thickness reflects a natural gas price of about $2.50 at that time. However, with the delivered price of natural gas currently in the $9- to $10-per-mcf range, the economic thickness tables need to be updated.
If the delivered price of natural gas were to double from $10 to $20 per mcf, the economic thickness would increase from 4 to 6 inches. Any newly generated insulation thickness tables would need to account for some expected natural gas price inflation.
Industrial facility owners should regenerate their insulation thickness tables for projects where energy savings is important. If the cost of energy—particularly today’s much higher natural gas and heating oil prices—has an impact on facility operating costs, then insulation thicknesses should be determined economically. The resulting thicknesses likely will be greater than those determined when energy was much cheaper.
The Bottom Line on Determining Economic Insulation Thicknesses
For new construction, or for a total insulation retrofit of existing piping and equipment, specifiers and facility owners should discard old insulation thickness tables and generate new ones using current energy costs. Use of the old insulation thickness tables results in unnecessary waste of money for heating energy. The use of new insulation thickness tables, generated using economic thicknesses and resulting in greater insulation thicknesses, will result in greater energy efficiency and can be extremely cost-effective.
1 Conservation Paper Number 46, Office of Industrial Programs, Federal Energy Administration, August 1976


