acoustical lagging systems — new information on noise reduction
Textbooks, instructional courses, and manufacturer’s literature correctly tell us that increasing the insulation lagging mass reduces noise radiating from pipes. What these sources do not tell us is that increasing insulation thickness also has noise reduction benefits and that different pipe sizes may have different optimum lagging acoustical treatment. Also absent is an approach that takes acoustical performance into account as well as installed cost considerations.
Until now, available data regarding pipe insertion loss has been very limited. A literature search discovered that about 15 test points have been published over the years. Much of the data is very old; approximately half were developed on products that are no longer manufactured. These data references were also gathered on relatively small pipe sizes.
As with other environmental issues, noise abatement is an increasing concern to our society. Reducing noise is important to the hearing health of personnel working in industrial facilities, and for reduced annoyance to nearby communities. According to an article published in Hydrocarbon Processing (August 1992), it is stated that piping is the primary radiator of sound in most industrial plants.
With the increasing awareness regarding industrial noise, it is clear more data is needed. A research program has begun to take a more fundamental look at reducing noise radiated from pipes. This article is a first step to freshen the available data for pipe insertion loss in both breadth and scope.
What is Pipe Insertion Loss?
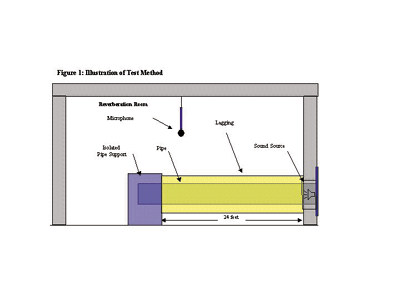
In the simplest terms, pipe insertion loss is the measurement of the sound pressure radiated from a noisy pipe before insulation and lagging are applied (bare), compared to the sound-power measured after insulation and lagging are applied. Measurements are made in decibel units (dB). Measured at different frequencies, the noise level from the lagged pipe is subtracted from the bare pipe to measure the extent of the improvement. The larger the insertion loss number, the larger is the amount of noise abated. The American Society for Testing and Materials (ASTM) provides a laboratory test. The Test method is designated ASTM E 1222, Standard Test Method for Measuring the Insertion Loss of Pipe Lagging Systems. This Method, illustrated in Figure 1, can be more technically summarized as follows:
Noise is produced inside a steel pipe located within a reverberation room using band-limited white noise as a test signal. The noise must be produced by a loudspeaker or acoustic driver located at one end of the pipe. Average sound pressure levels are measured within the reverberation room for two conditions, one with the sound radiating from a bare pipe, and the other with the same pipe covered with a lagging system. The insertion loss of the lagging system is the difference in the sound pressure levels measured with sound radiating from the bare and lagged pipe, with an adjustment for changes in room absorption due to the presence of the lagging system. The results may be obtained in a series of 100 Hz wide bands or in one-third octave bands from 500 to 5000 Hz. The ASTM E 1222 Test Method may be used to rank order pipe lagging systems according to insertion loss, and to estimate the field insertion loss of lagging systems installed in the field.
Testing Procedure Overview
This testing program is ongoing as this article is being written. So far, over one hundred tests have been completed. When compared to available published data, these one hundred points seem infinite, but pale in comparison to the infinite possible combinations of pipe size, lagging weight and insulation thicknesses to consider. The approach used in testing thus far has focused on 6- and 12-inch nominal pipe sizes (NPS), and 2- to 4-inch insulation thicknesses. Lagging weight ranged from standard All Service Jacket (ASJ), to plain .016 and .020 aluminum lagging, up to a 2 pound per square foot mass filled vinyl (MFV)/.020 embossed aluminum composite, having a total weight of (2.28 lb./SF).
Intertek Testing Services of Cortland, New York
Engineering-Science, Inc. of Pasadena, California
For a given thickness of insulation, the same insulation was used repeatedly for each lagging test. This was done for reasons of convenience and for consistency. It was felt the influence of changing lagging could be more clearly ascertained if the insulation was not disturbed. With possible variations in installation eliminated, this made the assessment of specific jacket weight influences more certain. The insulation used in tests was nominal 4 lb. per cubic ft. density, one-piece fiberglass. The illustration in Figure 2 shows the typical installation methodology used for all tests.
Discussion of Findings
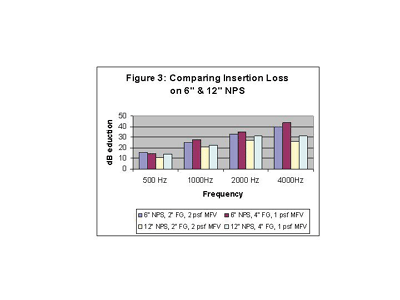
Early on in our testing we discovered that the performance of laggings on 6-inch NPS differed substantially from the performance on 12-inch NPS pipe. If one is to go to the previously published data generated on a 3- or 6-inch NPS, then apply that treatment to a 12-inch NPS, the installed results in the field might vary significantly from expectations. The graph in Figure 3 shows the performance difference of the same laggings used on 6- and 12-inch pipe sizes. To achieve the equivalent acoustical performance of a lagging on a 12-inch pipe, to that achieved on a 6-inch pipe, alternative approaches were needed. For this reason we began to look at increasing insulation thickness beyond the 2-inch typically used with mass filled laggings, to see if increasing insulation thickness to 4 inches had a beneficial effect. Some improvement was observed, but more importantly, we learned that perhaps increasing thickness and reducing lagging weight might offer advantages that go beyond improving sound power reduction.
Practical Considerations
Based on the difficulty encountered when installing the heaviest weight laggings, we rationalized that reduced lagging weight and increased insulation thickness may have significant economic impact for the user.
While the user will be happy because significant installed cost savings could be realized, the lagging system installers will be happy also because as lagging mass increases, the difficulties encountered during installation also increase. Installing a 2-psf mass filled vinyl/0.020 aluminum composite lagging can be likened to wrestling with an alligator. The lagging weight of this product for a 12-inch NPS with 2 inches of insulation is about 40 pounds, while the weight for a 24-inch NPS is about 70 pounds. In addition to the weight, it is noticeably inflexible during installation. This weight of product seems to have a mind of its own. Installing 2 psf MFV is hard work and our observations found that particular attention to detail is needed during installation. Otherwise, gross errors can occur in the form of gaps at joints and laps that could void the benefit of using the heavy lagging in the first place. When even large pipes are considered, the selection of using very heavy mass filled lagging seems impractical. Using a lower weight lagging is much more user friendly. As jacket weight is decreased, flexibility improves, which aids the quality and speed of installation.
It is recognized that reducing lagging mass and increasing insulation thickness may not be practical from an installation standpoint if there are space constraints around the pipe requiring treatment. Parallel pipes in close proximity would warrant that greater lagging mass might be required, and insulation thickness needs to be minimized. However, if there is room for more insulation, then likely there is money that can be saved.
The user of these data is cautioned that it is very important to identify sound sources well in the industrial setting. It is quite possible to treat a noisy pipe very effectively and have no significant influence on ambient sound measurement after the acoustical treatment. This is because of the logarithmic nature of sound power measurement.
Consider the following chart:
Consider the following example:
Consider another example:
The important thing to observe in these two examples is that all sources of noise above desired levels need acoustical treatment and that it is important to treat the largest source of noise or no improvement will be observed.
Lagging Economics – Construction of an Installed Economic Index
To investigate the economics of different lagging systems, an installed cost index was devised to compare acoustical treatments. This index is believed to be factual and is based on computer programs, published economic construction data, field survey and personal communication. The following specific information is the basis of the index construction:
1. The North American Insulation Manufacturers Association (NAIMA) 3E Plus® version 3.0 was used to gather installed costs for the nominal pipe size and insulation thicknesses discussed. The program works off an input cost of installing 2-inches of insulation on a 2-inch nominal pipe size (NPS), with .016 aluminum jacket. The program scales up this cost for different pipe sizes through an algorithm. An input value of $5.00 per lineal foot was used. Based on our field survey, this is a reasonable value to use. For this article, only values for single layer installation were used to calculate the index.
2. The installed cost for .016 aluminum jacket alone was extracted from the Means Construction Cost Data, 57th Edition.
3. It is generally known that installing a 1 psf mass filled vinyl lagging costs three times the labor of installing .016 aluminum jacket. This relationship, coupled with the Means value for .016 aluminum allowed calculation of labor cost for other lagging weights through linear regression.
4. A lagging manufacturer provided specific lagging material costs.
5. All indices shown are expressed as a premium over the installed cost of .016 aluminum lagging, with fiberglass insulation. Hence, if a specific lagging system has an index of 3.0, this means that the installed cost is 3 times the cost of installing 2 inches of insulation, having .016 aluminum lagging on the same size pipe.
Acoustical Performance and Installed Cost Comparisons of Lagging Systems
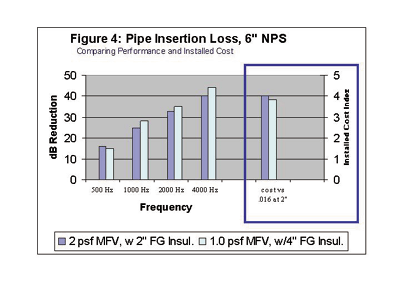
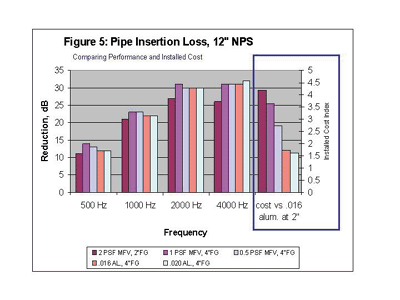
Refer to Table 1 and Figures 4 and 5 for tabular and graphical summaries.
On 6-inch NPS (See Figure 4.)
- Performance
The performance of 4 inches of fiberglass insulation with 1 psf MFV was better than 2 inches of fiberglass insulation with 2 psf MFV throughout most of the frequency ranges required by the test. The slight exception was a 1-dB deficiency at 500 Hz.
- Economics
The installed cost index shows only a small savings (4 percent) by using more insulation and less lagging weight.
On 12-inch NPS (See Figure 5.)
- Performance
1 psf MFV with 4-inches of fiberglass insulation was the best performer, with 0.5 psf MFV, and 0.020 and 0.016 aluminum showing similar performance with 4 inches of fiberglass. All 4-inch thick fiberglass combinations clearly outperformed the heavier 2 psf MFV with just 2 inches of fiberglass insulation.
- Economics
The installed cost index shows dramatic differences in costs for these scenarios. Using 4 inches of insulation with 1 psf MFV shows a significant potential installed savings of 15 percent when compared to 2 psf MFV and 2 inches of insulation. Using 0.5 psf MFV and 4 inches of insulation shows 54 percent savings, while .016 or .020 lagging offer savings near an incredible 150 percent. If the situation permits installing additional insulation, then the extent of potential savings can not be ignored.
Conclusions:
1. Different pipe sizes are likely to have different optimal acoustical solutions.
2. A 6-inch nominal pipe size is more effectively treated than a 12-inch nominal pipe size. From observing Figure 3, it is concluded that jacketing and insulation have a greater impact on stopping noise on smaller pipes than larger pipes. Data and subsequent modeling of data suggest that jacket mass or insulation thickness must increase as pipe size increases.
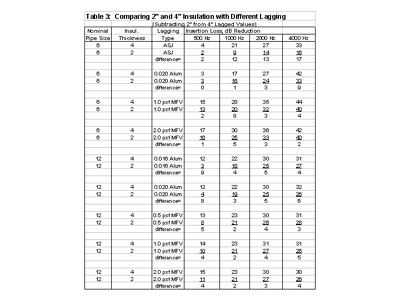
3. As shown in Table 3, increasing insulation thickness to 4 inches improves the insertion loss performance when compared to 2 inches, having the same lagging.
4. From Table 2, it is apparent that increasing jacket weight has an improving influence on insertion loss.
5. Table 1 clearly demonstrates that increasing insulation thickness and decreasing lagging weight has not just performance benefits, but also potentially large economic implications. The data gathered thus far indicate that even larger pipe sizes should be researched (24-inch tests are underway).
This research has led us to believe that isolating sound energy on pipes is analogous to insulating pipe to reduce heat loss. There will likely be an ideal solution, having a balance of performance and installed cost for a given range of pipe sizes. Our objective is to find these solutions through additional testing and perhaps mathematical modeling to provide the engineering and user community a more defined prescription for pipe noise control.
Photos courtesy of Knauf Fiber Glass.

