Annual Energy Outlook 2011
The projections in the Energy Information Administration’s (EIA’s) Annual Energy Outlook 2011 (AEO2011) focus on factors that shape the U.S. energy system over the long term. Under the assumption that current laws and regulations remain unchanged throughout the projections, the AEO2011 Reference case provides the basis for examination and discussion of energy production, consumption, technology, and market trends and the direction they may take. It also serves as a starting point for analysis of potential changes in energy policies. AEO2011 also includes 57 sensitivity cases, which explore important areas of uncertainty for markets, technologies, and policies in the U.S. energy economy.
Key results highlighted in AEO2011 include strong growth in shale gas production, growing use of natural gas and renewables in electric power generation, declining reliance on imported liquid fuels, and projected slow growth in energy-related carbon dioxide (CO2) emissions even in the absence of new policies designed to mitigate greenhouse gas (GHG) emissions.
AEO2011 also includes in-depth discussions on topics of special interest that may affect the energy outlook. They include: impacts of the continuing renewal and updating of federal and state laws and regulations; discussion of world oil supply and price trends shaped by changes in demand from countries outside the Organization for Economic Cooperation and Development or in supply available from the Organization of the Petroleum Exporting Countries; an examination of the potential impacts of proposed revisions to Corporate Average Fuel Economy standards for light-duty vehicles and proposed new standards for heavy-duty vehicles; the impact of a series of updates to appliance standards alone or in combination with revised building codes; the potential impact on natural gas and crude oil production of an expanded offshore resource base; prospects for shale gas; the impact of cost uncertainty on construction of new electric power plants; the economics of carbon capture and storage; and the possible impact of regulations on the electric power sector under consideration by the U.S. Environmental Protection Agency (EPA). Some of the highlights from those discussions are mentioned in this article. Readers interested in more detailed analyses should refer to the full report at www.eia.gov/forecasts/aeo/.
Imports Meet a Major but Declining Share of Total U.S. Energy Demand
Real gross domestic product grows by 2.7 percent per year from 2009 to 2035 in the AEO2011 Reference case, and oil prices grow to about $125 per barrel (2009 dollars) in 2035. In this environment, net imports of energy meet a major, but declining, share of total U.S. energy demand in the Reference case. The need for energy imports is offset by the increased use of biofuels (much of which are produced domestically), demand reductions resulting from the adoption of new vehicle fuel economy standards, and rising energy prices. Rising fuel prices also spur domestic energy production across all fuels—particularly, natural gas from plentiful shale gas resources—and temper the growth of energy imports. The net import share of total U.S. energy consumption in 2035 is 17 percent, compared with 24 percent in 2009. (The share was 29 percent in 2007, but it dropped considerably during the 2008–2009 recession.)
Much of the projected decline in the net import share of energy supply is accounted for by liquids. Although U.S. consumption of liquid fuels continues to grow through 2035 in the Reference case, reliance on petroleum imports as a share of total liquids consumption decreases. Total U.S. consumption of liquid fuels, including both fossil fuels and biofuels, rises from about 18.8 million barrels per day in 2009 to 21.9 million barrels per day in 2035 in the Reference case. The import share, which reached 60 percent in 2005 and 2006 before falling to 51 percent in 2009, falls to 42 percent in 2035 (Figure 1).
Domestic Shale Gas Resources Support Increased Natural Gas Production with Moderate Prices
Shale gas production in the United States grew at an average annual rate of 17 percent between 2000 and 2006. Early success in shale gas production was achieved primarily in the Barnett Shale in Texas. By 2006, the success in the Barnett shale, coupled with high natural gas prices and technological improvements, turned the industry focus to other shale plays. The combination of horizontal drilling and hydraulic fracturing technologies has made it possible to produce shale gas economically, leading to an average annual growth rate of 48 percent over the 2006–2010 period.
Shale gas production continues to increase strongly through 2035 in the AEO2011 Reference case, growing almost fourfold from 2009 to 2035. While total domestic natural gas production grows from 21.0 trillion cubic feet in 2009 to 26.3 trillion cubic feet in 2035, shale gas production grows to 12.2 trillion cubic feet in 2035, when it makes up 47 percent of total U.S. production—up considerably from the 16-percent share in 2009 (Figure 2).
The estimate for technically recoverable unproved shale gas resources in the Reference case is 827 trillion cubic feet. Although more information has become available as a result of increased drilling activity in developing shale gas plays, estimates of technically recoverable resources and well productivity remain highly uncertain. Estimates of technically recoverable shale gas are certain to change over time as new information is gained through drilling, production, and technological and managerial development. Over the past decade, as more shale formations have gone into commercial production, the estimate of technically and economically recoverable shale gas resources has skyrocketed. However, the increases in recoverable shale gas resources embody many assumptions that might prove to be incorrect over the long term.
Alternative cases in AEO2011 examine the potential impacts of variation in the estimated ultimate recovery per shale gas well and the assumed recoverability factor used to estimate how much of the play acreage contains recoverable shale gas. In those cases, overall domestic natural gas production varies from 22.4 trillion cubic feet to 30.1 trillion cubic feet in 2035, compared with 26.3 trillion cubic feet in the Reference case. The Henry Hub spot price for natural gas in 2035 (in 2009 dollars) ranges from $5.35 per thousand cubic feet to $9.26 per thousand cubic feet in the alternative cases, compared with $7.07 per thousand cubic feet in the Reference case.
Coal Continues to Account for the Largest Share of Electricity Generation
Assuming no additional constraints on CO2 emissions, coal remains the largest source of electricity generation in the AEO2011 Reference case because of continued reliance on existing coal-fired plants. EIA projects few new central-station coal-fired power plants, however, beyond those already under construction or supported by clean coal incentives. Generation from coal increases by 25 percent from 2009 to 2035, largely as a result of increased use of existing capacity; however, its share of the total generation mix falls from 45 percent to 43 percent as a result of more rapid increases in generation from natural gas and renewables over the same period. The role of natural gas grows due to low natural gas prices and relatively low capital construction costs that make it more attractive than coal. The share of generation from natural gas increases from 23 percent in 2009 to 25 percent in 2035.
Electricity generation from renewable sources grows by 72 percent in the Reference case, raising its share of total generation from 11 percent in 2009 to 14 percent in 2035. Most of the growth in renewable electricity generation consists of generation from wind and biomass facilities (Figure 3). The growth in generation from wind plants is driven primarily by state renewable portfolio standard (RPS) requirements and federal tax credits. Generation from biomass comes from both dedicated biomass plants and co-firing in coal plants. Its growth is driven by state RPS programs, the availability of low-cost feedstocks, and the federal renewable fuels standard, which results in significant cogeneration of electricity at plants producing biofuels.
Proposed Environmental Regulations Could Alter the Power Generation Fuel Mix
The EPA is expected to enact several key regulations in the coming decade that will have an impact on the U.S. power sector, particularly the fleet of coal-fired power plants. Because the rules have not yet been finalized, their impacts cannot be fully analyzed, and they are not included in the Reference case. However, AEO2011 includes alternative cases that examine the sensitivity of power generation markets to various assumed requirements for environmental retrofits.
The range of coal plant retirements varies considerably across the cases (Figure 4), with a low of 9 gigawatts (3 percent of the coal fleet) in the Reference case and a high of 73 gigawatts (over 20 percent of the coal fleet). The higher end of this range is driven by the somewhat extreme assumptions that all plants must have scrubbers to remove sulfur dioxide and selective catalytic reduction to remove nitrogen oxides, that natural gas wellhead prices remain at or below about $5 through 2035, and that environmental retrofit decisions are based on an assumption that retrofits occur only if plant owners can recover their costs within 5 years. The latter quick cost recovery assumption is meant to represent the possibility of future environmental regulation, including for GHGs.
In all these cases, coal continues to account for the largest share of electricity generation through 2035. Many of the coal plants projected to be retired in these cases had relatively low utilization factors and high heat rates historically, and their contribution to overall coal-fired generation was relatively modest.
Electricity generation from natural gas is higher in 2035 in all the environmental regulation sensitivity cases than in the Reference case. The faster growth in electricity generation with natural gas is supported by low natural gas prices and relatively low capital costs for new natural gas plants, which improve the relative economics of gas when regulatory pressure is placed on the existing coal fleet. In the alternative cases, natural gas generation in 2035 varies from 1,323 billion kilowatthours to 1,797 billion kilowatthours, compared with 1,288 billion kilowatthours in the Reference case.
CO2 Emissions Grow Slowly and Do Not Return to 2005 Levels until 2027
After falling by 3 percent in 2008 and 7 percent in 2009, largely as a result of the economic downturn, energy-related CO2 emissions grow slowly in the AEO2011 Reference case due to modest economic growth, growing use of renewable technologies and fuels, efficiency improvements, slower growth in electricity demand (in part because of the recent recession), and more use of natural gas. In the Reference case, which assumes no explicit regulations to limit GHG emissions beyond vehicle GHG standards, energy-related CO2 emissions do not return to 2005 levels (5,996 million metric tons) until 2027, growing by an average of 0.6 percent per year from 2009 to 2027, or a total of 10.6 percent. CO2 emissions then rise by an additional 5 percent from 2027 to 2035, to 6,311 million metric tons (Figure 5).
To put the numbers in perspective, population growth is projected to average 0.9 percent per year, overall economic growth 2.7 percent per year, and growth in energy use 0.7 percent per year over the same period. Although total energy-related CO2 emissions increase from 5,996 million metric tons in 2005 to 6,311 million metric tons in 2035 in the Reference case, emissions per capita fall by 0.7 percent per year over the same period. Most of the growth in CO2 emissions in the AEO2011 Reference case is accounted for by the electric power and transportation sectors.
The projections for CO2 emissions are sensitive to many factors, including economic growth, policies aimed at stimulating renewable fuel use or low-carbon power sources, and any policies that may be enacted to reduce GHG emissions. In the AEO2011 Low and High Economic Growth cases, projections for total primary energy consumption in 2035 are 106.4 quadrillion Btu (6.9 percent below the Reference case) and 122.6 quadrillion Btu (7.4 percent above the Reference case), and projections for energy-related CO2 emissions in 2035 are 5,864 million metric tons (7.1 percent below the Reference case) and 6,795 million metric tons (7.7 percent above the Reference case), respectively.
For the full report, visit www.eia.gov/forecasts/aeo/.
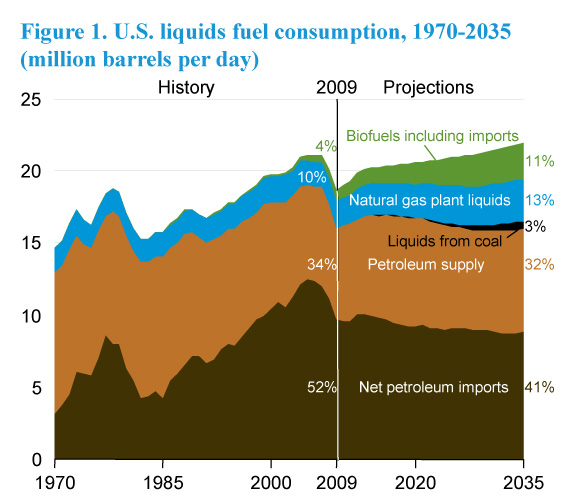 Figure 1
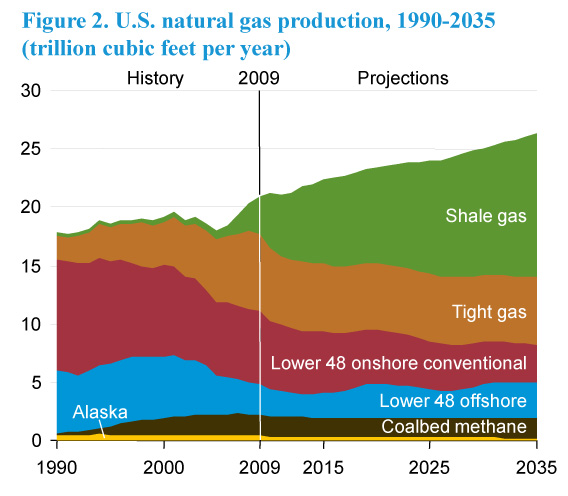 Figure 2
 Figure 3
 Figure 4
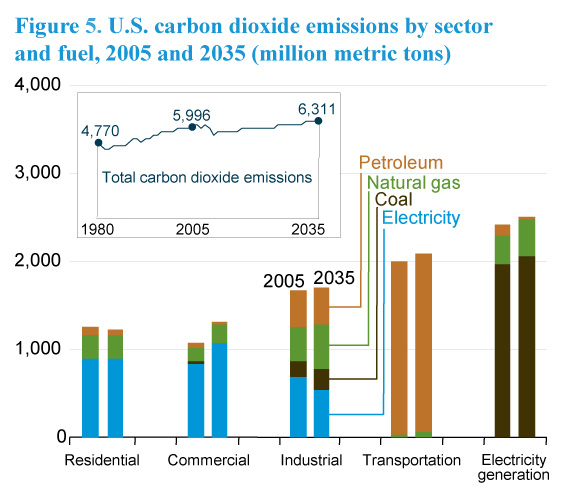 Figure 5