Below Ambient Piping Insulation Systems
The value of insulation systems on piping and equipment has been demonstrated by many successful installations in commercial and industrial facilities. For systems operating at temperatures below ambient, the adverse impact of moisture migration into the insulation system during operation has caused many premature failures. The objective of this study is to compare the performance of commonly used cold piping insulation systems by measuring their moisture absorption rates while exposed to a severe combination of ambient temperature and relative humidity. Based upon these observations, several recommendations are made for further study of these systems.
Introduction and Objective
Background
Most industrial and commercial buildings contain process piping and equipment systems that require the installation of an insulating system to isolate those systems from the environment. A majority of those systems operate at temperatures that are greater than that of their surroundings. Equipment and piping systems of this type require insulation systems that reduce heat loss, increase system durability and provide personnel protection and freeze prevention, along with ease of installation, maintenance and repair. However, a significant number of systems are operating at temperatures below the ambient temperature. These include: air conditioning ducts, refrigeration and freezer rooms, gas liquefaction, chilled water piping and refrigeration equipment.
Design goals for these systems include:
1. energy efficiency
2. personnel protection
3. reduced surface condensation
4 extended service life
5. ease of installation, maintenance and repair
Some of these systems (for example, air distribution ducts), operate a portion of the year below the ambient, but may also operate a portion of the year at temperatures above the ambient. These systems have a chance to drive off any moisture that has accumulated during the cold cycle operation. Many cold systems, especially distribution lines carrying chilled brine or water, operate at below ambient conditions for months, if not years, without exceeding the ambient temperature. For these systems, the vapor flow is unidirectional, and these are the systems that need special design consideration.
The successful insulation system must deal with the unidirectional vapor drive by either:
a. providing a continuous and effective vapor retarder to limit the quantity of water vapor flowing to the surface, or
b. providing a means to remove the condensed water.
Traditionally, most designs have utilized a low permeance vapor retarder and/or a low permeance insulation material in conjunction with appropriate sealants and tapes to minimize the water vapor flow.
Objective and Approach
The overall work objective was to develop relative performance data on alternative insulation systems operating at below ambient temperatures. The approach involved fabricating samples of a number of insulation systems and exposing these samples to controlled conditions for an extended period of time. The samples were periodically weighed to quantify the amount of water gained.
Several sub-objectives were accomplished in the course of this work. Primarily, these involved developing and using a standardized protocol for measuring the below ambient performance under accelerated environmental conditions. Some of these steps included:
1. developing a "standard" test section that was representative of piping insulation systems in general, yet simple enough to be easily handled and reproduced
2. selecting the realistic environmental exposure conditions that would accelerate the "aging" of the test systems without causing problems with the measurements
3. selecting a piping system operating temperature that would provide a sufficient water vapor driving force while minimizing operational problems
4. developing a measurement procedure that allows discrimination between the various systems tested
5. testing the systems under the conditions previously addressed
6. reporting the results in a form that is easily understood and explained to others
Experimental Program
The sample insulation material systems selected for these experiments come from several sources. First, the five insulation materials discussed in the American Society of Heating, Refrigeration and Air-Conditioning Engineers (ASHRAE) Refrigeration, Chapter 32 were included. Also, the typical open cell insulation system used for cold water piping protection was used. Also included were two examples of open celled insulation systems specifically recommended, by their manufacturers, for high humidity applications. Each system was assembled using accessories recommended by the manufacturer of the particular insulation material and supplied by their local fabricator.
Sample Selection
The candidate insulation systems were selected to represent a cross section of insulation systems used throughout the industry.
Samples included:
1. fibrous glass with ASJ vapor retarder and PVC jacket
2. mineral wool with ASJ vapor retarder and PVC jacket
3. flexible elastomeric
4. phenolic foam with MPET vapor retarder
5. polyisocyanurate with ASJ vapor retarder
6. extruded polystyrene foam with ASJ vapor retarder
7. cellular glass with ASJ vapor retarder
8. fibrous glass with ASJ vapor retarder
Details on sample assembly are given in Table 1. Note that for each sample, two identical specimens were constructed and tested. This was intended to allow a rough estimate of the variability of the measured results.
Selection of Environmental Test Conditions
As stated previously, the conditions for the test must be "realistic" yet provide for an accelerated exposure for the tested systems. The chilled water side of the experiment was easy to establish. We needed a temperature that was representative of normal chilled water systems, warm enough to prevent freezing of the condensation, and yet provide the greatest vapor pressure gradient to the system. For this purpose, the fluid temperature circulated to the cold piping was selected to be that required to maintain the insulated pipe surface at 35°F (1.7°C). During the experiment, the thermocouples located at the pipe surface were monitored to insure that the proper temperature was maintained.
For the test chamber environment, the exterior exposure condition was specified to be a constant 90°F (32.2°C) and 90 percent relative humidity. This condition was selected to be a "worst case" condition in order to maximize the vapor drive to the cold surface. A review of the ASHRAE climatic design information confirmed that the test condition dew point 87°F ( 31°C) was greater than the 0.4 percent design dew point for all locations listed on earth. The worst city listed is Caracas, Venezuela, where the design dew point is 86°F (30°C). The highest United States location is Panama City, Fla., with a design dew point of 81°F (27°C). This isn’t to say that conditions may never exist that are more severe, only that if they do, the time of exposure is limited. No attempt has been made to correlate this exposure to real, in service conditions other than to say that this exposure should be more severe than seen in most applications, including the U.S. Gulf Coast exposure.
Test Module Design and Assembly
Each insulation specimen is constructed in a reproducible facility called a test module. The module is assembled on a section of 1-inch nominal copper tubing. This size copper tubing was chosen for several reasons. First, it represents a size used extensively for below ambient systems. Second, it provides a sample small enough to handle easily, yet is large enough to absorb sufficient moisture from the environment to be measurable. Third, the copper piping provides excellent thermal conductance to the cooling source. Details for the specimen assembly are presented in Figure 1.
Once the insulation material has been conditioned in the laboratory, the assembly of the test specimen begins. The insulation is assembled, following the manufacturer’s instructions, with a single butt joint in the system at the center of the 36-inch (0.91 m) specimen and at least one lateral joint passing for the entire length. For insulation systems having multiple layers, the joints are staggered but at least one butt joint is required for each layer. A menu of the details for the test module construction is contained in Table 1. Note that for one of these systems, the manufacturer recommends the application of joint sealant directly to the internal surface of the pipe insulation prior to its application. This effectively glues the insulation directly to the pipe surface. For those systems requiring sealant at the joints, the sealant was also applied at the end cap locations. For all systems, a second end cap was installed at the opposite end of the tube and glued in place so the total insulated system measures 36 inches (0.91 m) long. Finally, when the vapor retarder is in place, its ends are sealed to the end caps using silicone caulk. This completes the assembly of a test module. After conditioning for several days in the laboratory to ensure cure of the mastics and caulk, the modules are weighed and ready for installation on the test rack.
Exposure Facility – Test Module Support
The exposure facility is intended to support the test modules in such a fashion that they’re all exposed to the same environmental conditions. The test module supports must be cooled to a temperature that permits the test module’s inside tube to be cooled to the operating temperature. The rack must have uniform flow through each support so uniform temperatures can be maintained.
Our test module support consists of 16 parallel tubes mounted on a steel support rack measuring approximately 6 feet (1.83 m) high and 40 inches (1.02 m) wide. The tubes (Figure 2) are spaced in a stacked pattern so that the insulated modules are spaced approximately 11 inches (0.28 m) apart. This permits adequate airflow between and around the test modules. A manifold connects the cold water supply to the tube banks on the support structure. The assembly is fabricated so that the water enters the center tube, passes to the other end and then returns to the outlet installed near the original entry. With this configuration, the end of the tube support is cooled to the operating temperature, and the overall end-to-end temperature difference is very small. The external diameter of the support provides a tight fit to the test module tube, but permits easy removal of the test modules for weighing.
Cooling Facility-Cold Water Supply
The supply of cooling fluid, a mix of 50 percent glycol-based antifreeze and 50 percent water, is pumped through the pipe modules by a refrigerated recirculator. For this test, the unit provides waters at 35 °F, +/- 0.2 °F (2 °C +/- 0.1 °C) at a flow rate of approximately 10 gpm (38 l/m) at 40 psi (273 kP). This flow rate and the 15 gallon (57 liter) reservoir in the unit provide excellent temperature stability during the testing.
Exposure Facility-Environmental Chamber
A large controlled room with temperature and humidity was used to provide the conditioning environment for these tests. This room provides a clear 12′ x 12′ x 11′ (3.7 by 3.7 by 3.4 m) interior chamber dimension for testing. For this experiment, the desired conditioning setpoints were 90 °F (32.2 °C) and 90 percent humidity. Repeated monitoring during the project showed that the temperatures, measured in the proximity of the test frame, were within +/- 1 °F (0.5 °C). Relative humidity variation was demonstrated to be about +/- 4 percent.
Insulation Thickness Determination
The selection of the test thickness for each insulated system was based upon a calculation of the expected operating surface temperature. The design criterion was to avoid condensation on the outer surface of the insulation systems. For this calculation, we used a computer program that conforms to the American Society for Testing and Materials (ASTM) Practice C 680 and determines the surface temperature of a piping system as a function of its operating conditions, the insulation thermal properties and the significant dimensions.
To compensate for variations in facility control, the design conditions used for specifying the insulation thickness were 91 ºF (32.8 °C) and 92 percent relative humidity environment and 34 ºF (1.1 °C) cold pipe operating temperature. The local air velocity chosen for the calculation was 0 miles per hour. Thermal conductivity values used for the thickness design were those found in existing ASTM Product Specifications, where available.
All specimens were to start with a dry surface condition. If changes to the conductivity of the system after installation caused condensation to form at the surface, then that was to be part of the conditioning process. Allowance for available sizes and thicknesses were made such that the nominal product thickness, accounting for ASTM Specification dimensional tolerance, was equal to or greater than the minimum calculated thickness. The final insulation test module thicknesses used are tabulated in Table 1.
Measurement Protocol
The experimental program objective was to measure the absorption of moisture into the operating insulation system as a function of time. Based on some initial testing done on similar systems, the frequency of the measurements was fixed at seven-day intervals. Since the weight change for most samples was small, this frequency was adequate to record the changes. The established weighing procedure was followed for each specimen, and each specimen was removed from the rack to be weighed and, at the same time, visually observed. After measurement and examination, the specimen was returned to the conditioning rack and the next specimen was examined. The total time to remove, measure and return each specimen averaged about five minutes.
Adjustment of Exposure Positioning
One concern with the rack setup for the specimens was the variation of exposure caused by the close proximity of the adjacent specimens. To overcome this concern, each specimen was moved to a new position after weighing. All the specimens were moved after weighting in a similar pattern. With this rotation, all specimens were cycled through all the positions during the 90-day testing period. Thus, all specimens were exposed to the same conditions.
Expected Results
Simplified Model
Whenever an experimental program is undertaken, there’s the need to look at the experiment to see if the results make technical sense. Since our test module is a straight piece of pipe, the moisture model can be a simple first order, one-dimensional model. Our model was used in an attempt to understand the important parameters influencing the level of moisture accumulation. The physical model for moisture is similar to that used to describe the heat transfer through the system. The differences are that, for the moisture calculation, the driving force is the vapor pressure gradient across the system, and the resistance to moisture flow is the permeance of the system.
The model is dependent upon each layer’s thickness, moisture permeance and water vapor pressure drop. By multiplying the model result by the length of our test module and the time of exposure, an anticipated total moisture accumulation over time can be estimated. It’s important to note here that the model only assumes continuous layers of different materials. The predicted performance neglects any joint failure, cracks, sealers or other accessory factors found in a real system.
Moisture Model Results
The estimated test module moisture accumulation over a 90-day period at our test conditions is presented in Figure 3. These calculations were performed using a combination of available vapor permeance properties for the insulation and jacketing materials as provided by ASHRAE, Turner and Malloy and actual test data for the jacket materials. The wet cup values were used for the ASJ jacketing materials since the vapor retarders will see a relative humidity close to the ambient conditions (90 percent relative humidity). Dry cup values were used for all insulation materials. The permeability properties values used are tabulated in Table 3.
A review of Table 4, column 2, shows that the estimated moisture accumulation for the systems during the 90-day test period ranges from virtually zero (for the cellular glass system) to nearly 102 grams (for the fibrous glass/ ASJ system).
Experimental Results
Testing was completed over a three-month period between May 2000 and August 2000. Figure 4 presents a plot of the average moisture accumulation versus time. For this figure, the average moisture accumulation of the two identical specimens is plotted.
Note that all of the specimens showed a measurable weight gain. Measured values for the individual specimens ranged from a low of 20 grams (for a fibrous glass/ASJ/PVC specimen) to 405 grams (for a fibrous glass/ASJ specimen). Further review of the results, Table 3, shows that:
1. The cellular glass system showed the best performance of the closed cell systems (average weight gain of 35 grams).
2. The polystyrene insulation system showed the worst performance of the closed cell systems (average weight gain of 288 grams).
3. The mineral fiber systems having an ASJ vapor retarder facing plus PVC jacket demonstrated essentially equal performance, as defined by average weight gain, to the cellular glass specimens.
It’s important to note that in all cases the observed moisture accumulation was significantly larger than that predicted by the simple model (see Table 4). This isn’t surprising since the simplified model doesn’t account for known leakage paths such as longitudinal joints, butt joints, and lap seals in the vapor retarders. There’s also a significant difference in moisture gain between specimens of the same material system. This shows the difficulty in fabricating repeatable specimens. It should be noted that all specimens were prepared using laboratory assembly techniques that followed the manufacturer’s recommended instructions. From the standpoint of workmanship, we believe that the assembly techniques used were probably better than typical installations found in the field.
Visual Examination
In addition to the weights taken during the exposure period, the samples were dissected at the end of 90 days in an attempt to understand what changes had occurred in the systems that might explain the weight gain results. A series of photographs were also taken during the program setup and dissecting of the specimens. A tabulation of the significant observations follows.
1. All systems showed signs of water penetration throughout the insulation system, with moisture accumulation at the surface of the pipe.
2. Several of the closed cell systems showed signs of water penetration into the cell structure at the pipe surface. The water penetration was observed as a discoloration of the foam material inside the cross section of the foam and/or as a significant reduction in compressive resistance at that location.
3. Significant mold was found on the insulation vapor retarder facing for several of the specimens. The largest mold concentrations were present for the phenolic, polyisocyanurate and polystyrene specimens and to a lesser extent on the cellular glass specimen. The formation of the mold occurred at the joints of the insulation and along the bottom edge of the specimen. The formation appears to be a result of condensation at the joints, possibly due to difference in thermal properties at these locations between the base insulation and the joint treatment.
4 The ASJ vapor retarder facing material did not demonstrate good durability at the test conditions. This deterioration was shown by failure of the paper outer surface and by a loss of the aluminum retarder material during exposure to the high temperature and humidity. The MPET vapor retarder facing used for one closed cell system also showed signs of some loss of aluminum retarder material after exposure. The deterioration of the vapor retarder material may have contributed to the growth of the mold on the surface since the mold and jacket deterioration were at the same locations.
Conclusions
The research program described in this paper examines the accumulation of moisture within a typical insulated piping system operating at below ambient conditions for a 90-day period.
1. All the systems exposed in this experiment gained some moisture, which, if it continued over time, might cause an insulation system failure.
2. Weight gains for individual specimens over the thirteen-week monitoring period ranged from 20 grams to 405 grams.
3. The weight gains didn’t correlate with the water vapor permeability of the base insulation material. The worst performing system overall had good base insulation vapor resistance.
4. Several specimens of the vapor retarder facing materials used in this study showed signs of deterioration (pinholes) due to the continuous exposure to high-humidity conditions.
5. Finally, the results of this experiment show that low moisture flow insulation systems can be designed using any insulation material. This design would require that a continuous and effective vapor retarder system be part of the insulation system design and that the performance of the system would be maintained for the life of the insulation.
Recommendations
It has become obvious from the previously described experiments that many questions remain. The following is a brief list of several areas that must be researched before these results can be applied in general.
1. The precision and repeatability of this protocol must be defined by additional testing on specimens similar to those used in this report.
2. The experimental work should be repeated on other systems used for below ambient conditions in hot humid environments.
3. This study should be extended to other temperature, humidity and exposure time conditions to prove the applicability of the results.
4. Additional testing must be conducted on insulations, jacketing, vapor retarders and sealants to determine their vapor permeability and durability over a wide range of temperature and humidity conditions.
5. Studies should be undertaken to research other, non-standard, solutions to this problem.
Table 3
|
Model Material |
||||
|
Material |
Installed Thickness (inches) |
Permeability Dry Cup (perm inch) |
Permeability Wet Cup (perm inch) |
Installed Permeance (perms) |
|
Polystyrene Foam1 |
1.50 |
1.2 |
|
0.80 |
|
|
|
|
|
|
|
Phenolic Foam 2 |
1.50 |
26 |
|
17.3 |
|
|
|
|
|
|
|
Unicellular Rubber 1 |
2.00 |
0.1 |
|
0.05 |
|
|
|
|
|
|
|
Polyurethane Foam 1 |
1.50 |
4.5 |
|
3.00 |
|
|
|
|
|
|
|
Mineral Fiber 2 |
2.00 |
116 |
|
58.0 |
|
|
|
|
|
|
|
Cellular Glass 1 |
2.50 |
0.002 |
|
0.0008 |
|
|
|
|
|
|
|
ASJ Facing 3,4 |
0.008 |
N/A |
N/A |
0.09/0.57 |
|
|
|
|
|
|
|
Plastic PVC Sheet 3,4 |
0.020 |
0.00044 |
|
0.02 |
Table 4
|
Predicted vs. Measured |
|||
|
Sample |
Predicted Weight Gain (grams) |
Measured Weight Gain (grams) |
Specimen to Specimen Variation (percent) |
|
Fibrous Glass/ASJ/PVC |
4 |
60 |
133 |
|
|
|
|
|
|
Mineral Wool/ASJ/PVC |
4 |
37 |
40 |
|
|
|
|
|
|
Elastomeric |
5 |
87 |
17 |
|
|
|
|
|
|
Phenolic/MPET |
79 |
60 |
50 |
|
|
|
|
|
|
Polyisocyanurate/ASJ |
60 |
150 |
27 |
|
|
|
|
|
|
Polystyrene/ASJ |
41 |
288 |
50 |
|
|
|
|
|
|
Cellular Glass/ASJ |
0 |
35 |
29 |
|
|
|
|
|
|
Fibrous Glass/ASJ |
102 |
273 |
97 |
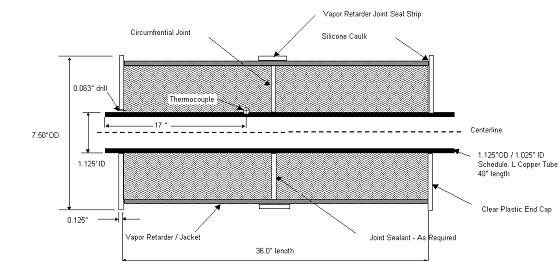 Figure 1
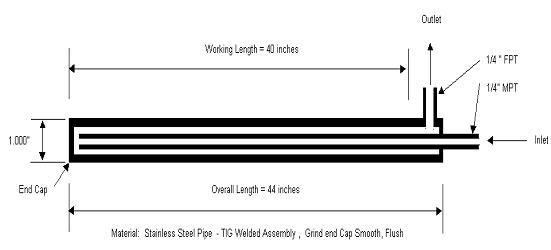 Figure 2
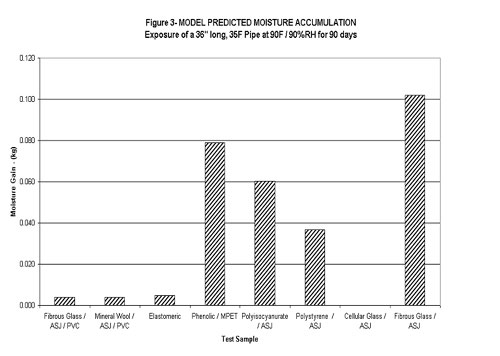 Figure 3
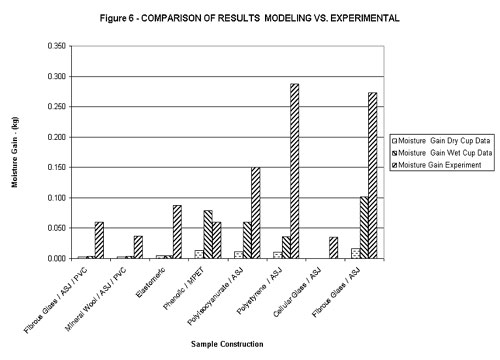 Figure 4
 Figure 5
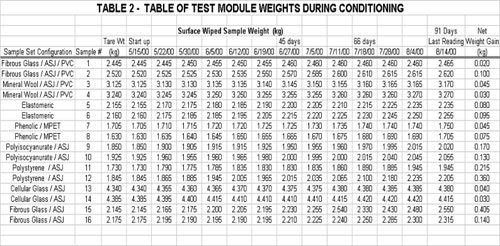 Figure 6