Case Study: Insulation Audit Leads to Big Savings
Background
Honeywell’s Geismar site was established in 1967 and is currently operated by roughly 275 employees and 130 contractors. The site is responsible for producing multiple refrigerants, hydrofluoric acid, and a
resin that is used in medical packaging. The various reactors, heat exchangers, steam traps, and process piping that make our processes a reality all utilize insulation to maintain temperatures and moderate
processes. All of our processes are susceptible to inefficiencies because systems that include insulation can degrade in a chemical plant environment. When insulation degrades, it loses its ability to retain
heat within the system. Though the site is in Louisiana, winters can still be cold, and steam and other process lines have even been known to freeze in the past. Improved repair and maintenance of insulation
systems could have helped prevent these process upsets.
Even during the warmer months, it is critically important to regulate the temperature of process fluids. If process fluids get too hot, or if they are not kept warm enough, process kinetics and thermodynamics
can be affected. Though the heat source (reboiler, heat exchanger, etc.) does the actual heating and a majority of the temperature regulation, insulation is a major player in regulating the temperature, as it
prevents external conditions from seriously affecting the process. Reducing energy waste while maximizing production is a top priority for Honeywell, so the site managers are continuously looking for ways to
improve the site’s energy standing. In order to assess the current standing of our site’s insulation and look for ways to increase efficiency, a site-wide audit was performed.
Insulation Audit
Our last insulation audit was performed in December of 2013. Insulation audits can prove tremendously beneficial to facility owners by identifying areas where energy is being wasted. Carefully auditing a
system, and then addressing any insufficiencies, can provide significant financial and energy savings.
An audit typically involves the following:
- Specialized engineers come to the site for a period lasting several days to several weeks, depending on the size of the site and extent of insulation use.
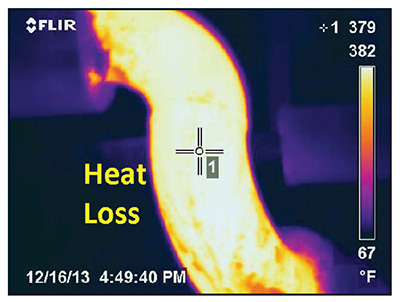
- Systems are inspected and areas of heat loss are identified using an infrared (IR) camera, which displays temperatures of objects in the image using various shades of color (see Figure 2 on page 6). Hot
areas show up as red, and cooler areas appear as blue. - Other field data such as ambient conditions, relative insulation thickness, and piping material properties are also recorded.
- The engineers check for completeness of insulation systems, and any instances of missing or damaged insulation are recorded.
- A data analysis program calculates temperature profiles from the IR camera images and incorporates these temperatures—as well as the other data obtained—into a complex algorithm.
- Reportable values for both energy loss and potential dollar savings are then produced. These results provide helpful information such as what areas of the plant have the most insulation issues, what heat
sources/equipment types tend to have faster degrading insulation, and what utilities are most affected.
For the Geismar site, the energy losses reported were either from electricity (used in electric process heaters) or steam (reboilers/heat exchangers), which are produced on site using natural gas boilers. Our
December 2013 audit predicted a site-wide annual savings opportunity of 16.4 billion Btu, resulting from 99 total instances of either damaged or incomplete insulation. Most of the problem areas were piping,
though some valves and vessels were pointed out as well. In total, 2,100 equivalent feet of piping insulation was recommended for replacement. The site maintenance manager commented, “Unless you are specifically
looking for insulation deficiencies, theses cost savings are easily missed.”
Audit Results
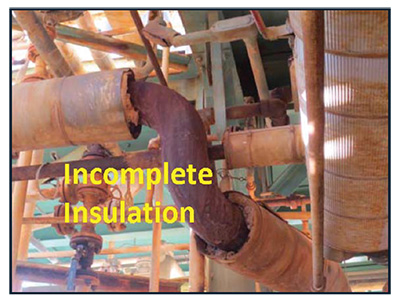
The audit produced some interesting findings. One of our primary electric heaters was not fully insulated (some of the piping up/downstream of the heater was bare). The cost to replace the insulation was only
$1,400, and it alone resulted in an estimated energy loss of approximately $16,000 per year. This small investment paid for itself almost 12 times over in 1 year. On the opposite end of the spectrum, damaged
insulation near 1 of our distillation columns was only resulting in a $700/year energy loss, but it would require nearly $9,000 to repair. The estimated payback period on this investment, however, would be fewer
than 13 years. The gaps between energy loss and estimated repair cost for the other 97 instances were not quite as extreme.

FIGURE 1: Visual Light Image

FIGURE 2: Infrared Camera Heat Loss Image
Overall, it was estimated that a capital investment of $85,000 would lead to an annual savings of just over $100,000 per year (about 0.6% of the 2014 annual operating plan for energy). With this somewhat high
capital investment, at first glance, the numbers may not seem economically favorable; but closer inspection reveals that the payback on the return on investment would be less than 1 year, with each following
year improving the bottom line.
Insulation Repair Benefits
Knowing that we were potentially losing over $100,000 worth of energy at current rates per year, and that this number would continue to rise if left unabated, we decided to formulate an appropriate
maintenance response plan. This began with performing a basic economic analysis. Using the energy losses for each insulation instance, in addition to the estimated replacement cost, we created a prioritized list
of repairs, beginning with the instances that had the shortest predicted payback periods. It was decided to pursue the individual repairs with a payback period of 3 years or fewer. We made a simple plot of
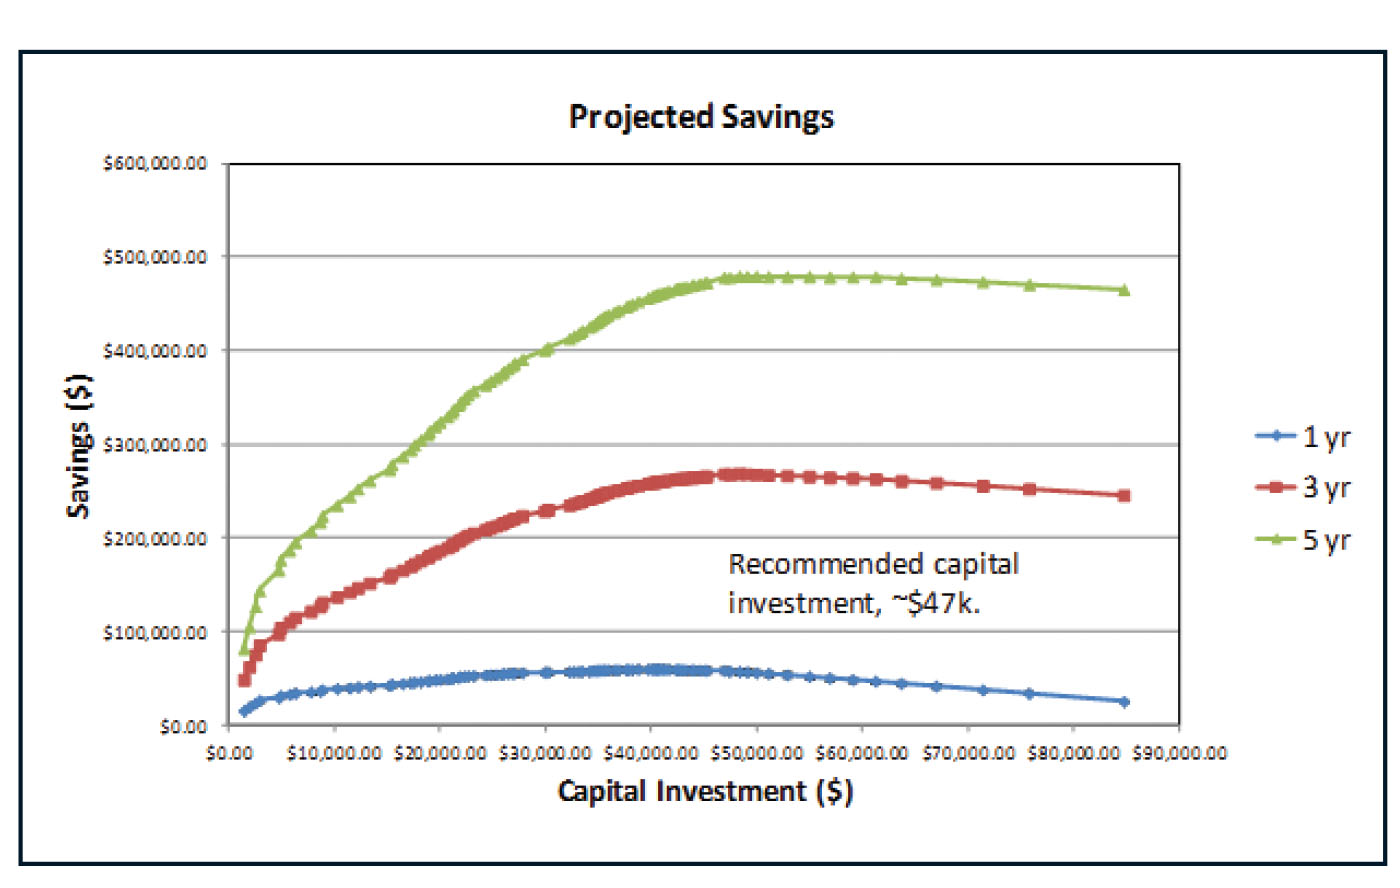
predicted savings versus initial capital investment and found that a $47,000 capital investment (which would include all replacement insulation/labor) would lead to a savings of more than $400,000 over 5 years,
taking into account the expense of the initial investment. In Figure 3 above, the vertical axis represents total project savings, and the horizontal axis represents total capital investment. Project savings
(true savings, with a “negative” investment value) are shown on a 1-, 3-, and 5-year basis. Most process insulation is rather resilient, so we can expect to continue these savings for quite some time. Increased
cost of natural gas in the future will also further our savings, as the majority of our current energy loss is from our natural gas boiler steam system.

FIGURE 3: Projected Savings Plot with Recommended Capital Investment
In addition to saving money while increasing our energy conservation, better insulation will also lead to improved process control through efficiencies and temperature stability, which will also, hopefully,
extend the life of the equipment.
Honeywell sites that have energy budgets over $1 million must undergo an annual energy compliance audit, and there is a section dedicated solely to insulation, demonstrating the company’s concern for proper
upkeep of insulation in its various facilities. The site maintenance manager commented, “Going forward, we will educate our staff to see missing insulation as lost dollars, and work to appropriately prioritize
and execute the needed repairs.” The Geismar site also plans to schedule a learning session hosted by our insulation vendor close to the time that the repairs are made. Our vendor will conduct training on
identifying faulty insulation, insulation repair/replacement, general upkeep, and more. This will be important for our maintenance employees who have not had insulation-specific training.
