Economic Justification for Replacing Ice-laden Refrigerant Pipe Thermal Insulation
This is the conclusion of a 2-part case study detailing the replacement of thermal insulation on refrigerant pipe. The first part of the case study in the June 2015 issue described the issue with the system and subsequent replacement. This concluding article investigates whether the replacement of the insulation provided a net gain for the facility in question.
Background
Following a damaging hail storm in 2011, the owner of a food-processing facility discovered his original ammonia refrigeration pipe insulation system’s protective jacketing had become heavily damaged. Upon further inspection conducted soon after the hail storm, the owner discovered that the pipe insulation material had become ice laden and wet over the course of its 15-year life. This original insulation was covered with an All Service Jacket (ASJ) vapor retarder and aluminum jacketing on the straight pipe sections, and a 20-mil thick vapor retarder mastic and polyvinyl chloride (PVC) jacketing was used on the fittings. As a consequence of his inspection, the facility owner made the decision to replace all the roof-top ammonia pipe insulation as his schedule and budget would allow. Replacement has been conducted during winter months with the ammonia pipes charged and in operation. As of September 2014, much of the pipe insulation had already been replaced, and most of the remainder was scheduled to be replaced in late 2014 and early 2015. There is a total of 4,756 linear feet of refrigeration pipe that is affected, with sizes ranging from 3/4-inch to 12-inch nominal pipe size (NPS) and design operating temperatures from a low of -25°F to a high of 60°F. The replacement pipe insulation system includes a continuously sealed, polyvinylidene chloride (PVDC) film vapor retarder sealed with matching tape and new aluminum jacketing for protection.
Estimating the Thermal Conductivities of Saturated/Ice-Laden
Insulation
Some of the following conclusions are based on the assumption that ice-laden and saturated pipe insulation has a greater thermal conductivity than the same insulation in a dry condition with no ice or water within it. There is evidence to support this assumption. For example, W.F. Cammerer, a German scientist, conducted tests in 1987 on 3 types of insulation—wet phenolic foam, expanded polystyrene (EPS), and mineral wool insulations—and reported his data graphically.1 The results for the 2 cellular insulation materials, EPS polystyrene and phenolic foam, show a pronounced increase in thermal conductivity as a function of water content expressed as percent by volume. Furthermore, the mathematical relationship appears to be best described by a second order polynomial rather than a straight line. 2
More recently, in the Unites States, an Oklahoma State University research team led by Lorenzo Cremaschi tested the thermal conductivity values of phenolic foam pipe insulation at different values of condensed water content. The findings were reported in ASHRAE Research Project RP-1356.3 The results of this research also support the assumption that thermal conductivity of insulation increases with water content. Phenolic foam and extruded polystyrene (XPS) insulation, while different insulation materials, are both closed-cell foam plastics. Thus, it is a fair assumption that even with different densities between the 2 materials, the percent increases in thermal conductivity—based on percent water content by volume—are about equal.
RP-1356 showed that dry phenolic foam pipe insulation on a 42°F pipe had a measured thermal conductivity of 0.20 Btu-in/hr-ft²-°F; with a 5% water content by volume, it had a measured thermal conductivity of 0.31 Btu-in/hr-ft²-°F. his thermal conductivity for the wet insulation, with 5% water content by volume, represents an increase of 56% over that of the dry material at the same mean temperature. Note that these tests were conducted in a hot, humid environmental chamber on phenolic foam pipe insulation with no sheet or film vapor retarder. Thus, the vapor condensation and subsequent increase in moisture content of the insulation occurred in a matter of about 24 days. The RP-1356 tests were accelerated compared to what one would expect in a real application, where there would be a sealed vapor retarder covering the insulation to slow water-vapor migration from the air to the cold pipe beneath the insulation system. The following estimates of thermal conductivity curves for wet and ice-laden XPS polystrene are made using the more recent and conservative RP-1356 data based on phenolic foam, rather than the Cammerer data.
The phenolic foam insulation tested was assumed to have had a dry density of 2.5 lbs/ft³. The XPS polystyrene pipe insulation, which meets ASTM C578, Type XIII, was assumed to have a density of 1.6 lbs/ft³.4 Further, it is assumed that at a given water content by volume, each will have the same percent increase in thermal conductivity compared to the dry insulation. Hence, with 5% water content, it is assumed that the XPS polystyrene insulation would also have a thermal conductivity that is 56% greater than when dry, just like the phenolic foam. Since dry XPS polystyrene insulation has a thermal conductivity of 0.259 Btu-in/hr-ft²-°F, it would have a predicted thermal conductivity, under the same temperature conditions, of 0.40 Btu-in/hr-ft²-°F with a 5% water content by volume.5
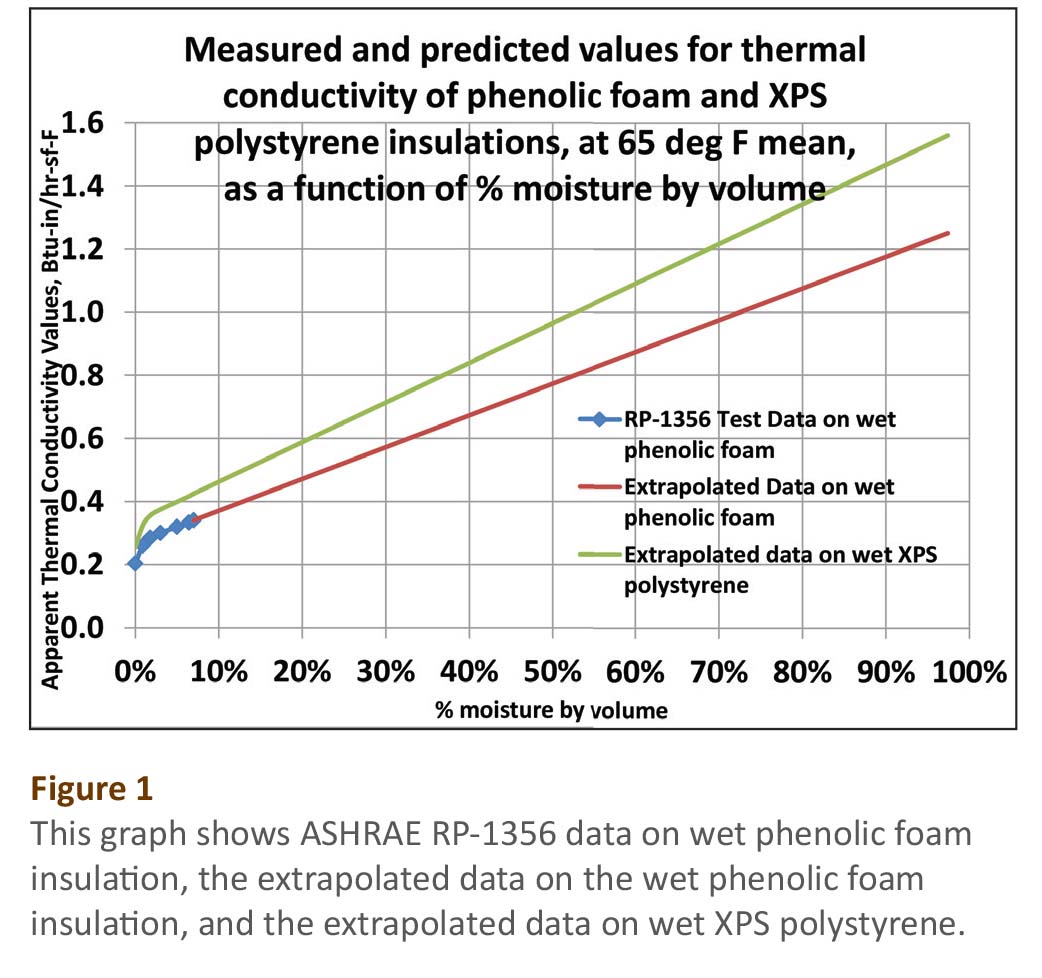
Figure 1 was generated by extrapolating the RP-1356 data to completely saturated phenolic foam, and then estimating the thermal conductivity of XPS polystyrene pipe insulation using the reasoning given above. This figure shows the calculated thermal conductivity as a function of water content for both insulation materials. The graph also includes the Cammerer thermal conductivity data on wet EPS polystyrene for comparison, even though it was not used.
Using this extrapolation, the thermal conductivity of the saturated XPS polystyrene works out to 1.56 Btu-in/hr-ft²-°F at a mean temperature of 65°F, a value that is more than 6 times greater than the 0.25 Btu-in/hr-ft²-°F value for the dry material. However, this thermal conductivity value is considerably less than that of pure water at the same mean temperature, which has a thermal conductivity that is about 4.15 Btu-in/hr-ft²-°F, and 2.67 times greater than predicted for the saturated insulation.6
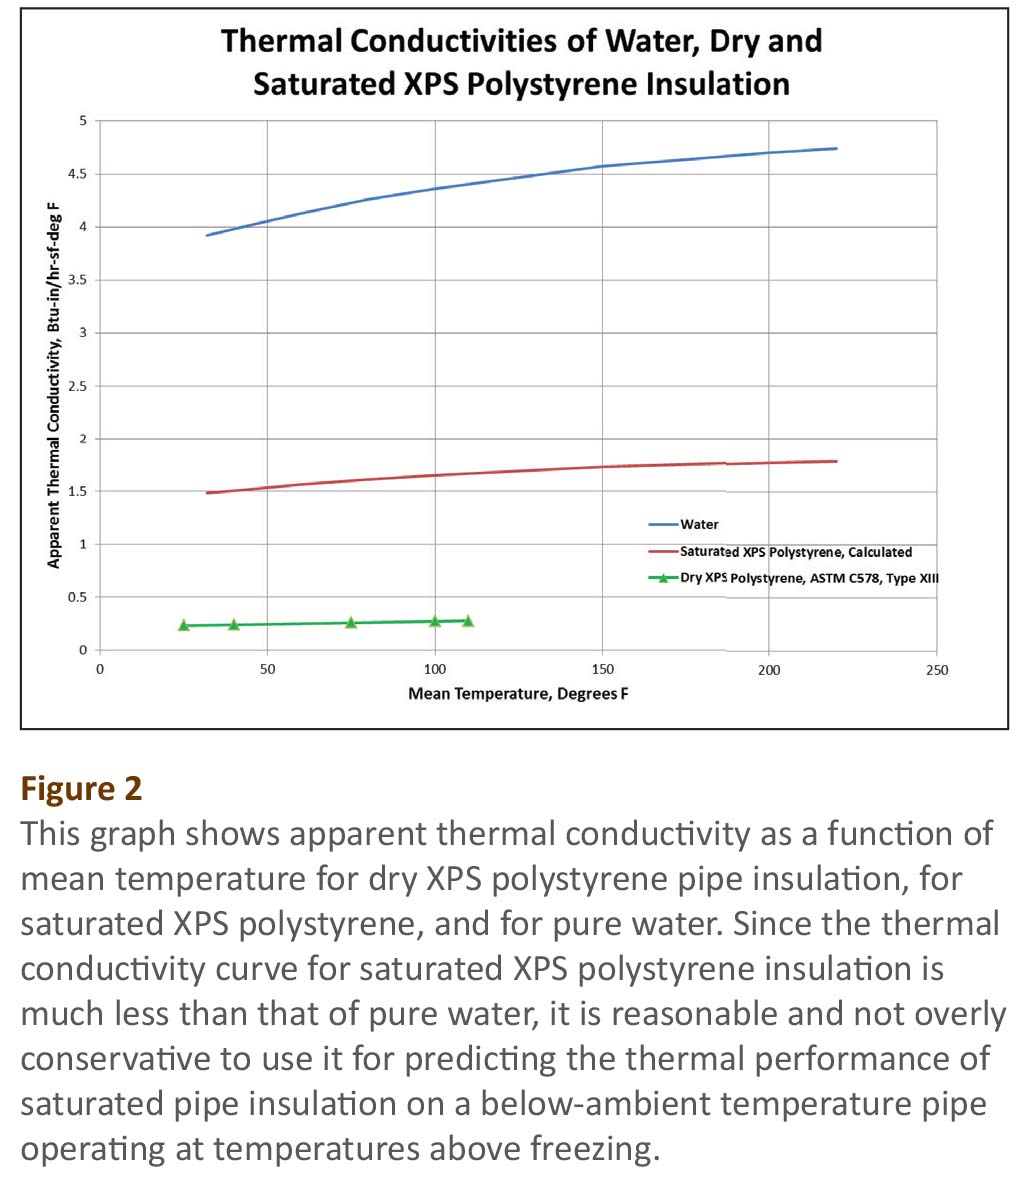
Figure 2 was generated using the thermal conductivity values as a function of mean temperature. It shows 3 curves for thermal conductivity as a function of mean emperature, namely those of dry XPS polystyrene insulation, of pure water, and of wet XPS polystyrene insulation. The purpose of showing these 3 curves is to demonstrate that the curve for dry insulation clearly bounds the lowest possible thermal conductivity values; that the curve for water clearly bounds the highest possible thermal conductivity values; and that the middle curve shows the thermal conductivity curve for the wet insulation that lies between those upper and lower bounding curves.
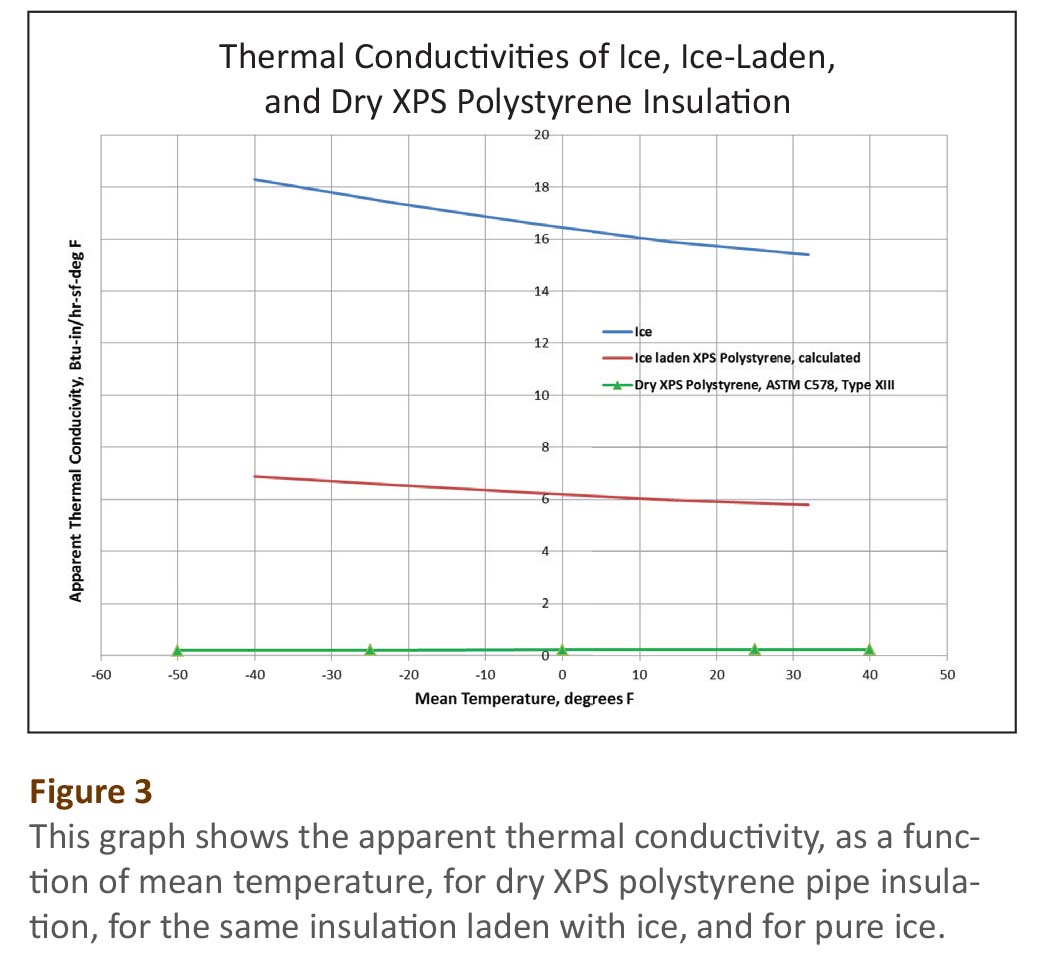
However, the XPS polystyrene pipe insulation inspected in this case study was saturated with ice rather than water. It was installed on an ammonia refrigeration line rated for -25°F, not for 42°F as in the RP-1356 research project. A literature review reveals that ice, at a given mean temperature, has a thermal conductivity that is almost 4 times greater than that of water.7 Following the same reasoning used to generate the graph in Figure 2, Figure 3 was generated with 3 curves for the thermal conductivity as a function of mean temperature: namely one for dry XPS polystyrene, one for ice-laden XPS polystyrene, and one for pure ice. Similar to the findings for water, the curve for dry insulation clearly bounds the lowest possible thermal conductivity values; the curve for ice clearly bounds the highest possible thermal conductivity values; and the middle curve shows a thermal conductivity curve for the ice-laden insulation that lies between these upper and lower bounding curves.
This type of analysis was not performed for the new replacement insulation. This is because the facility owner selected the 0.01 perm PVDC film vapor retarder for both the straight pipes and the fittings, which is water repellent and seals tightly with a matching pressure-sensitive tape. In addition, the replacement insulation selected by the owner has a much lower (i.e., by a factor of 30) water-vapor permeance and a somewhat lower water-absorption performance (i.e., by a factor of 5) than the original insulation. Furthermore, the outer inch of replacement insulation was sealed with a sealant. Hence, in the future, it is safe to expect the replacement insulation to prevent water-vapor transmission through the insulation system, preventing subsequent condensation on the pipe and in the insulation, as occurred in the original insulation.
Estimating the Heat-Gain Savings by Re-insulating the
Refrigerant Pipes
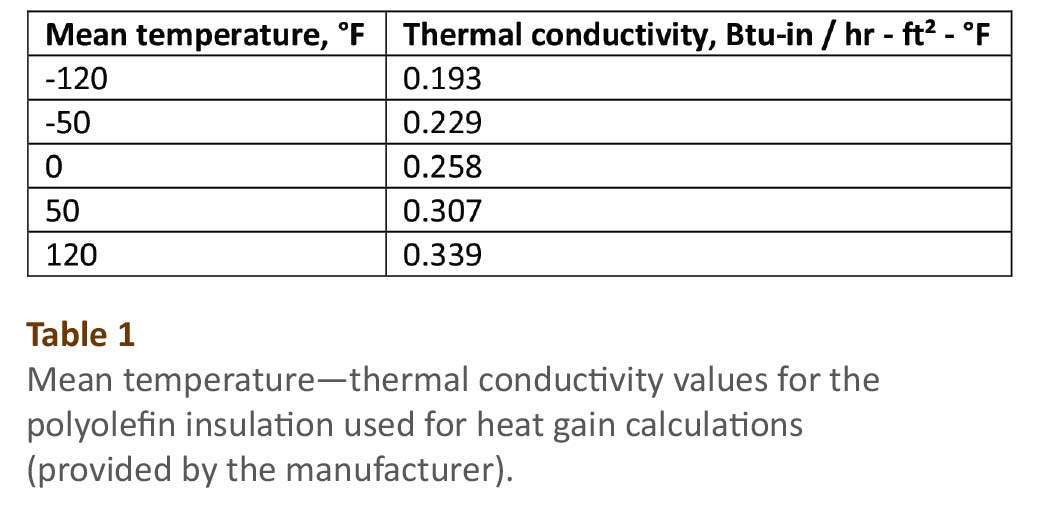
Using the publicly available computer program known as 3E Plus® (available for free from the North American Insulation Manufacturers Association [NAIMA] at ww.pipeinsulation.org), it was possible to calculate heat gain for the refrigerant pipes both before and after insulation replacement.8 To calculate this, an average ambient temperature of 65°F is assumed over the course of the year (note: this temperature is not intended to represent a design ambient temperature, but simply an average for the year), and an average wind speed of 5 mph. The polyolefin manufacturer’s data was used for the new replacement insulation, since it has values very close to those for dry XPS polystyrene insulation at corresponding mean temperatures. Table 1 gives thermal conductivity values as a function of mean temperature for the polyolefin insulation used in this analysis.
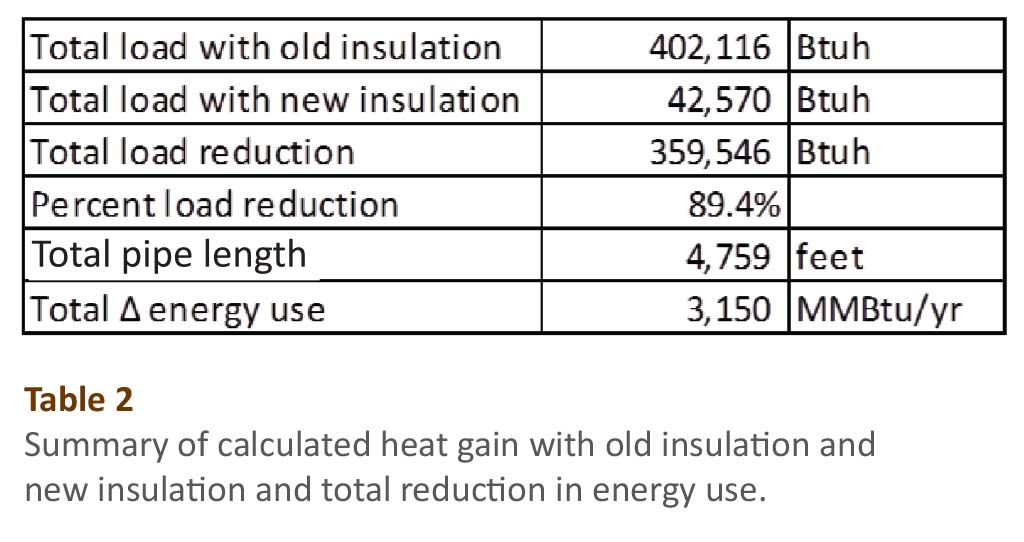
Using the facility owner’s as-built engineering drawings for refrigerant pipe temperatures, sizes, and lengths, and records for pipe insulation thicknesses (which were not changed with the insulation replacement), it was possible to calculate heat-gain savings on an annual basis for each pipe line. They were reduced by several percent to account for scheduled defrost cycles (provided by the facility owner), and then the heat-gain savings were summed. Tabulated results, pipe by pipe, are shown in Tables 1 and 2. As Table 2 shows, the cumulative results came out to a total annual heat gain savings of 3,149 million Btus for the 4,756 linear feet of insulated refrigerant pipe.
A cost/benefit analysis would require financial records of electricity costs spent by the facility owner on his refrigeration systems both before and after insulation replacement; unfortunately, these were not available. Furthermore, records of the refrigeration systems’ combined average Coefficient of Performance (COP) values over the course of a year of operation were also not available. COP refers to the ratio of the refrigeration system output (i.e., cooling power) and refrigeration input (i.e., electrical power). Thus, the greater the COP, the more efficient the refrigeration system is. Since this was not available, a range of values had to be assumed to complete the analysis.
To determine how cost effective the replacement insulation is based on energy savings, a Life-Cycle Cost (LCC) analysis was performed. Assuming a 2% interest rate over an assumed 20-year life of the replacement insulation system, LCCs were calculated in present U.S. dollars for both the original insulation system, if left in place, and the new replacement insulation. The following, Equation 19, was used to calculate Present Value (PV) for energy and for operations and maintenance costs for several different values of COP for the refrigeration system.
Equation 19 PV / AV= ((1 + i)n -1) / (i (1 + i)n)
where i = assumed interest rate (i.e., 2%
annually)and n = assumed life of the
new replacement insulation system, in years (i.e., 20 years)PV = present
valueand AV = annual value
Equation 210 was used for calculation of LCC, seen below.
Equation 210 LCC = I + Repl – Res + E + W + OM&R + O
where LCC = Total LCC in present-value (PV)
dollars of a given alternativeI = Present
Value (PV) investment costs (assumed to be zero)
Repl = PV
capital replacement costs (i.e., $550,000)
Res = PV
residual value (resale value, salvage value) less disposal costs (i.e., already
included in the $550,000 replacement cost)
E = PV of
energy costs (i.e., calculated annual heat gain, in kWh, x $0.10/kWh / COP x P/A
from Equation 1)
W = PV of
water costs (i.e., assumed to be zero)
OM&R = PV of non-fuel
operating, maintenance, and repair costs (i.e., assumed to be $10,000
per year x P/A from Equation 1)
O = PV of
other costs (e.g., contract costs for energy savings performance contracts [ESPCs]
or utility energy service contracts [UESCs]) (i.e., assumed to be zero)
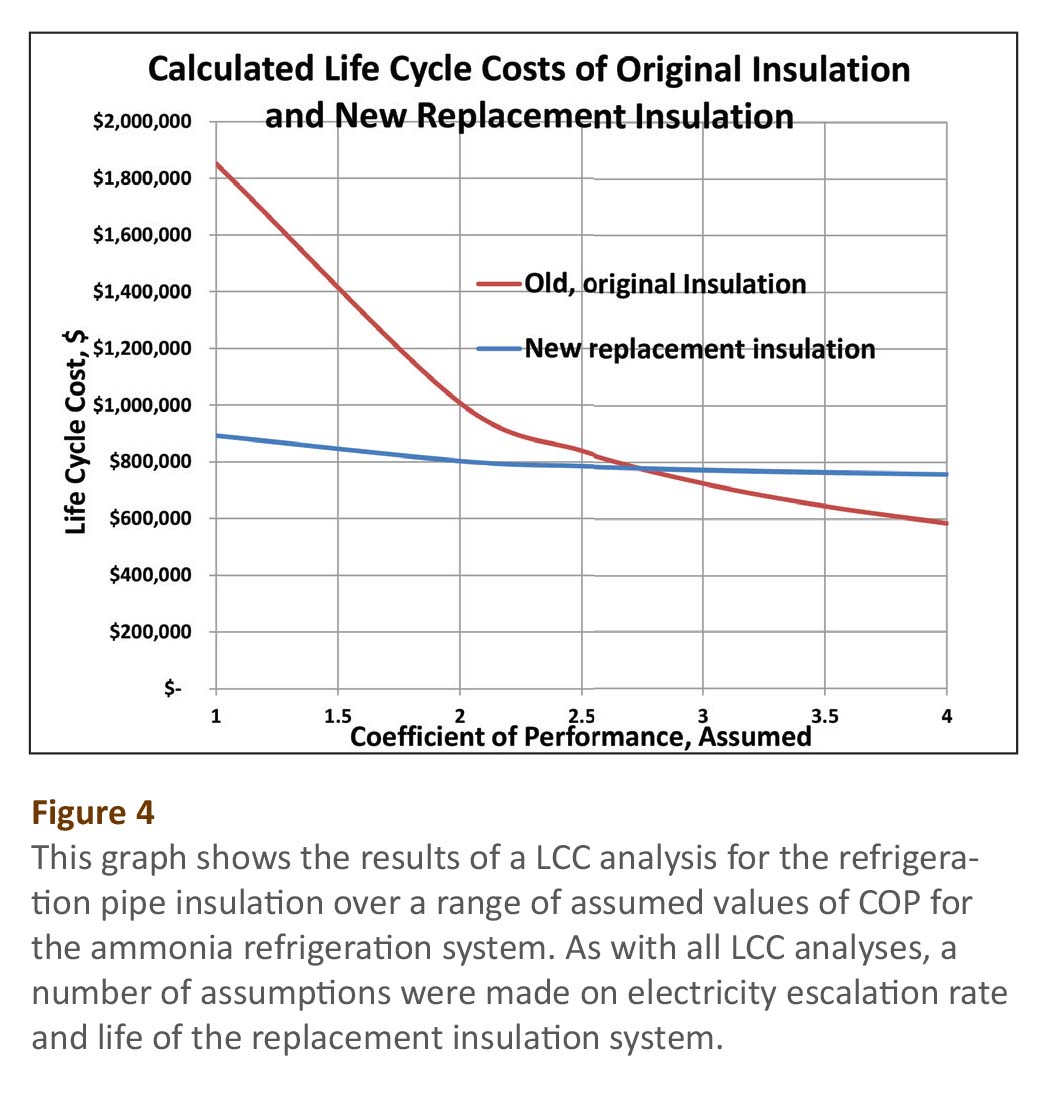
Since the 2 curves cross at an assumed COP of about 2.75 (see Figure 4), that value represents the break-even point for this $550,000 investment in new, replacement insulation, based on future energy savings (based at $0.10 per kWh and an annual interest rate of 2%). Thus, for a COP value < 2.75, this new, replacement insulation system would have an estimated lower LCC over 20 years than the original, ice-laden insulation system. At higher values of COP, leaving the original, ice-laden pipe insulation system in place and using the above assumptions, would have been more cost effective. However, it would still result in the use of greater amounts of energy and is not recommended.
Conclusions and Recommendations
The quoted price from the insulation contractor to perform the insulation removal and replacement was approximately $550,000. This price includes contractor labor for removal and disposal of the original insulation removal; purchase of the new insulation, sealant, PVDC film vapor retarder, and aluminum jacketing; labor to install the new materials; and contractor overhead.
A separate energy analysis showed that re-insulating the roof-top refrigerant pipe led to an annual thermal energy savings of 3,149 million Btus. This results in an estimated 89.4% load reduction on the insulated pipes. An LCC analysis concludes that with a refrigeration system COP less than 2.75, this insulation replacement would have a lower LCC than leaving the original, ice-laden and wet pipe insulation in place.
It is recommended that either insulation manufacturers or the refrigeration industry test wet and ice-laden insulation materials, of the types used on ammonia refrigeration pipes, for thermal conductivity as a function of moisture content. This will allow economic analyses such as this to be more refined, with fewer assumptions. It is also recommended that mechanical designers specify insulation vapor retarder and jacketing materials that are recommended by the 2014 revision of Chapter 7 of the International Institute of Ammonia Refrigeration’s Ammonia Refrigeration Piping Handbook.11 Additionally, it is recommended that mechanical designers use software that models simultaneous heat and mass transfer to improve predictions of water-vapor transmission into refrigeration pipe insulation. Doing so will provide the opportunity to make improvements in water-vapor control strategies for pipe insulation systems.
References:
- W.F. Cammerer, “Der Feuchtigkeitseinfluss auf die Wärmeleitfähigkeit von
Bau- und Wärmedämmstoffen.” Bauphysik 9 (1987), Heft 6, Seite 259-266. - Ibid.
- Lorenzo Cremaschi, “Methodology to Measure Thermal Performance of Pipe
Insulation at Below Ambient Temperatures,” ASHRAE Research Project RP-1356 (2012). - ASTM International, “Standard Specification for Rigid, Cellular
Polystyrene Thermal Insulation,” ASTM C578, ASTM International, West Conshohocken,
PA (2014). - Ibid.
- “Water Properties,” University of California—Santa Cruz, accessed June
9, 2015, http://people.ucsc.edu/~bkdaniel/WaterProperties.html. - “Ice—Thermal Properties,” The Engineering Toolbox, accessed June
9, 2015, www.engineeringtoolbox.com/ice-thermal-properties-d_576.html. - 3E Plus®, Version 4.1, NAIMA, accessed June 9, 2015,
www.pipeinsulation.org. - Michael R. Lindeberg, Engineering in Training Review Manual, Sixth
Edition, Chapter 2, Table 2.1. - “Life-Cycle Cost Analysis (LCCA),” Whole Building Design Guide, National
Institute of Building Sciences, accessed June 9, 2015,
www.wbdg.org/resources/lcca.php. - International Institute of Ammonia Refrigeration. Ammonia Refrigeration
Piping Handbook, Chapter 7, “Insulation for Refrigeration Systems,” 2014.