Hot Water Distribution Research
The California Energy Commission funded a project to study the performance of hot water distribution piping. That research was conducted by Dr. Carl Hiller, P.E., president of Applied Energy Technology.1
The purpose of the research was to compare the performance of hot water flowing through insulated and uninsulated pipes of various diameters. Before we began the tests, we developed a matrix of test conditions that was quite large. We decided to start with ½- and ¾-inch nominal diameter piping, since our observation was that these two sizes were the most commonly used in single-family residences, both in California and around the country. These pipe diameters are also commonly found in multi-family, commercial, and industrial applications, and what we learned is applicable to these situations, too. The tests were to be conducted in air, with the temperature surrounding the pipes in the 65-70°F range.
We also decided to test copper and PEXAluminum-PEX (PEX-Al-PEX): copper because of its historically widespread use and PEX-Al-PEX because it was in common use in California at the time we began the tests. Since that time, we have seen a rapid shift to PEX piping that does not have an aluminum layer. The reasons for the change in plumbing practice appear to be due to a shortage of PEX-Al-PEX piping beginning in early 2004 and widespread use of manifold (home run) plumbing systems in single-family homes. Looking back, it would probably have made better sense to test PEX instead of PEX-Al-PEX; so much for 20/20 hindsight!
What Is a Hot Water Event?
A hot water event is shown in Figure 1. Each hot water event has three phases: delivery, use, and cool down. When a fixture is opened, hot water leaves the water heater and heads through the hot water piping toward the fixture. Ideally, this delivery time should be as short as possible. In practice there are probably two parts to the delivery phase. The first part is technical or structural and depends on the plumbing system configuration; the location of the pipes; the volume of the water in the pipes between the water heater and the fixture; whether the piping is insulated; the fixture flow rate; the temperature of the water in the pipes compared to the temperature in the water heater, etc.
The second part is behavioral and depends on when the occupant decides the water is hot enough to use and “get in.” The behavioral waste can be significantly greater than the structural waste. The delivery phase may be short at some fixtures and long at others. It may be short or long at the same fixture, depending on when hot water was last needed somewhere else on the same line that serves the fixture. Some people hover near the fixture, checking to see when the water is hot enough, while others know from experience that it takes a long time, so they leave, returning when they are good and ready! From the occupant’s point of view, this may appear to be totally random and hard to “learn,” in which case I suspect their behavior defaults to the worst case condition at all fixtures.
In articles that appeared in Official magazine in 2005, we showed how it is possible to deliver hot water, wasting no more than 1 cup. At flow rates between 0.5 and 2.5 gpm, this means the water will be delivered in 7.5 down to 1.5 seconds, which is pretty darned fast.
The use phase needs to be whatever length it takes to perform the task for which hot water is desired. The cool down phase begins the moment the fixture is turned off. If the time until the next hot water event is short enough, the water in the pipes all the way back to the water heater will be hot enough to use. If it is too long, water coming from the water heater will be run down the drain until water hot enough to use arrives at the fixture.
At the fixture, hot water is generally mixed with cold water to reach the desired useful hot water temperature. The thermostat on the water heater needs to be set high enough to overcome the heat losses in the piping system and still provide water that is hot enough to be mixed at the farthest fixture with the highest desired useful hot water temperature. For purposes of our experiments, we selected 105°F as the nominal useful hot water temperature.
From our research, we have learned about all three phases of this process.
The Test Rig
The test rig to measure the performance is shown schematically in Figure 2.
Calculations and observations helped us decide to test roughly 120-foot-long sections of pipe. Since our lab was only 40 feet long, we needed to create a serpentine piping layout. When we used hard copper pipe, the long legs were nominally 20 feet long (the pipe is actually a bit longer) and the short legs were roughly 18 inches long. Temperature sensors were located at the beginning and end of the serpentine shape and at the center of each short leg.
We thought these two layouts, one for hard pipe and one for flexible pipe, were essentially identical. It turns out that they weren’t identical, and we learned a great deal from this mistake.
The Delivery Phase
We learned three things from our research about the delivery phase:
- During the delivery phase, hot water acts differently than cold water.
- Low flow rates (< 1 gpm) waste much more water than high flow rates (> 4 gpm).
- At typical fixture flow rates (1-3 gpm), sharp (standard) 90-degree elbows increase turbulence, heat loss, and water waste.
Perhaps one of the most surprising things that we learned is that it is possible for significantly more water to come out of the pipe before hot water gets from the water heater to the fixture than is actually in the pipe. During the tests, our researcher found that the temperature sensor on the first turn was getting hot sooner than was theoretically possible assuming perfect plug flow. The difference in time was significant—otherwise he probably wouldn’t have noticed it. To figure out what was going on, he used his hands to feel the pipe and found that there was a thin stream of hot water riding on top of the cold water that was running many feet ahead of the plug of hot water coming from the water heater. After some time, mixing would occur, but until that happened, there was a much greater surface area of hot water touching both the cold water and the relatively cold pipe than would normally have been expected.
This is depicted in the top portion of Figure 3. At the beginning of a hot water event, the cold water is much more viscous than the hot water. The length of the thin stream of hot water could be more than 20 feet long and would go around the elbows. The volume of water that would come out of the pipe (or past a given temperature sensor) before hot water arrived could be twice the volume that was in the pipe.
We found this condition most prevalent at flow rates less than 1 gpm. These flow rates are typical of commercial lavatory sinks, low flow showers, and the hot water portion of the flow in a single lever sink when the valve is opened halfway between hot and cold.
As the flow rate increased into the range typical of many sinks and showers (1-3 gpm), the thin stream gave way to a more normal mixing front, which we have depicted as a long bullet. The length of the bullet was several feet ahead of the hot water plug. The extra volume of water that came out of the pipe before hot water arrived was generally 10 to 50 percent more than the volume of water in the pipe. The waste was larger for a given flow rate in the hard-piped test rig that had standard elbows than it was in the flexible pipe test rig that used wide-radius bends in the pipe itself to make the 180-degree turns.
At higher flow rates, typical of those found in garden or Jacuzzi tubs, some laundry sinks, washing machines, and dishwashers, we saw what looked like plug flow—the idealized type of flow I heard described in engineering school. In these cases, the length of the much shorter bullet was only a very short distance ahead of the hot water plug. The extra volume of water that came out of the pipe before hot water arrived was generally much less than 10 percent more than the volume of water in the pipe. We found this condition some of the time at high flow rates in the hard-pipe test rig with hard elbows. We found it much more often and at lower flow rates in the flexible test rig with wide-radius bends.
I had delivery problems when I measured my house. Looking back, I had installed a low flow showerhead (1 gpm) specifically to save water. However, both the low flow rate and the elbows in the copper piping created conditions that wasted a significant amount of water before the hot water arrived (more than twice what was in the pipe). This was certainly an unintended consequence of my attempt to save water! The extra water that came out had to be heated by the water heater and so my energy consumption was increased during the delivery phase. As we will see in the next section, the low flow rate fixture also frustrated my attempt to save energy during the use phase, too.
The Use Phase
We learned four things about the use phase:
- Uninsulated PEX-Al-PEX piping has a greater temperature drop at a given flow rate than does copper piping of the same nominal diameter. Insulating the pipes minimized the difference.
- The temperature drop at a given flow rate is less in ½-inch piping than in ¾-inch piping.
- The temperature drop over a given distance is greater at low flow rates than at high flow rates. There is a significant difference in the rate of change of the temperature drop at flow rates below 1 gpm.
- Insulation decreases the temperature drop at a given flow rate.
Figure 4 shows the comparison between nominal ¾-inch PEX-Al-PEX and ¾-inch copper piping over a length of 100 feet. The figure is based on steady state flow rates with the hot water entering the pipe at 135°F and the ambient air temperature surrounding the pipe at 67.5°F. The water in the uninsulated PEX-Al-PEX pipe lost more temperature at the same flow rate than did the water in the copper pipe. We suspect that this additional heat loss is due to a combination of two effects: the nominal ¾-inch PEX-Al-PEX pipe has a larger surface area than the nominal ¾-inch copper pipe—once it is hot there is more surface area to lose heat; and because the PEX-Al-PEX has a larger internal diameter than the copper piping, the face velocity of the water in the PEX-Al-PEX is slower and the rate of heat loss is greater than it is in copper. Once the pipes were insulated, the difference in temperature drop essentially disappeared.
We did not have enough funding to run tests on ½-inch PEX-Al-PEX. Based on the fact that uninsulated copper performed better than PEX-Al-PEX and, with insulation, the performance was very similar, we think we can use the performance of copper pipe at ½- and ¾-inch, with and without insulation, as a reasonable first order proxy to better understand what generally happens in hot water piping.
Figure 5 compares the performance of nominal ½- and ¾-inch diameter copper piping, both insulated and uninsulated. As in the prior figure, the graph is based on steady state flow rates with the hot water entering the pipe at 135°F and the ambient air temperature surrounding the pipe at 67.5°F over a length of 100 feet.
At a given flow rate, the temperature drop in ½-inch nominal piping is less than in ¾-inch nominal piping. This is due to the increased face velocity of the water, which reduces the heat loss rate. While from a thermal perspective it is beneficial to use the smallest pipe diameter possible, frictional losses increase exponentially with increased face velocity and result in increased pressure drop over a given length. We did not measure pressure drop during the tests. Future tests should do this so as to better understand its impacts.
The temperature drop over a given distance is greater at low flow rates than at high flow rates. At 2.5 gpm, the highest flow rate allowed for showerheads, the temperature drop in uninsulated copper piping is between 2°F and 2.5°F. At 1 gpm, the temperature drop in uninsulated pipe climbs to between 4.5°F and 5.5°F. At 5 gpm, the temperature drop goes down to roughly 1°F, and the difference between ½- and ¾-inch diameter goes away.
There is a significant difference in the rate of change of the temperature drop at flow rates below 1 gpm. At 0.5 gpm, the temperature drop almost doubles. The curve will get even steeper if the flow rate is reduced still further and, for a given length at some low flow rate, hot water will never reach the fixture. The same thing would happen if length was increased while flow rate was held constant, or if the piping was located in a higher heat loss environment, say in damp soil under a slab or between buildings in a campus situation.
Insulation reduces the heat loss overall and, for a given flow rate, the temperature drop is cut roughly in half. Insulation also reduces the difference in temperature drop between ½- and ¾-inch diameter piping.
The Cool Down Phase
We learned three things about the cool down phase:
- If the time between hot water events is long enough, the pipes cool down to below the useful hot water temperature for the next hot water event.
- Larger diameter pipes cool down more slowly than smaller diameter pipes.
- Insulation extends the time it takes for the pipes to cool down to a given temperature.
The first point seems obvious, since if you wait long enough, the temperature of the water in the pipes will eventually reach equilibrium with the ambient temperature surrounding the pipes. The real question is: how long does it take to cool down to a non-useful hot water temperature? This depends upon the starting temperature of the water in the pipes, the diameter of the pipes, the amount of pipe insulation, the environmental conditions in which the pipes are located, and the temperature of water needed for the next hot water event.
Figure 6 compares how long it took for the water in ¾-inch diameter copper pipes to cool down from a given starting temperature to 105°F. The ambient temperature surrounding the pipes was between 65°F and 70°F and the pipes were located in air. Without insulation, it took between 5 and 22 minutes for the temperature to reach 105°F. The hotter the water began, the longer it took.
When ½-inch wall thickness and ¾-inch wall thickness insulation were added, it took significantly longer for the water to cool down to 105°F. Use of the ¾-inch thick insulation (>R-4) roughly tripled the cool down time. The ½-inch wall thickness insulation did almost as well.
Figure 7 compares how long it took for the water in ½-inch diameter copper pipes to cool down from a given starting temperature to 105°F. As with the tests on ¾-inch diameter pipe, the ambient temperature surrounding the pipes was between 65°F and 70°F and the pipes were located in air. Without insulation, it took between 5 and 20 minutes for the temperature to reach 105°F, almost exactly the same as for the uninsulated ¾-inch piping. Use of the ¾-inch thick insulation (>R-4) roughly doubled the cool down time. The ½-inch wall thickness insulation did almost as well.
Although the time it took the water in the uninsulated pipes to cool down was very similar for the ½-inch and ¾-inch diameter pipes, when insulation was added, the water in the ¾-inch pipes took roughly 1.5 times as long to reach the same temperature as the ½-inch pipes.
If the pipes were located in a colder environment, such as in a crawl space or an attic, used at night or early in the morning, or throughout much of the winter, they would have cooled down much more quickly. If the pipes were in a high heat loss environment, such as in the damp soil under a concrete slab, they would cool off even faster. If the ambient temperature were higher, such as in an attic in the middle of a summer afternoon, the pipes would take much longer to cool down. (On the other hand, the water in the cold water pipes might be too hot to use!)
Note
1. Hiller, Dr. Carl, P.E., 2005. Hot Water Distribution System Research?Phase 1, California Energy Commission, Sacramento, California, November 2005, CEC 5002005-161. The full report can be found at: www.energy.ca.gov/pier/final_project_reports/CEC-500-2005-161.html.
Reprinted courtesy of The International Association of Plumbing and Mechanical Officials (IAPMO)—www.iapmo.org/OFFICIAL Magazine—www.eofficial.org.
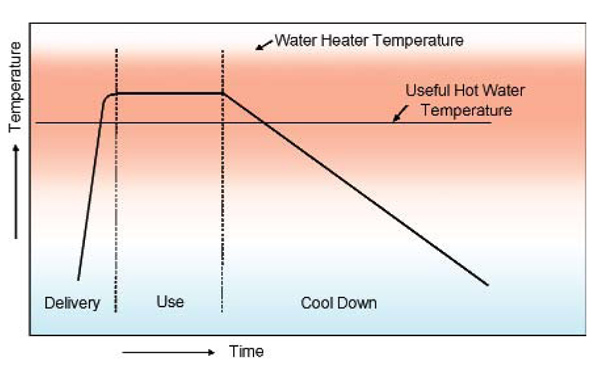 Figure 1
Hot water event schematic
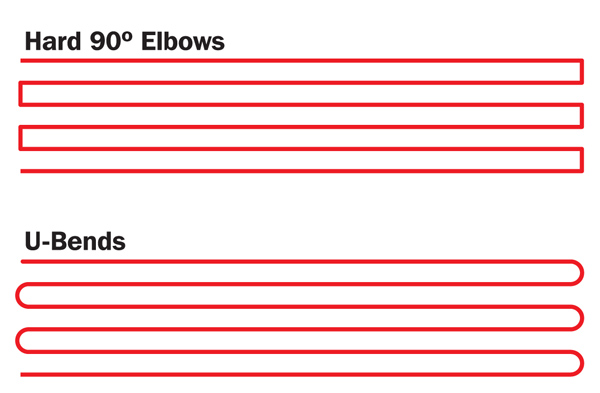 Figure 2
Serpentine test rig schematic
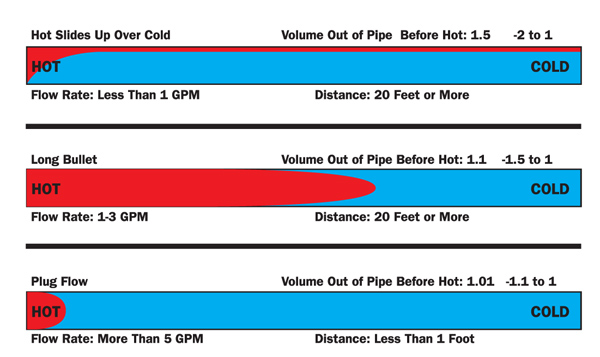 Figure 3
Delivery phase schematics (not to scale)
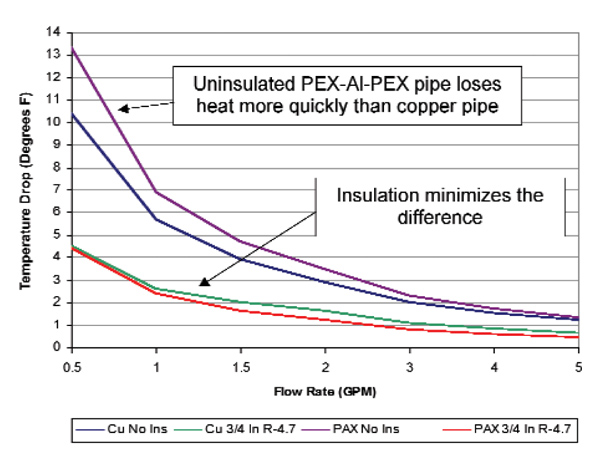 Figure 4
Comparison of nominal 3/4-inch PEX-Al-PEX and 3/4-inch copper piping
 Figure 5
Comparison of nominal 1/2- and 3/4-inch copper piping
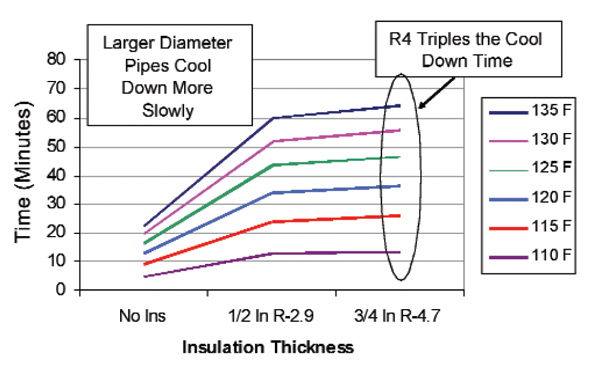 Figure 6
Time required for 3/4-inch diameter pipes to cool down to 105°F with and without pipe insulation
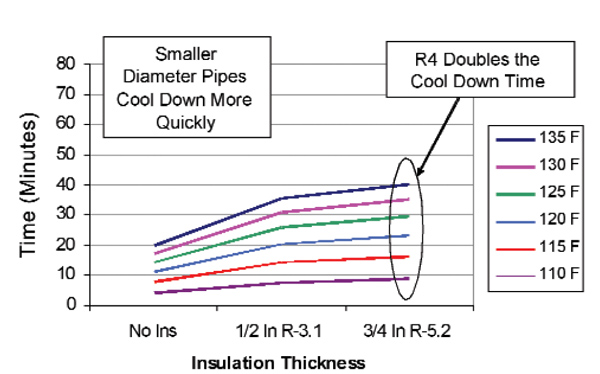 Figure 7
Time required for 1/2-inch diameter pipes to cool down to 105°F with and without pipe insulation