Insulation Is Greener than Planting Trees
Insulation has many benefits. Its ability to reduce energy consumption and save money will always be important. However, the issues of climate change and the reduction of man made greenhouse gas emissions have given insulation a spotlight. In this article, we revisit work originally published in 2009 and 2021 on the environmental benefits of pipe insulation. Our data shows that mechanical insulation is an outstanding opportunity for cost-effective reductions in greenhouse gas emissions. In fact, insulation can still be considered “greener than trees” and was even better than we previously stated. In the 2021 article, we showed the values for a one year time period. If you properly insulate, protect, and maintain that one foot of pipe in 2023, that value given for one year continues for the next year and the next year. It can potentially extend for the life of a building or system measured for 30 to 50 years.
People have heralded planting trees to save the environment. You can even purchase carbon credits for planting trees to offset your carbon emissions. But, oddly enough, some people have turned against trees. Trees release stored carbon as they decay and recent research by Nature1 is finally able to quantify the startling results. According to EcoWatch, “worldwide, dead and decaying wood releases roughly 10.9 gigatons of carbon every year. This is roughly 115% of annual fossil fuel emissions, a new study shows.”2 A new proposal for a Wood Vault to bury dead trees in a vault3 to prevent the stored carbon emissions from being released into the environment has raised $6 million. Six million dollars would insulate a lot of bare pipe, which would definitely, not hopefully, reduce carbon emissions.
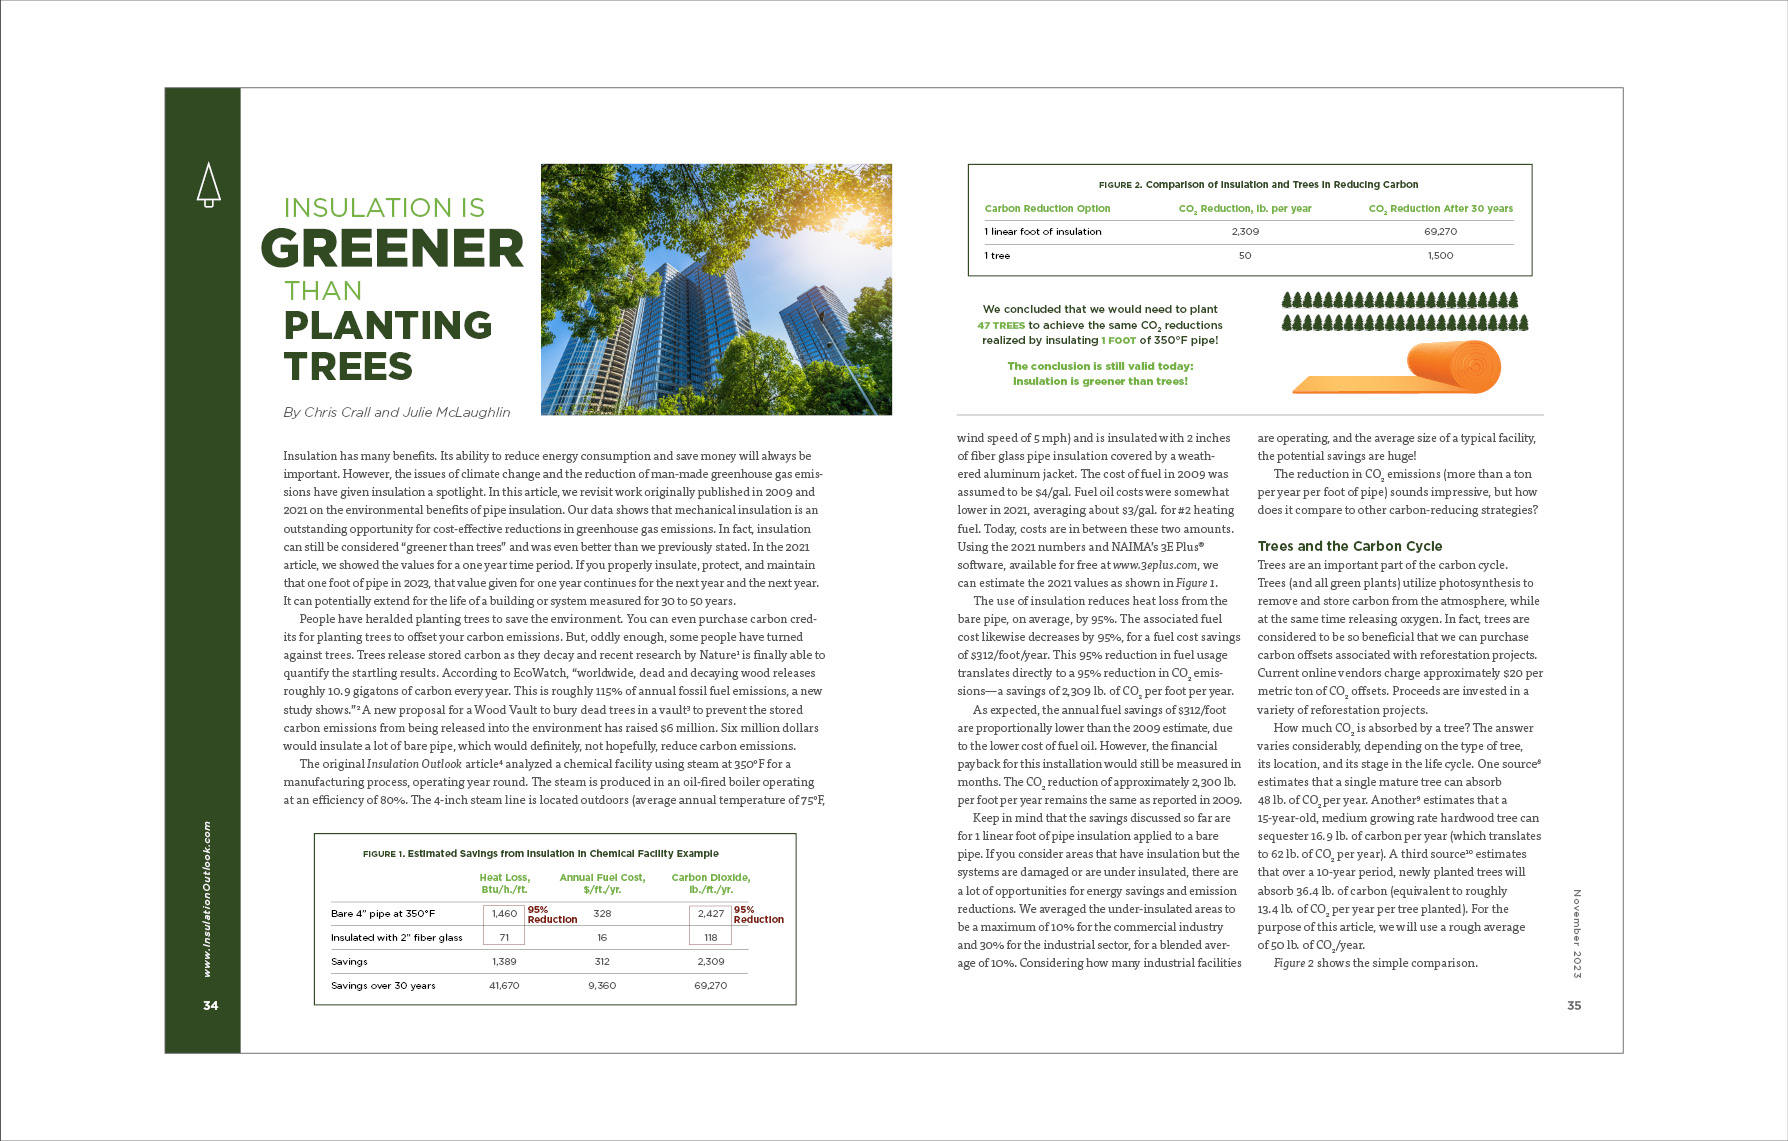
The original Insulation Outlook article4 analyzed a chemical facility using steam at 350°F for a manufacturing process, operating year round. The steam is produced in an oil-fired boiler operating at an efficiency of 80%. The 4-inch steam line is located outdoors (average annual temperature of 75°F, wind speed of 5 mph) and is insulated with 2 inches of fiber glass pipe insulation covered by a weathered aluminum jacket. The cost of fuel in 2009 was assumed to be $4/gal. Fuel oil costs were somewhat lower in 2021, averaging about $3/gal. for #2 heating fuel. Today, costs are in between these two amounts. Using the 2021 numbers and NAIMA’s 3E Plus® software, available for free at www.3eplus.com, we can estimate the 2021 values as shown in Figure 1.
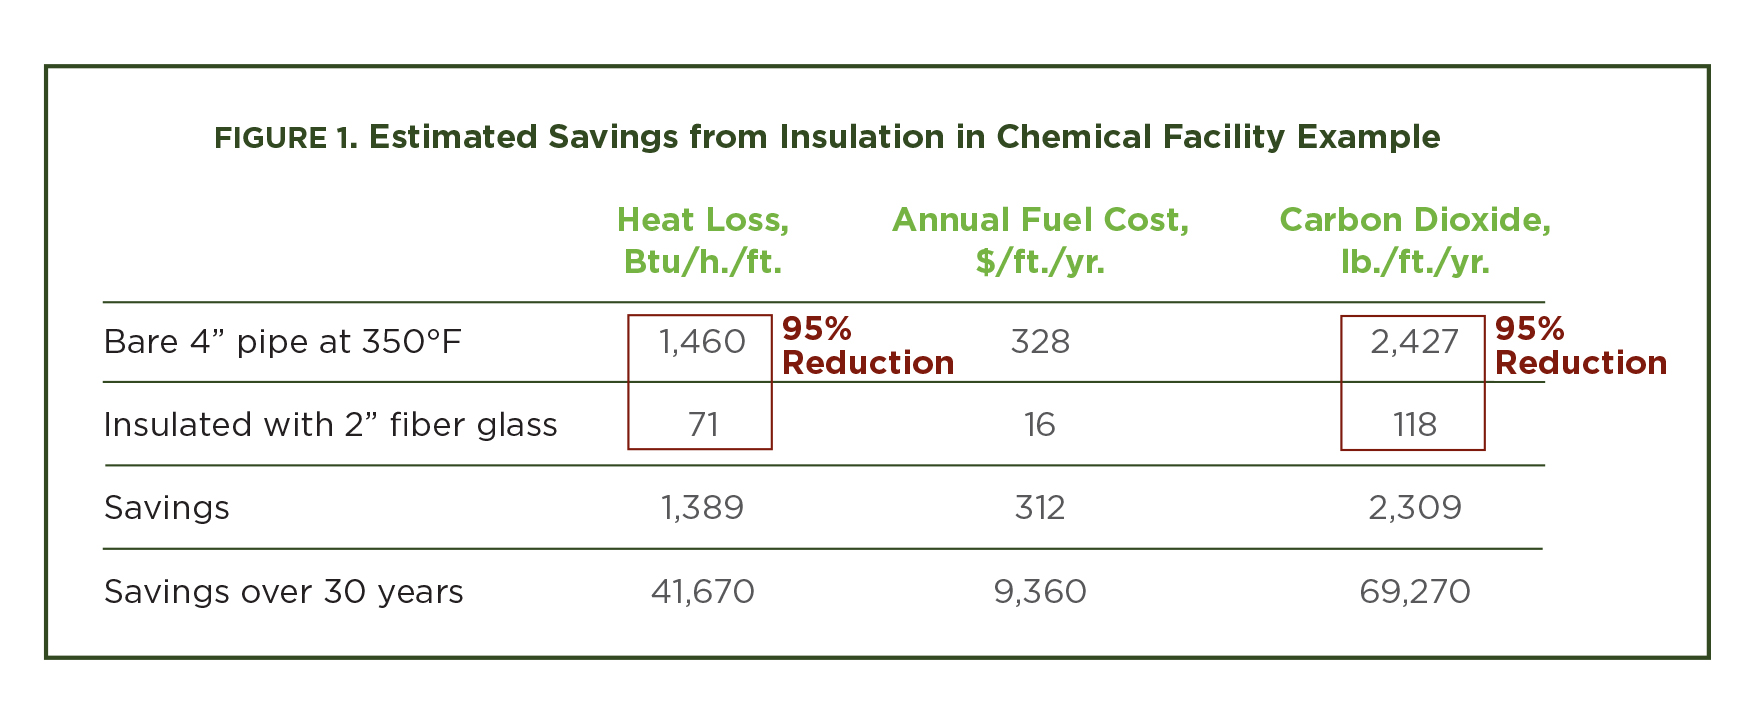
The use of insulation reduces heat loss from the bare pipe, on average, by 95%. The associated fuel cost likewise decreases by 95%, for a fuel cost savings of $312/foot/year. This 95% reduction in fuel usage translates directly to a 95% reduction in CO2 emissions—a savings of 2,309 lb. of CO2 per foot per year.
As expected, the annual fuel savings of $312/foot are proportionally lower than the 2009 estimate, due to the lower cost of fuel oil. However, the financial payback for this installation would still be measured in months. The CO2 reduction of approximately 2,300 lb. per foot per year remains the same as reported in 2009.
Keep in mind that the savings discussed so far are for 1 linear foot of pipe insulation applied to a bare pipe. If you consider areas that have insulation but the systems are damaged or are under insulated, there are a lot of opportunities for energy savings and emission reductions. We averaged the under-insulated areas to be a maximum of 10% for the commercial industry and 30% for the industrial sector, for a blended average of 10%. Considering how many industrial facilities are operating, and the average size of a typical facility, the potential savings are huge!
The reduction in CO2 emissions (more than a ton per year per foot of pipe) sounds impressive, but how does it compare to other carbon-reducing strategies?
Trees and the Carbon Cycle
Trees are an important part of the carbon cycle. Trees (and all green plants) utilize photosynthesis to remove and store carbon from the atmosphere, while at the same time releasing oxygen. In fact, trees are considered to be so beneficial that we can purchase carbon offsets associated with reforestation projects. Current online vendors charge approximately $20 per metric ton of CO2 offsets. Proceeds are invested in a variety of reforestation projects.
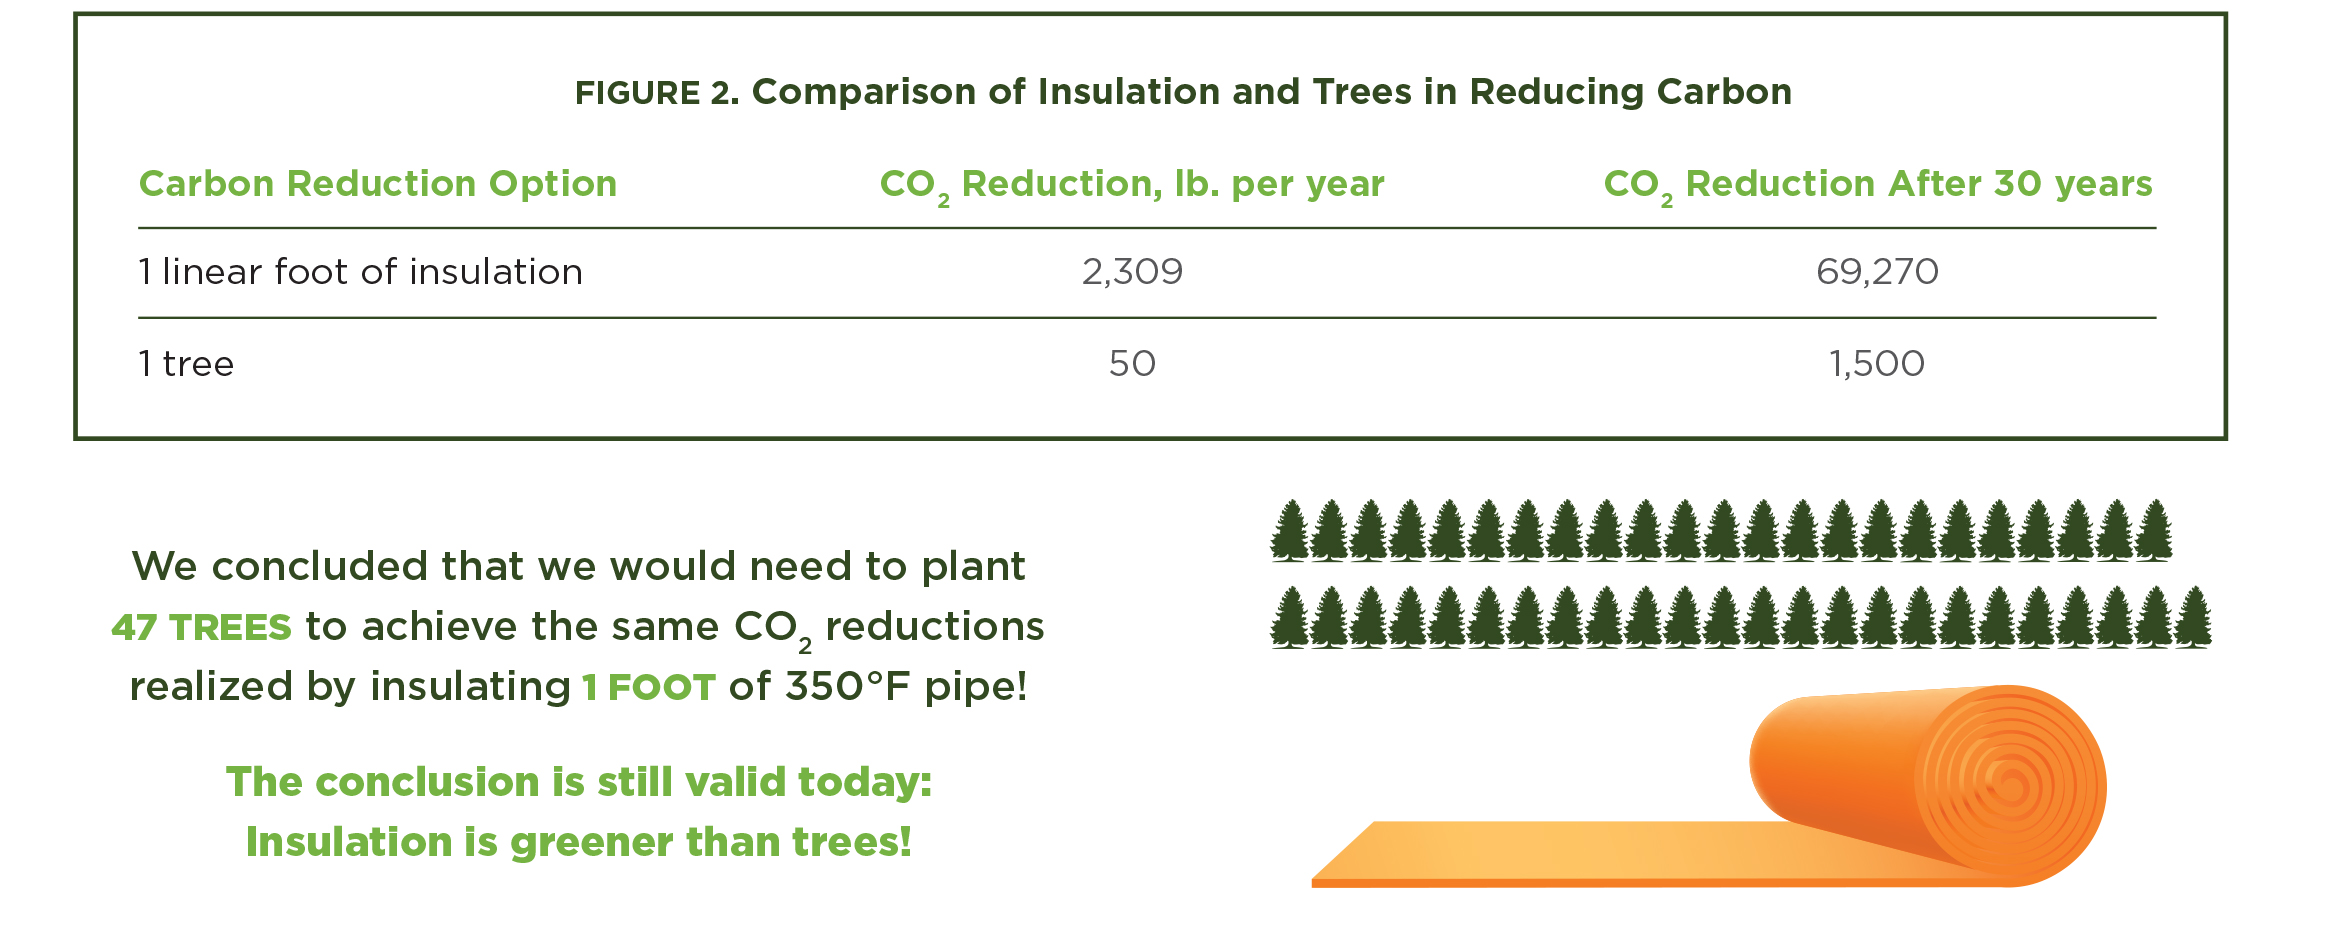
How much CO2 is absorbed by a tree? The answer varies considerably, depending on the type of tree, its location, and its stage in the life cycle. One source8 estimates that a single mature tree can absorb 48 lb. of CO2 per year. Another9 estimates that a 15-year-old, medium growing rate hardwood tree can sequester 16.9 lb. of carbon per year (which translates to 62 lb. of CO2 per year). A third source10 estimates that over a 10-year period, newly planted trees will absorb 36.4 lb. of carbon (equivalent to roughly 13.4 lb. of CO2 per year per tree planted). For the purpose of this article, we will use a rough average of 50 lb. of CO2 /year.
Figure 2 shows the simple comparison.
Other Examples
Most pipes are not operating at 350°F. Some operate at higher temperatures, and many are at lower temperatures. Also, many systems do not operate year round. For illustration, consider a hydronic heating system in a commercial building. We will assume an operating temperature of 180°F and a 2” steel pipe with 2” of elastomeric insulation. (Note that the current ASHRAE Standard 90.1-2019 requires 2” of insulation for this application.) The piping is located primarily above the building’s dropped ceiling (average temperature of 75°F, 1 mph wind speed). The system will operate 26 weeks per year. For this application, we assume a natural gas-fired system operating at 75% efficiency, and a fuel cost of $2.50/Mcf for natural gas. Using NAIMA’s 3E Plus software, we estimate the values shown in Figure 3.
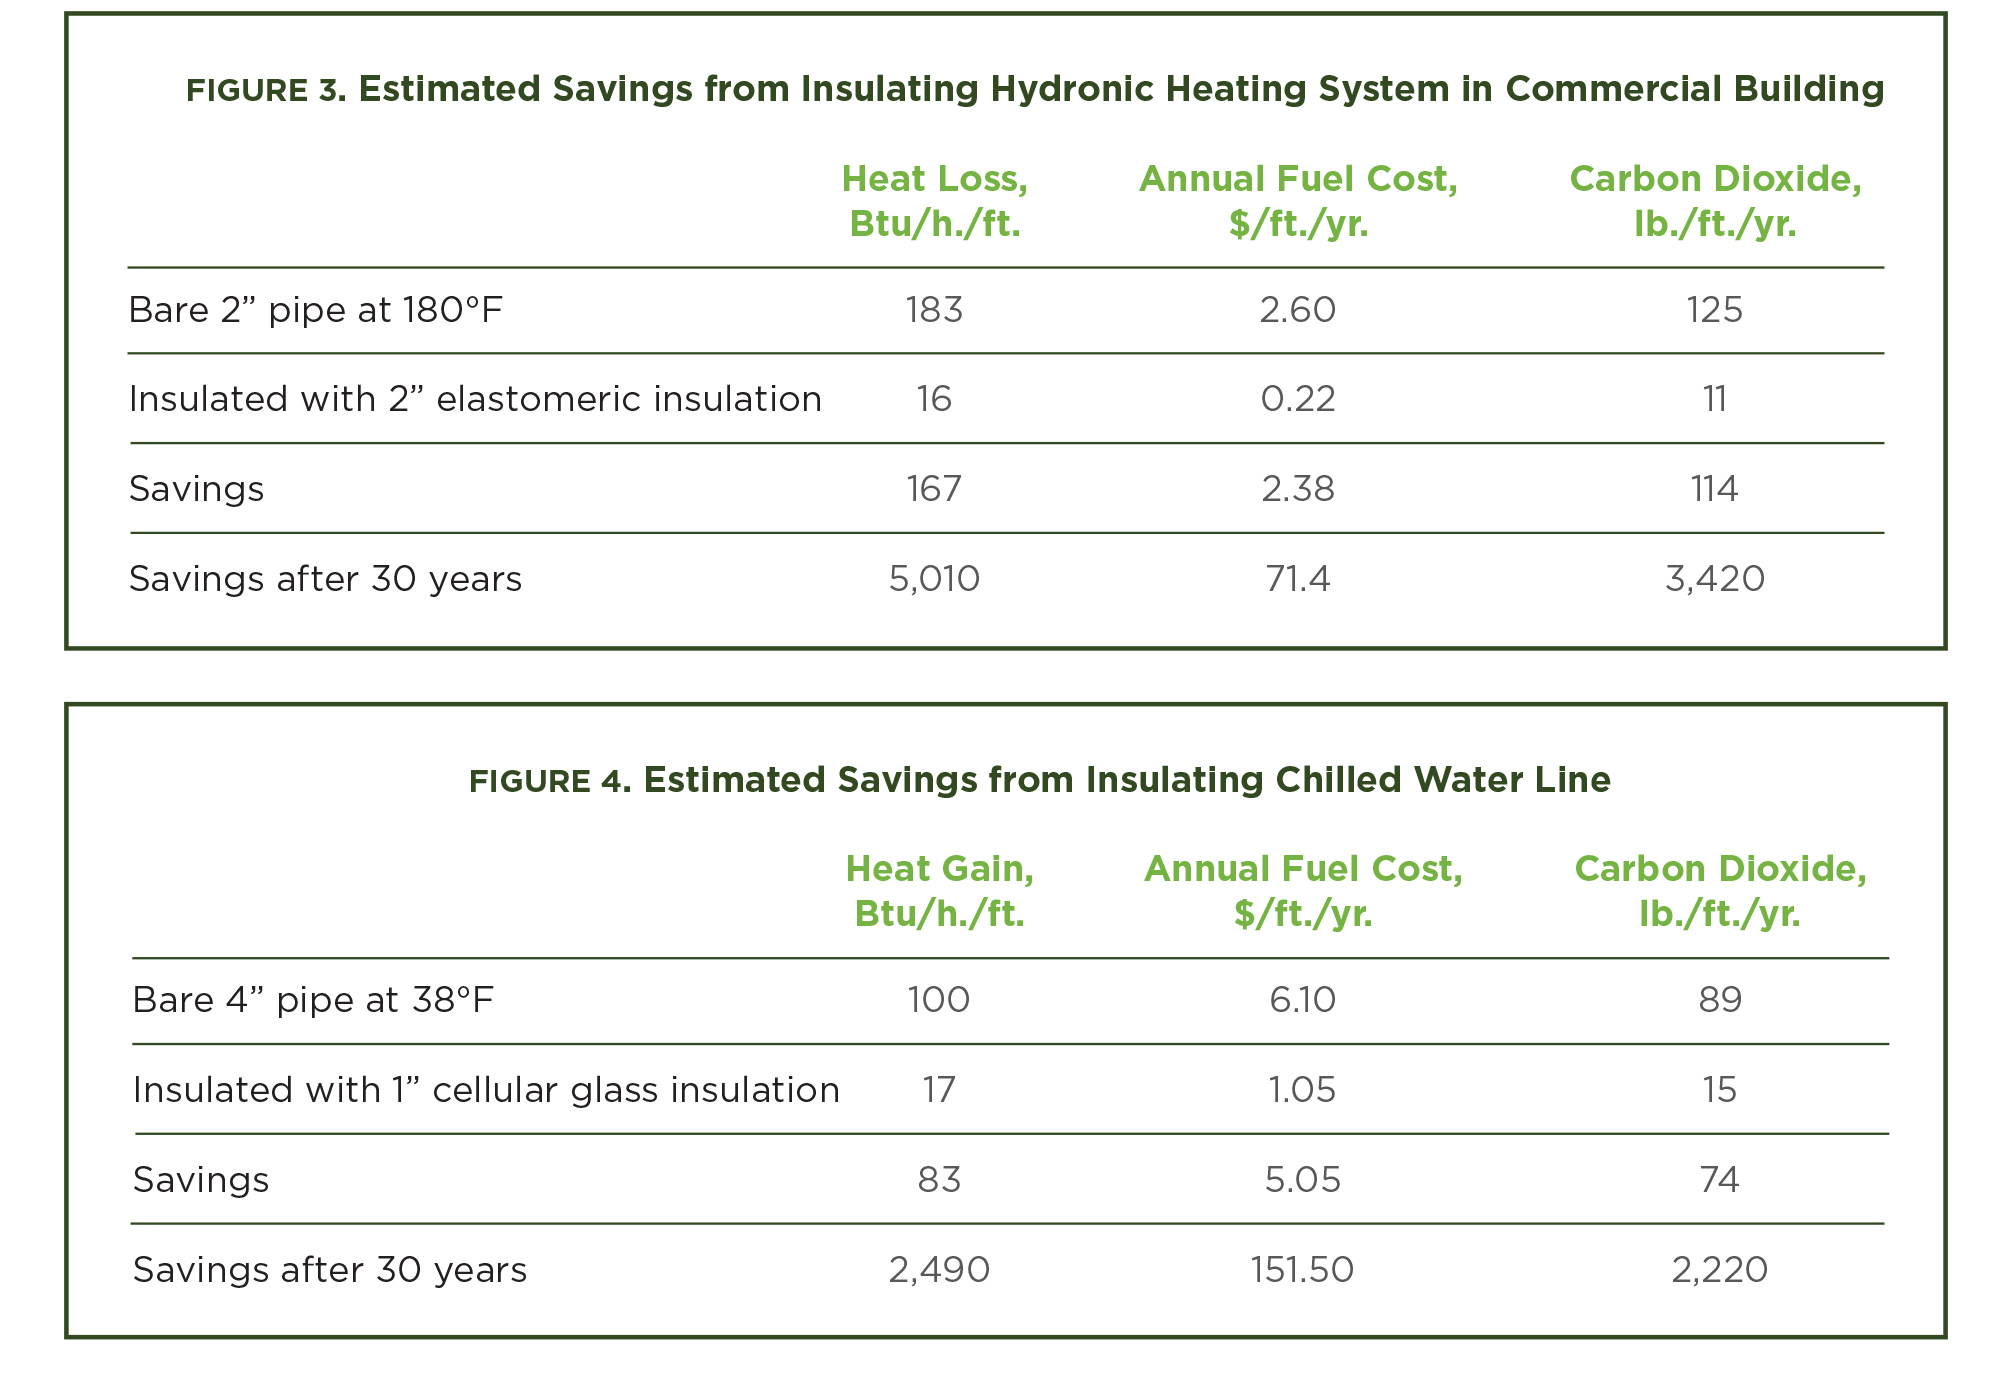
In this example, the heat loss is reduced by 91%, and the corresponding CO2 emissions are reduced by 114 lb./foot/year. So, we would need to plant slightly over two trees to achieve roughly the same CO2 reduction as insulating 1 foot of these hot water pipes.
What about cold piping? Since 2009, chiller systems have increased in efficiency, and chilled water temperatures have generally gone down. Assume a 4” chilled water line operating at 38°F and insulated (per the requirements of ASHRAE Standard 90.1-2019) with 1” of cellular glass insulation. Assume that cooling is provided by electric chillers with a coefficient of performance of 4 (typical of a modern air-cooled system). We will also assume that the system is a high-usage application that operates 95% of the time. The marginal cost of electricity is $0.10/kWh. The results of the 3E Plus analysis of this scenario appear in Figure 4.
For this example, the 1” insulation reduces the heat gain by 83% and saves 74 lb. of CO2 per foot per year. We would need to plant 1½ trees to achieve roughly the same annual reduction realized by 1 foot of pipe insulation.
This discussion has not considered the longer-term implications of forests and the carbon cycle. Most researchers consider mature forests to be carbon neutral, in that they contain some vegetation that is young and still growing (i.e., absorbing CO2 from the atmosphere and storing carbon), which is balanced by vegetation that has died and is decaying (i.e., giving up CO2 to the atmosphere or the soil). While established forests serve as a significant storehouse for carbon, any carbon stored in trees is eventually returned to the environment.
This article should not be interpreted as an argument against planting trees, restoring forests, or maintaining existing forests. Trees provide many useful benefits. They provide shade in the summer, shelter for wildlife, and many of our most important building materials; and they are much more pleasing to look at than a piece of insulation. As a method for controlling greenhouse gases, insulation is greener than trees.
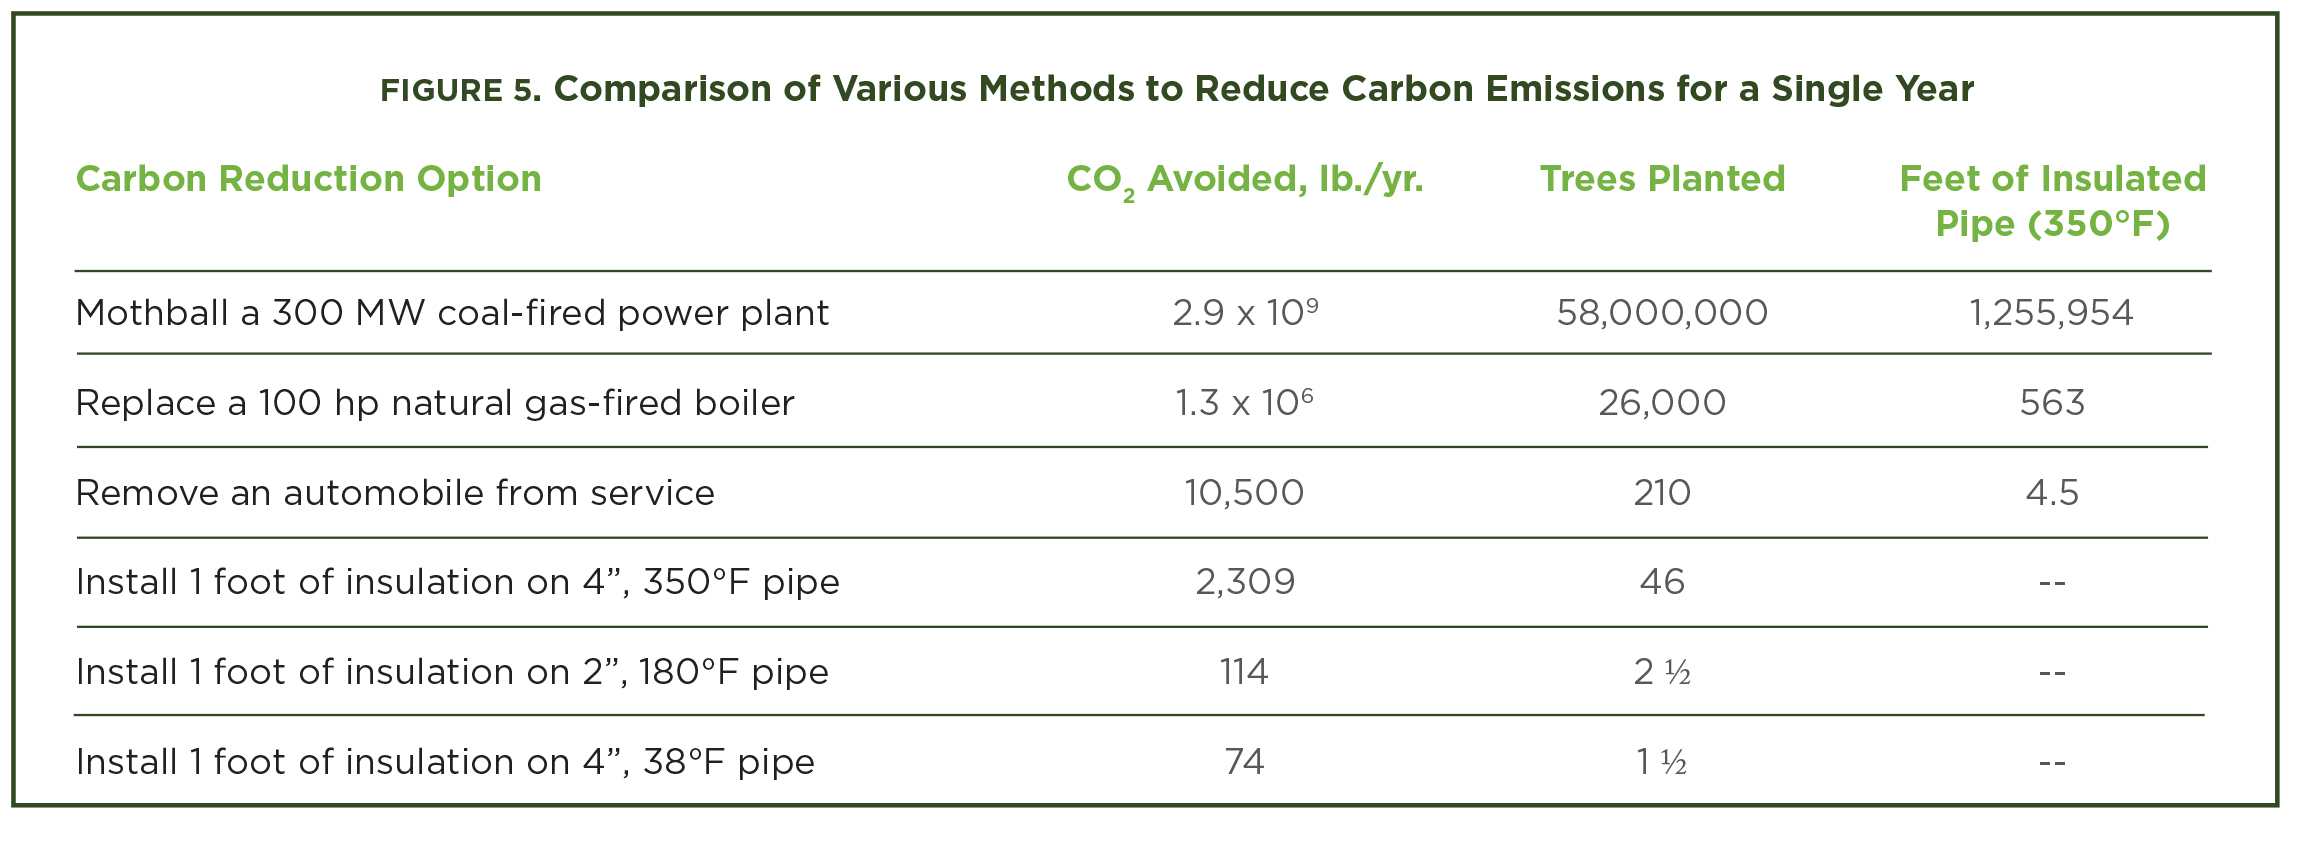
What about other carbon-reduction technologies? How does insulation stack up compared to other methods currently being discussed? See Figure 5.
Conclusion
Mechanical insulation is a well-developed energy-conserving technology that is, in fact, greener than trees, light bulbs, and many common or even new technologies. Insulation is a proven solution that can be implemented almost immediately across the globe in residential, commercial, and industrial sectors. Insulation reduces the amount of energy used, pays for itself quickly, reduces GHG emissions, and on top of that, it maintains process temperatures, extends equipment life, protects personnel, provides acoustic control inside and around plants and facilities. How many other technologies that are being considered for carbon and GHG emissions control offer all these other benefits? Insulation works and it is ready to start improving your systems and propel your organization towards its energy and emission reduction goals. Start by contacting a qualified NIA contractor to get your insulation systems inspected or an energy audit performed.
References
1. Raw data from the global deadwood experiment, our global map of deadwood carbon and our map of predicted decomposition rates are publicly available from Figshare https://figshare.com/s/ffc39ee0724b11bf450c (https://doi.org/10.6084/m9.figshare.14545992).
2. www.ecowatch.com/dead-forests-climate-change-2655176253.html
3. https://carboncredits.com/wood-vault-a-carbon-storage-system-to-lock-co2-away
4. Crall, C.P., “Insulation: Greener than Trees,” Insulation Outlook, January 2009.
5. www.arborday.org
6. U.S. Department of Energy, Energy Information Administration, “Method for Calculating Carbon Sequestration by Trees in Urban and Suburban Settings,” April 1998.
7. www.epa.gov/energy/greenhouse-gases-equivalencies-calculator-calculations-and-references
8. www.c2es.org/content/international-emissions
9. www.en.wiki/List of Coal Fired Power Stations in the United States
10. www.eia.gov/tools/faqs