Insulation—Still Greener than Trees!
Insulation has many benefits. Its ability to reduce energy consumption and save money will always be important. Recently, its ability to protect from freezing temperatures made headlines in Texas. Also trending are the issues of climate change and the reduction of man-made greenhouse gas emissions. Many organizations have established goals to be carbon neutral by 2030, and insulation can help. Mechanical insulation provides an outstanding opportunity for the cost-effective reduction of greenhouse gas emissions.
NIA has promoted the benefits of insulation for decades. In this article, we revisit work originally published in 2009 on the environmental benefits of pipe insulation to see what has changed. The short answer is that while much has changed, mechanical insulation still provides an outstanding opportunity for cost-effective reductions in greenhouse gas emissions. In fact, insulation can still be considered “greener than trees!”
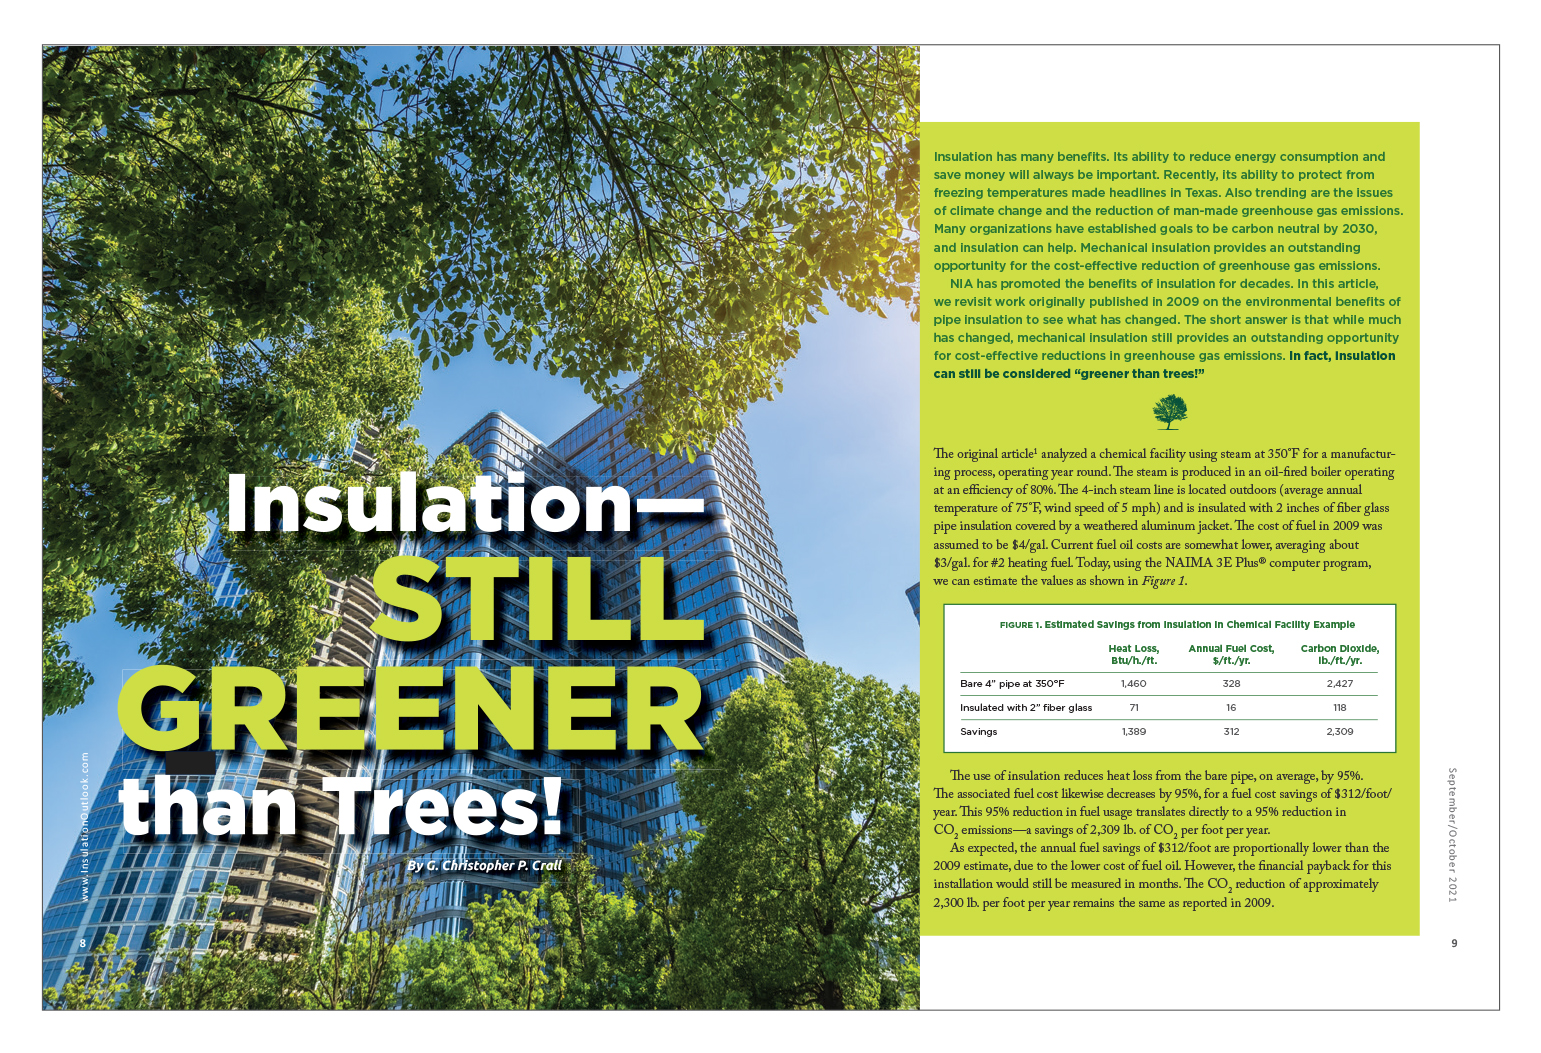
The original article1 analyzed a chemical facility using steam at 350°F for a manufacturing process, operating year round. The steam is produced in an oil-fired boiler operating at an efficiency of 80%. The 4-inch steam line is located outdoors (average annual temperature of 75°F, wind speed of 5 mph) and is insulated with 2 inches of fiber glass pipe insulation covered by a weathered aluminum jacket. The cost of fuel in 2009 was assumed to be $4/gal. Current fuel oil costs are somewhat lower, averaging about $3/gal. for #2 heating fuel. Today, using the NAIMA 3E Plus® computer program, we can estimate the values as shown in Figure 1.
The use of insulation reduces heat loss from the bare pipe, on average, by 95%. The associated fuel cost likewise decreases by 95%, for a fuel cost savings of $312/foot/year. This 95% reduction in fuel usage translates directly to a 95% reduction in CO2 emissions—a savings of 2,309 lb. of CO2 per foot per year.
As expected, the annual fuel savings of $312/foot are proportionally lower than the 2009 estimate, due to the lower cost of fuel oil. However, the financial payback for this installation would still be measured in months. The CO2 reduction of approximately 2,300 lb. per foot per year remains the same as reported in 2009.
Keep in mind that these savings are for 1 linear foot of pipe insulation applied to a bare pipe. We have previously reported estimates that 10–30% of industrial insulation in existing plants is missing or damaged. Considering how many industrial facilities are operating, and the average size of a typical facility, the potential savings are huge!
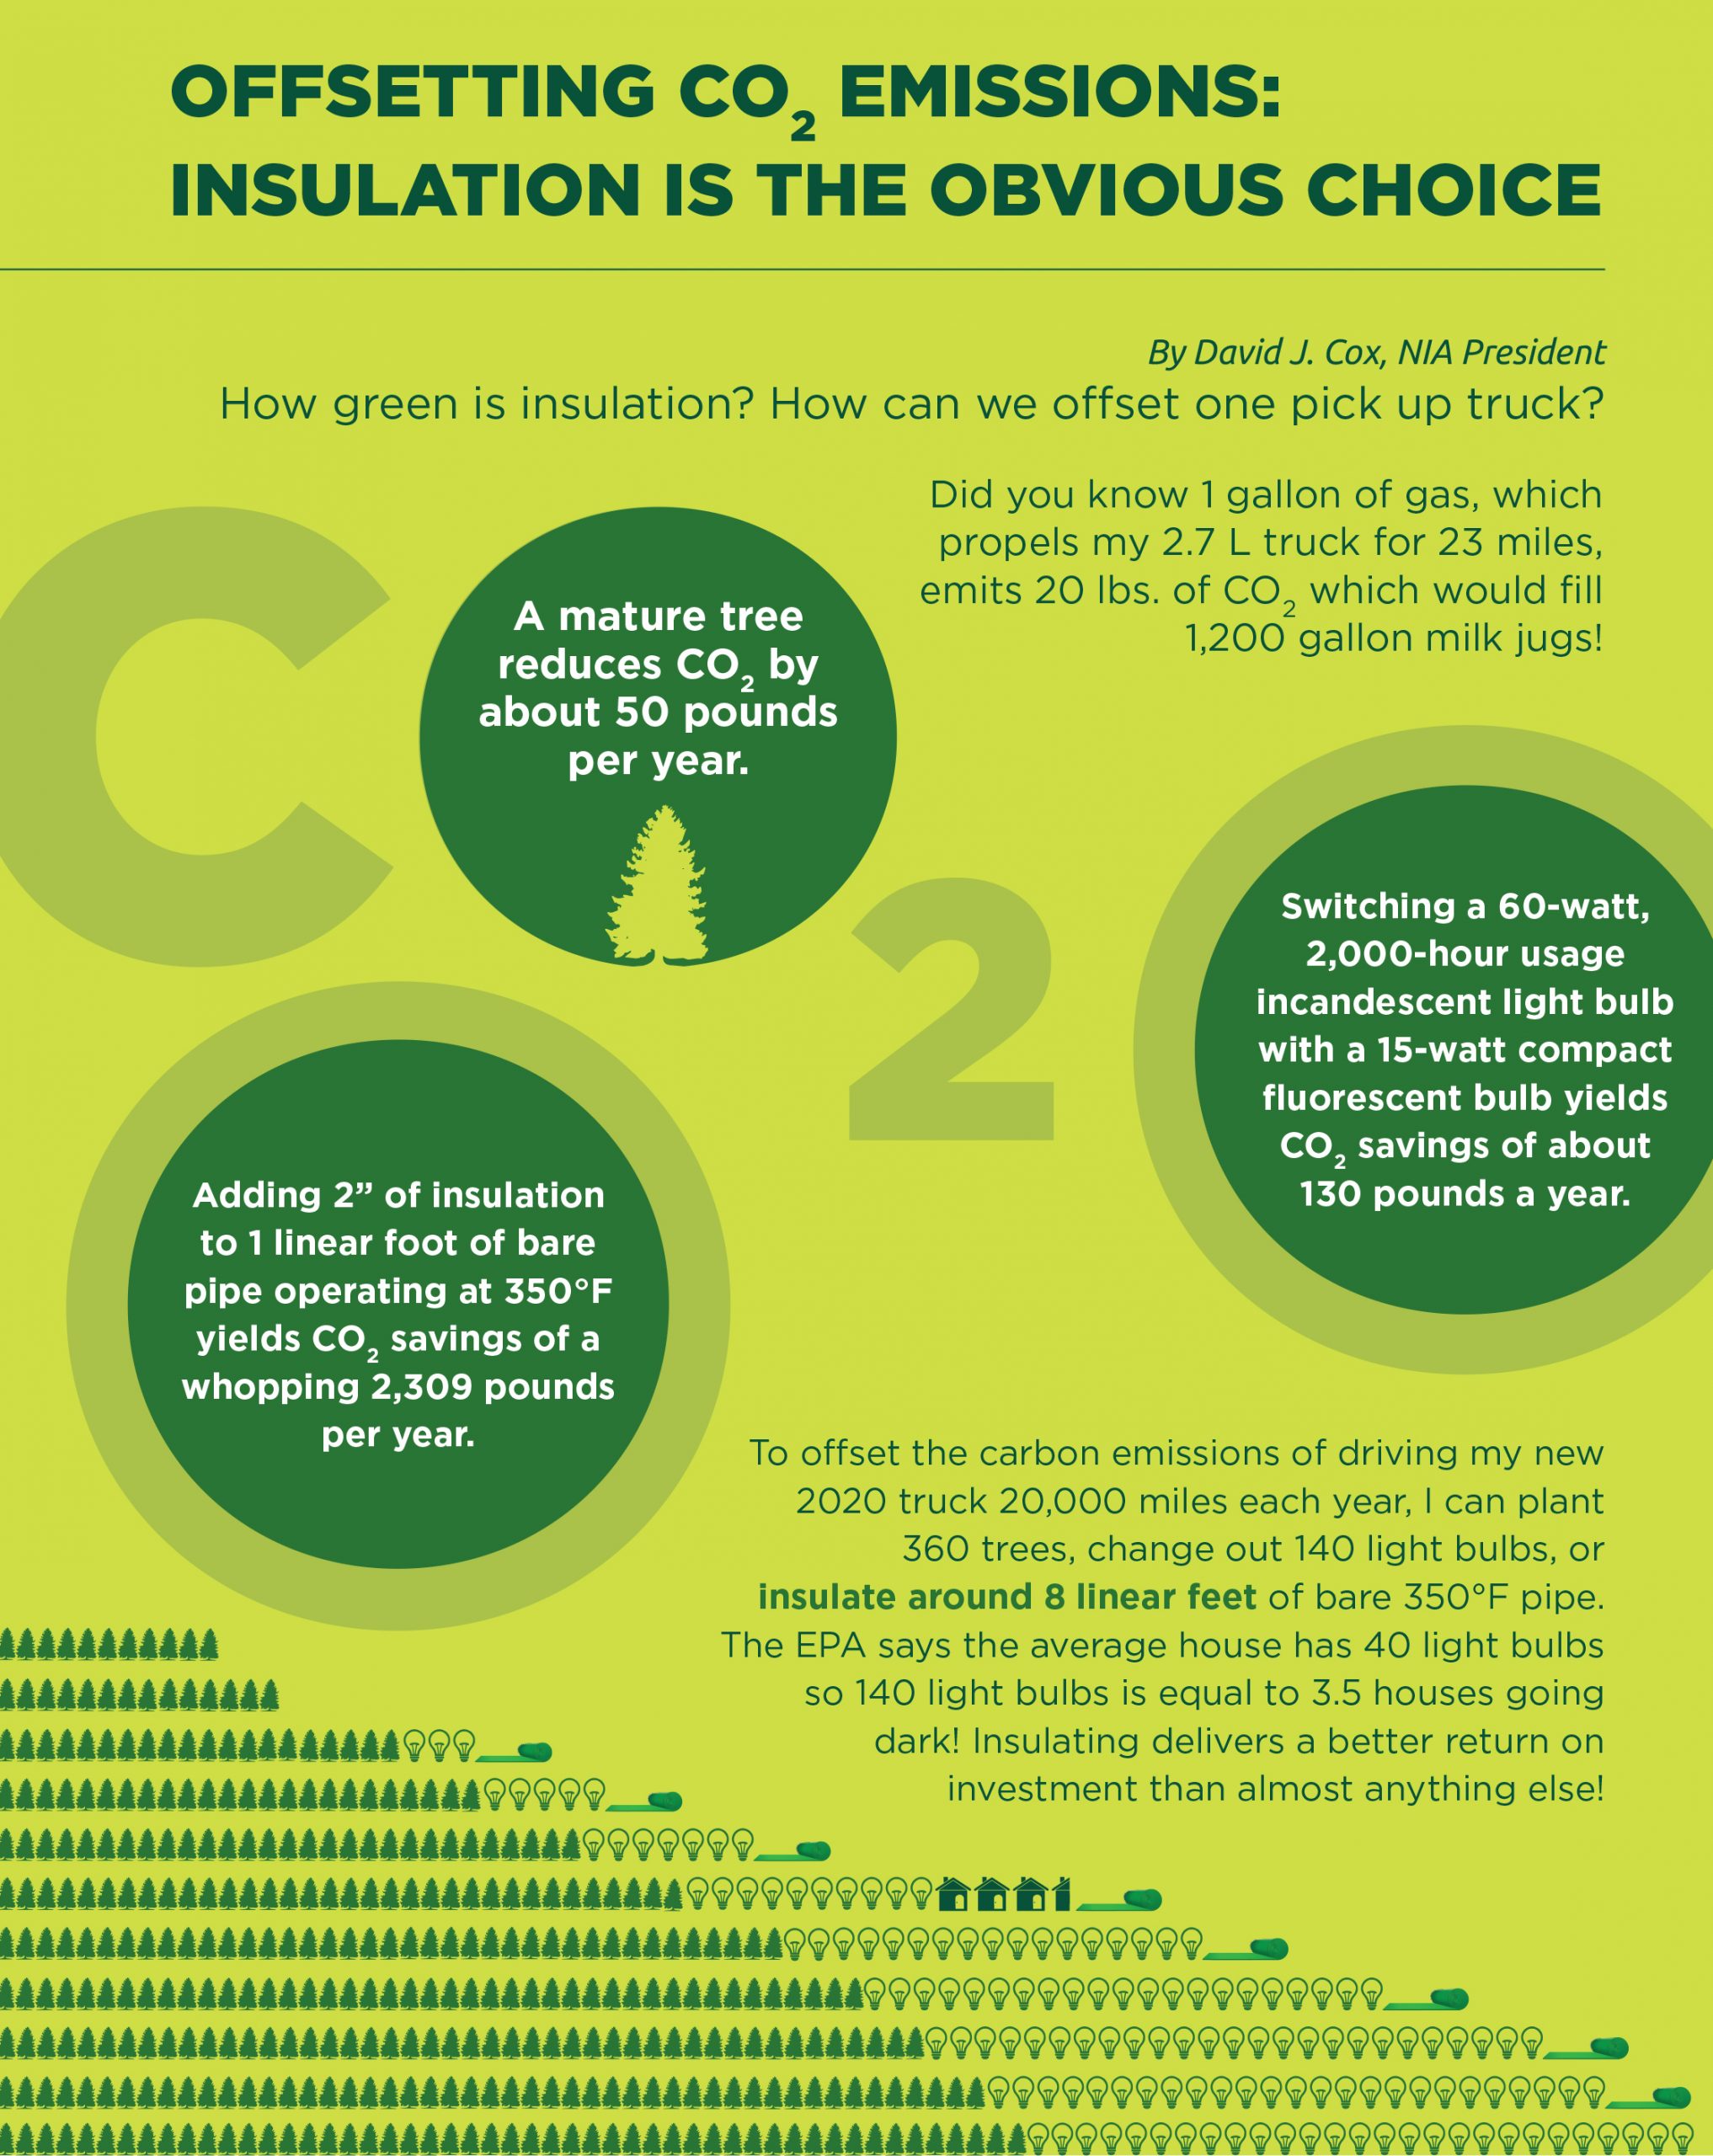
The reduction in CO2 emissions (more than a ton per year per foot of pipe) sounds impressive, but how does it compare to other carbon-reducing strategies?
Trees and the Carbon Cycle
Trees are an important part of the carbon cycle. Trees (and all green plants) utilize photosynthesis to remove and store carbon from the atmosphere, while at the same time releasing oxygen. In fact, trees are considered to be so beneficial that we can purchase carbon offsets associated with reforestation projects. Current online vendors charge approximately $20 per metric ton of CO2 offsets. Proceeds are invested in a variety of reforestation projects.
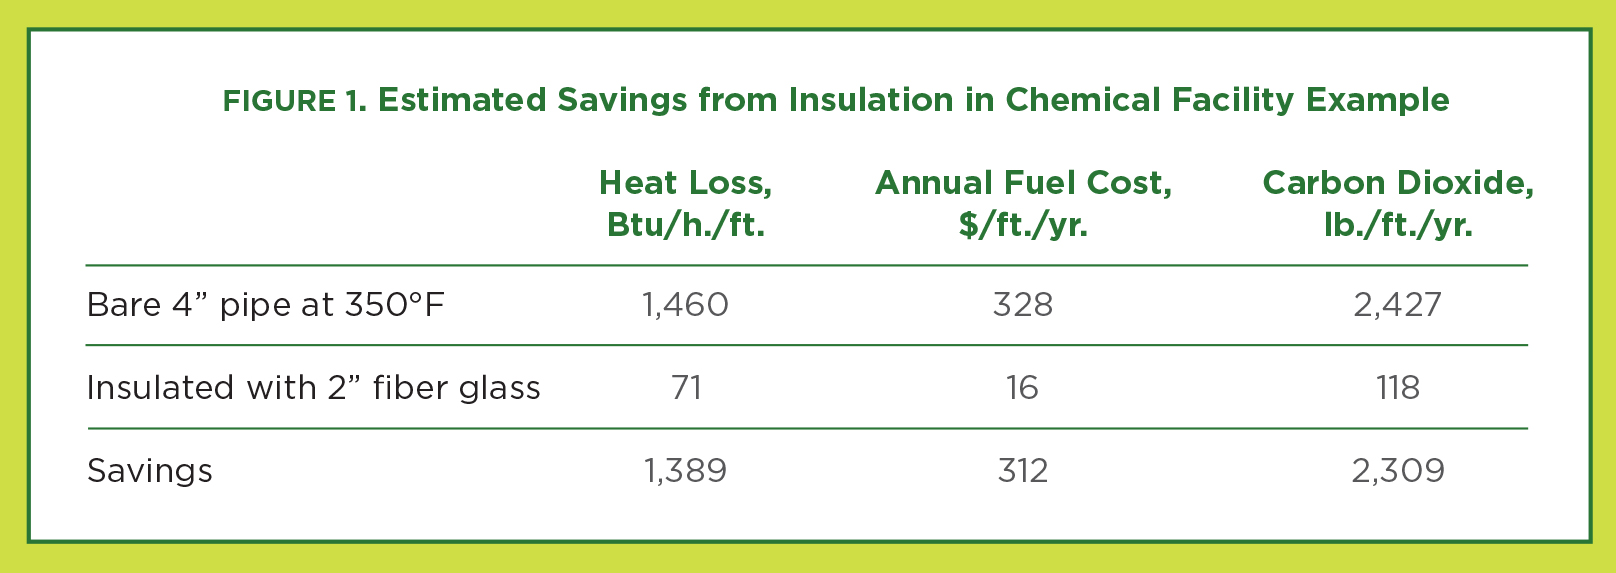
How much CO2 is absorbed by a tree? The answer varies considerably, depending on the type of tree, its location, and its stage in the life cycle. One source2 estimates that a single mature tree can absorb 48 lb. of CO2 per year. Another3 estimates that a 15-year-old, medium growing rate hardwood tree can sequester 16.9 lb. of carbon per year (which translates to 62 lb. of CO2 per year). A third source4 estimates that over a 10-year period, newly planted trees will absorb 36.4 lb. of carbon (equivalent to roughly 13.4 lb. of CO2 per year per tree planted). For the purpose of this article, we will use a rough average of 50 lb. of CO2/year.
Figure 2 shows the simple comparison.
Other Examples
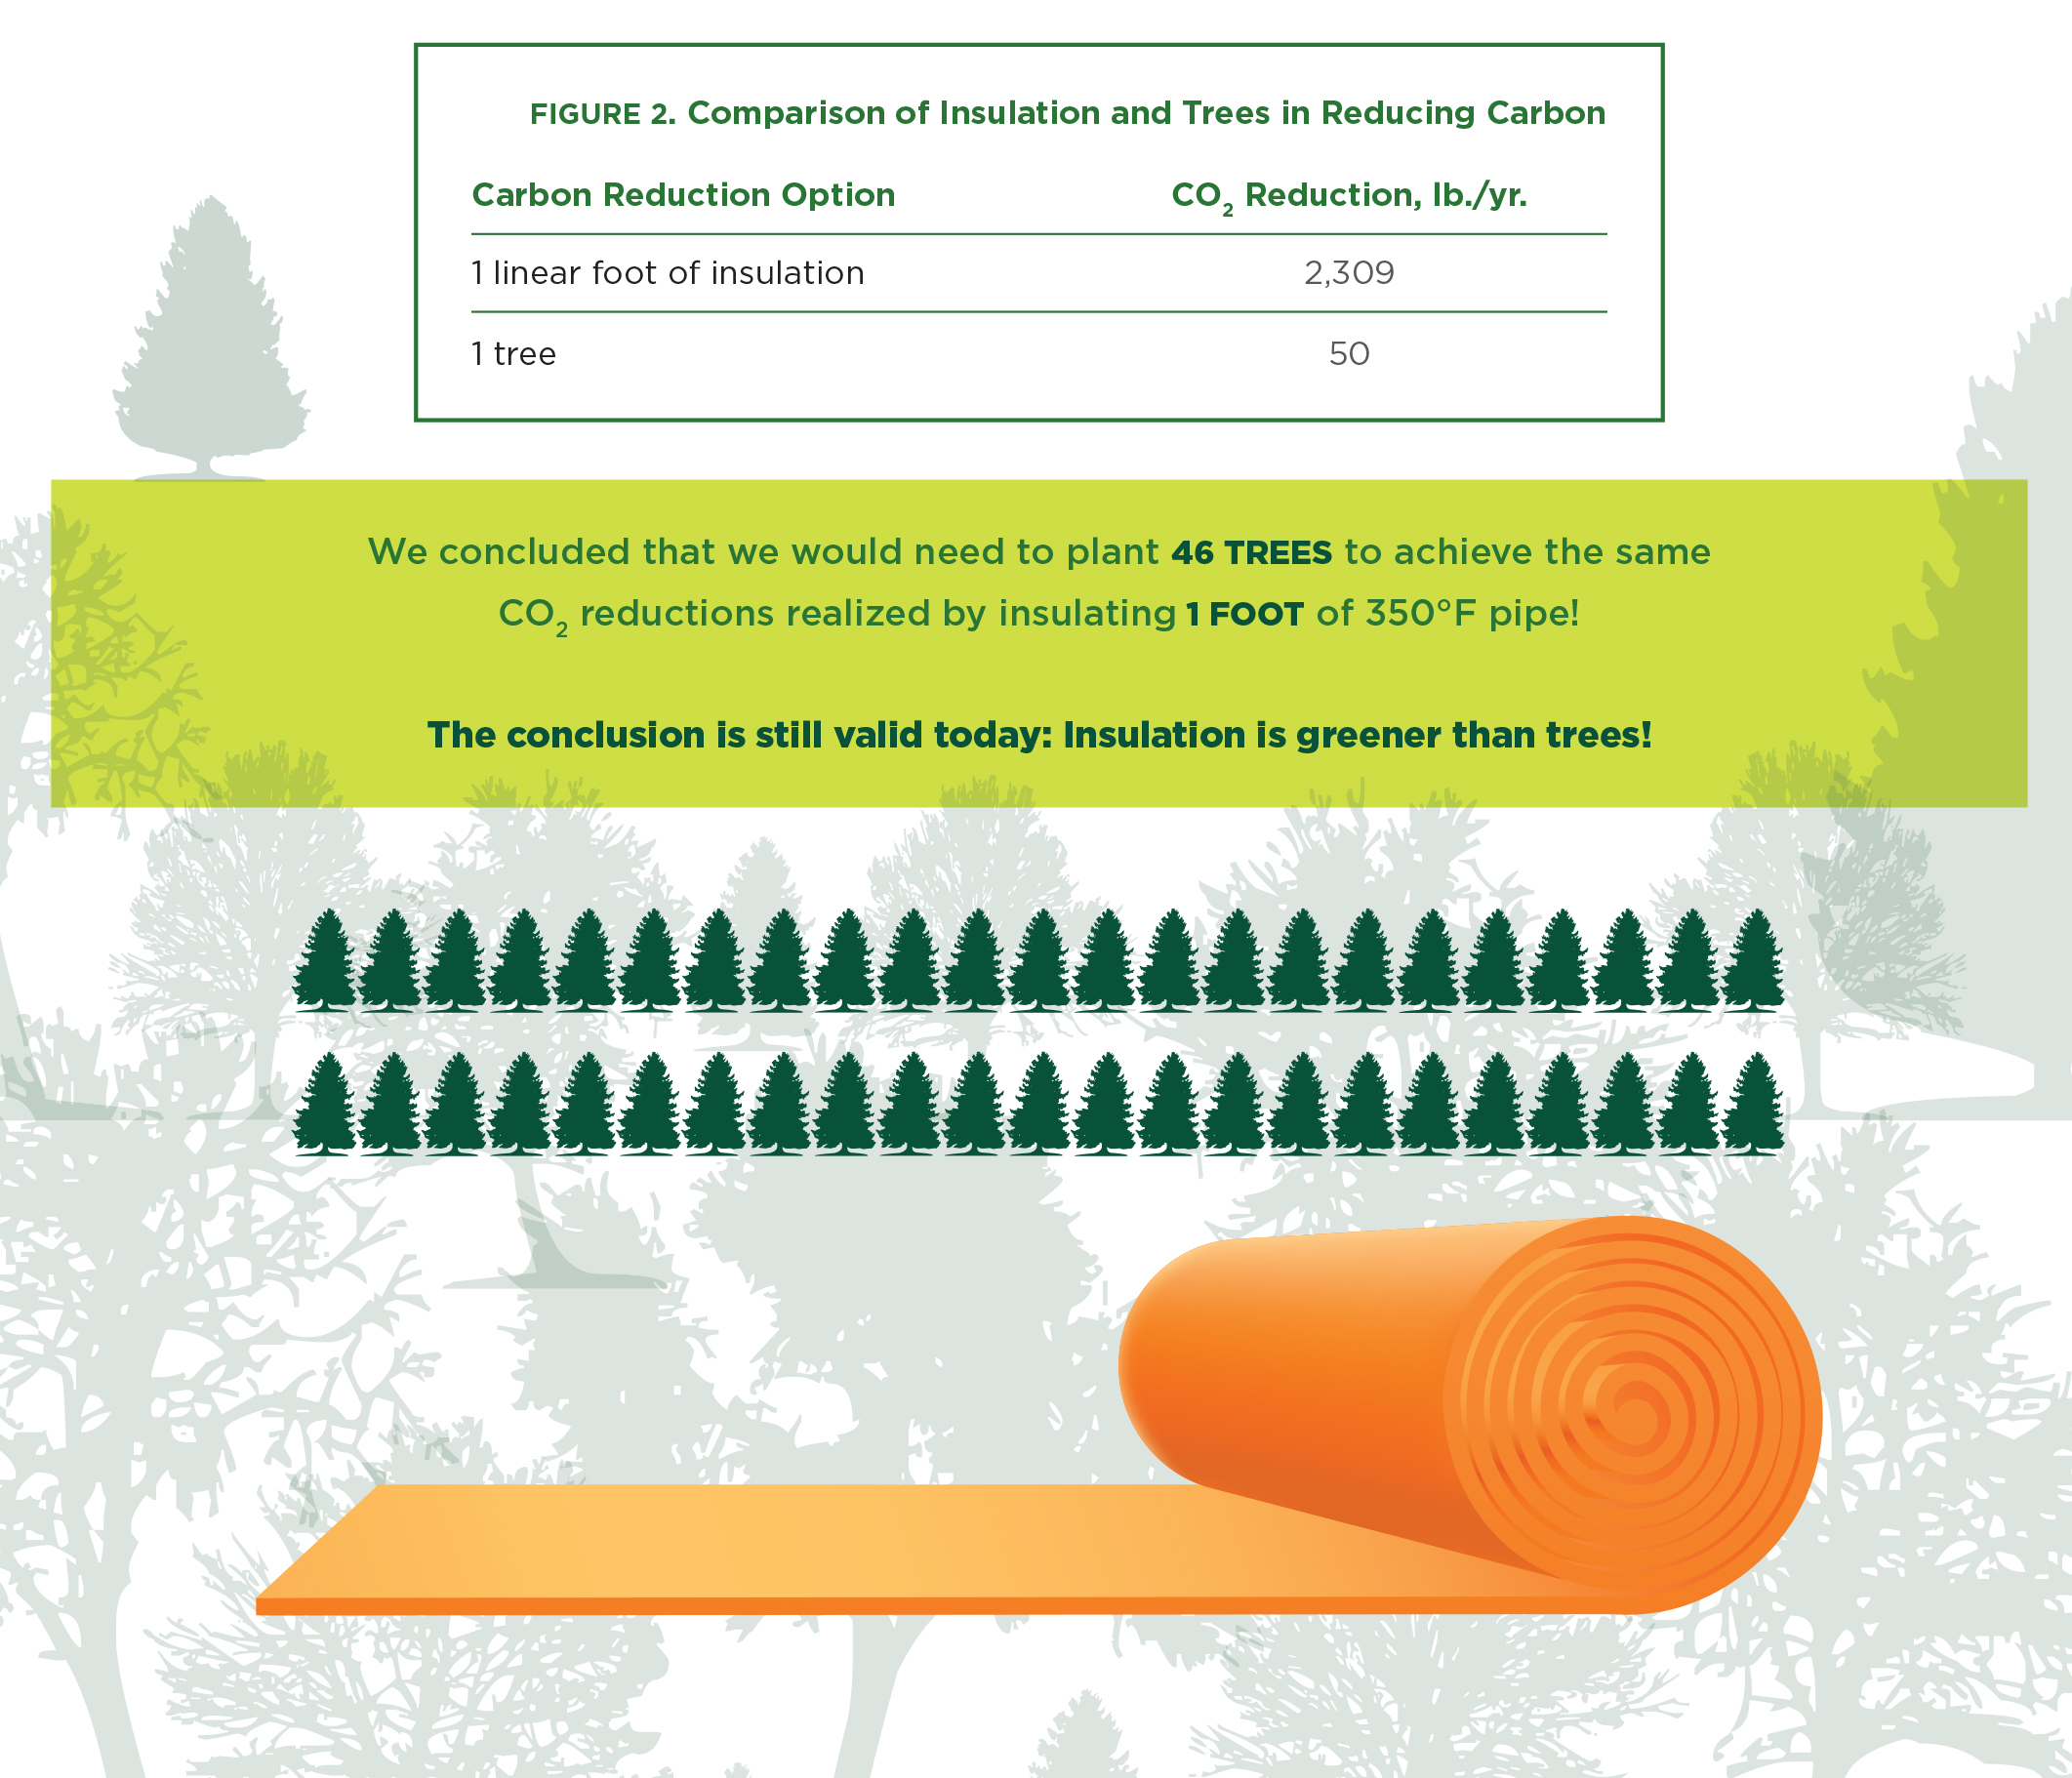
Most pipes are not operating at 350°F. Some operate at higher temperatures, and many are at lower temperatures. Also, many systems do not operate year round. For illustration, consider a hydronic heating system in a commercial building. We will assume an operating temperature of 180°F and a 2” steel pipe with 2” of elastomeric insulation.i The piping is located primarily above the building’s dropped ceiling (average temperature of 75°F, 1 mph wind speed). The system will operate 26 weeks per year. For this application, we assume a natural gas-fired system operating at 75% efficiency, and a fuel cost of $2.50/Mcf for natural gas. Using NAIMA’s 3E Plus software, we estimate the values shown in Figure 3.
(i Note that the current ASHRAE Standard 90.1-2019 requires 2” of insulation for this application.)
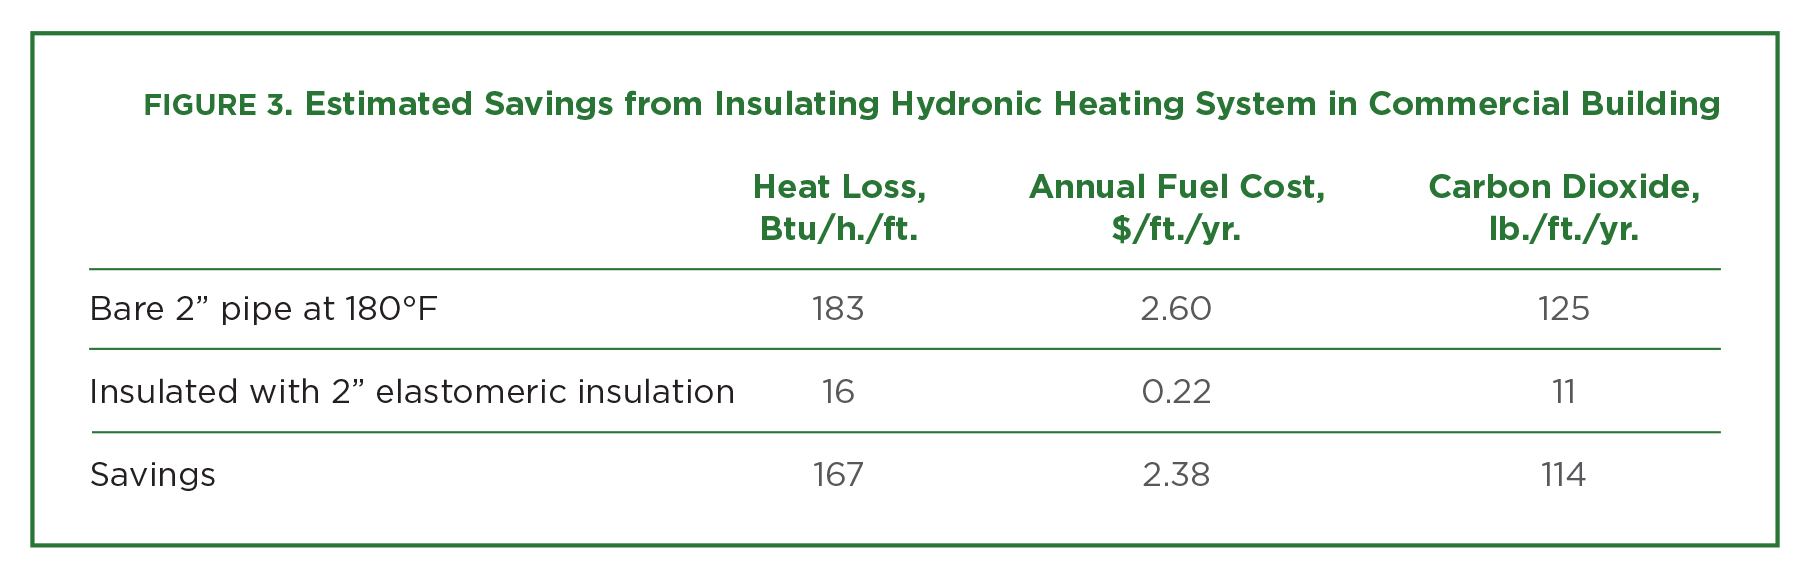
In this example, the heat loss is reduced by 91%, and the corresponding CO2 emissions are reduced by 114 lb./foot/year. So, we would need to plant slightly over two trees to achieve roughly the same CO2 reduction as insulating 1 foot of these hot water pipes.
What about cold piping? Since 2009, chiller systems have increased in efficiency, and chilled water temperatures have generally gone down. Assume a 4” chilled water line operating at 38°F and insulated (per the requirements of ASHRAE Standard 90.1-2019) with 1” of cellular glass insulation. Assume that cooling is provided by electric chillers with a coefficient of performance of 4 (typical of a modern air-cooled system). We will also assume that the system is a high-usage application that operates 95% of the time. The marginal cost of electricity is $0.10/kWh. The results of the 3E Plus analysis of this scenario appear in Figure 4.
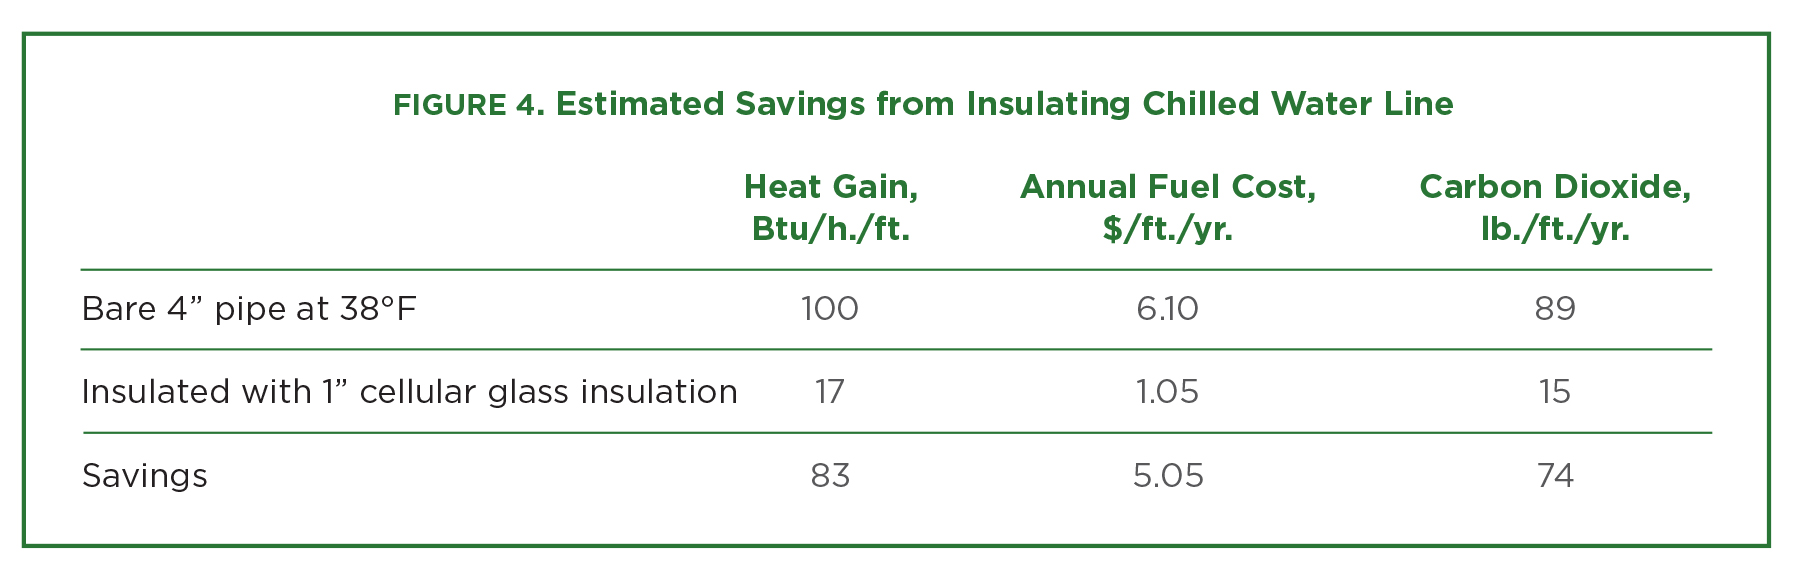
For this example, the 1” insulation reduces the heat gain by 83% and saves 74 lb. of CO2 per foot per year. We would need to plant 1½ trees to achieve roughly the same annual reduction realized by 1 foot of pipe insulation.
This discussion has not considered the longer-term implications of forests and the carbon cycle. Most researchers consider mature forests to be carbon neutral, in that they contain some vegetation that is young and still growing (i.e., absorbing CO2 from the atmosphere and storing carbon), which is balanced by vegetation that has died and is decaying
(i.e., giving up CO2 to the atmosphere or the soil). While established forests serve as a significant storehouse for carbon, any carbon stored in trees is eventually returned to the environment.
This article should not be interpreted as an argument against planting trees, restoring forests, or maintaining existing forests. Trees provide many useful benefits. They provide shade in the summer, shelter for wildlife, and many of our most important building materials; and they are much more pleasing to look at than a piece of insulation. As a method for controlling greenhouse gases, insulation is greener than trees.
What about other carbon-reduction technologies? How does insulation stack up compared to other methods currently being discussed?
Other Carbon-Reducing Technologies
There are many approaches to reducing carbon emissions, and the feasibility, cost, and effectiveness of these approaches are the subjects of considerable current debate.
Power Plants. The electric power industry is the largest emitter of man-made CO2, accounting for about 31% of the annual CO2 emissions worldwide.5 Replacing fossil fuel-fired generating plants with solar-, wind-, or nuclear-powered generation is one approach to reduce greenhouse gas emissions. In 2019, in the United States, there were 248 operating coal-fired power stations with installed capacity ranging from 5 to 3,653 MW.6 CO2 emissions from coal-fired plants average about 2.21 lb. per kWh generated.7 A typical coal-fired plant in the United States has a capacity of 300 MW and operates about 50% of the time. Mothballing this typical coal-fired plant would reduce CO2 emissions by about 2.9 billion lb. of CO2 per year. Obviously, this is a huge number that would require a large construction project to achieve. Note, too, that it would require roughly 300 typical wind turbines to replace the mothballed generating capacity.
Commercial Boilers. Another, somewhat smaller, carbon-reducing project could involve replacing a natural gas-fired boiler in a commercial building with a solar-thermal heating system. A typical boiler size for a commercial facility is 100 boiler horsepower. If this boiler operated 7 months per year, at a usage factor of 50%, it would burn approximately 10,700 MCF of natural gas per year. Replacing this boiler system would reduce CO2 emissions by about 1.3 million lb. of CO2 per year.
Vehicles. Transportation accounts for approximately 15% of greenhouse gas emissions worldwide.8 In the United States, the average passenger vehicle travels roughly 12,000 miles per year and emits about 0.88 lb. of CO2 per mile traveled.9 If that vehicle was replaced with a non-emitting form of transportation, CO2 emissions would be reduced by 10,500 lb. per year.
LED Light bulbs. On the other end of the size scale are LED light bulbs. Over the past decade, traditional incandescent lighting has been largely replaced by more efficient LED lighting. A typical replacement LED can produce the same light as an incandescent bulb with only 20% of the power usage. Replacing a 43 W incandescent bulb with an LED that operates 3 hours per day would reduce electrical consumption by 101 kWh/yr. and associated CO2 emissions by about 58 lb. per year.10
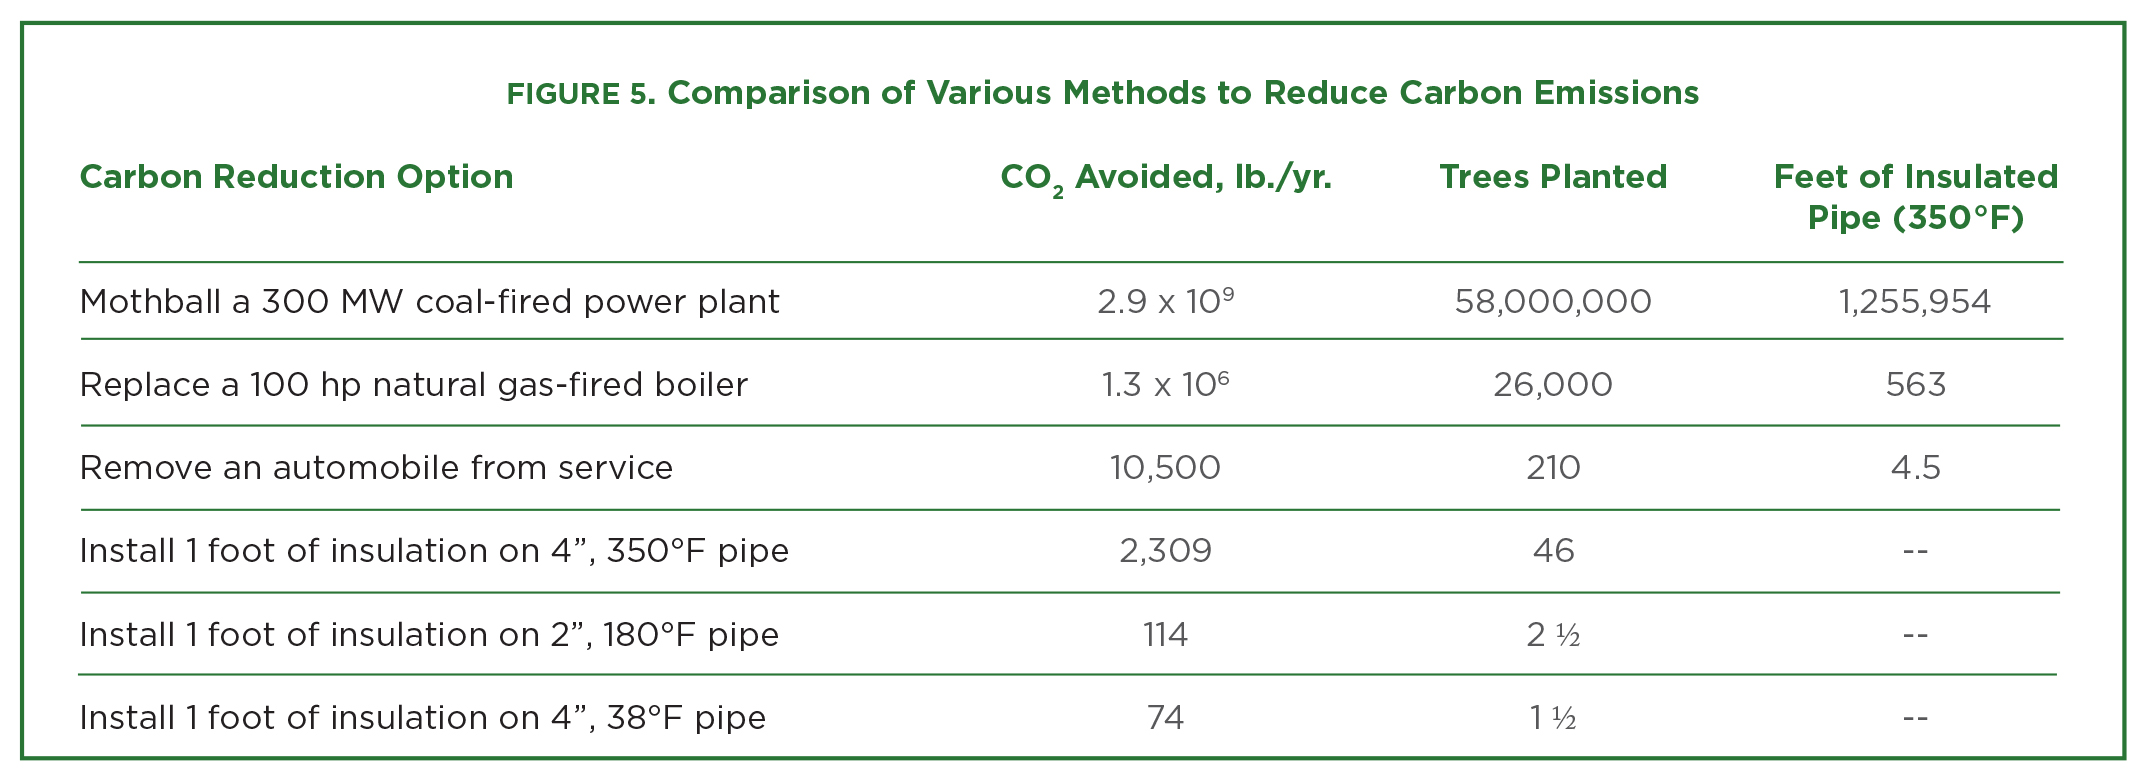
For comparison purposes, these results are summarized in Figure 5.
Carbon Offsets
As governments, companies, and individuals continue to seek ways to reduce their carbon footprints, interest in carbon offsets continues to grow. A carbon offset (or carbon credit) is a transferable instrument certified by government or independent bodies to represent an emission reduction. Many individuals or organizations purchase carbon credits to offset their carbon emissions. The proceeds from the sale of these carbon credits are invested in various carbon reduction projects. Example projects include reforestation, renewable energy development, or methane capture and destruction.
Mechanical insulation should be a leading candidate when considering carbon offset projects. This, to date, has not happened. The reasons are not totally clear, but probably involve a number of issues.
It is generally understood that certifiable offset projects must be: 1) additional, 2) permanent, 3) quantifiable, 4) never double-counted or double-sold, and 5) verifiable. For an insulation project, the “additional” criterion is problematic. To be considered “additional,” a project needs to demonstrate emission reductions that go beyond “business as usual.” If the reductions would have happened anyway —i.e., without the prospect of credits—they are not considered additional.
In most cases, the use of mechanical insulation would be considered “business as usual.” In many commercial projects, insulation levels are dictated by local building codes. In other cases, insulation levels are specified in an attempt to minimize life-cycle costs (i.e., the economic thickness of insulation). Most insulation projects pay for themselves in energy savings. Thus, these projects would not be considered “additional” by a certifying authority.
The exception would be in those cases where a project could utilize insulation levels that went beyond code requirements or economic thickness to capture additional emission reductions. In these cases, the reductions could be considered “additional,” and could be available for carbon offsets.
As the market for carbon credits matures and the cost of carbon offsets increases, it will be
interesting to see if mechanical insulation projects can become a viable alternative to reforestation, renewable energy development, and methane capture projects. Mechanical insulation is a well-developed energy-conserving technology that is, in fact, greener than trees!
References
1. Crall, C.P., “Insulation: Greener than Trees,” Insulation Outlook, January 2009.
2. www.arborday.org
3. U.S. Department of Energy, Energy Information Administration, “Method for Calculating Carbon Sequestration by Trees in Urban and Suburban Settings,” April 1998.
4. www.epa.gov/energy/greenhouse-gases-equivalencies-calculator-calculations-and-references
5. www.c2es.org/content/international-emissions
6. www.en.wiki/List of Coal Fired Power Stations in the United States
7. www.eia.gov/tools/faqs
8. www.c2es.org/content/international-emissions
9. www.epa.gov/energy/greenhouse-gases-equivalencies-calculator-calculations-and-references
10. Ibid.