Mechanical Insulation in Hospitals and Schools
There are approximately 5 million commercial buildings (80 billion square feet1) consuming approximately 18 percent of all primary energy used in the United States. Energy usage in commercial buildings varies by size and by building activity.
A recent study undertaken by the National Insulation Association (NIA) as part of the Mechanical Insulation Education and Awareness Campaign focused on quantifying the use of mechanical insulation in two commercial building types: hospitals and schools. It found that mechanical insulation is used extensively in these types of commercial buildings.
The study’s approach was to contact NIA insulation contractor members to request insulation specifications and quantity take-offs for recent hospital and school projects. Using this data, insulation energy assessments were performed to estimate the energy savings due to mechanical insulation. The projects were selected to represent the range of climates reflected in DOE Climate Zones 1-7 (Figure 1). For details about the study methodology, see the sidebar to this article.
While the vast majority of mechanical insulation applications in commercial buildings are indoors (not exposed to weather), the climate zone location does impact the type of HVAC equipment used and its run time. Building locations across the range of climate zones were therefore of interest.
Obtaining data on suitable projects proved more difficult than anticipated. Many of the projects submitted involved renovations or small additions rather than new construction. For this and a variety of other reasons, the quantities of projects hoped for were not achieved in every climate zone, but the 14 buildings that were selected, 9 hospitals and 5 schools, are thought to be representative of the range of climates in the United States.
A total of 14 projects were analyzed as part of this study (5 schools and 9 hospitals). The locations and general characteristics of the buildings are summarized in Figure 2.
While most of the hospital projects were additions or expansions of existing facilities, the nature of the projects allowed them to be treated as stand-alone facilities for analysis purposes.
The study found that a significant quantity of mechanical insulation is being used in hospitals and schools. Figure 3 summarizes the quantities of pipe and duct insulation in each of the 14 facilities analyzed.
Insulation Quantities in Schools
All the school projects included insulation on domestic hot water (DHW) piping. The total lengths of DHW piping ranged from 1,200 linear ft to 7,800 linear ft (1½ mi.). Within each of the facilities, size and thickness of insulation varied as well. All the facilities contained significant percentages of ½ in. and ¾ in. DHW piping with 1-in.-thick insulation (typically used for drops and run-outs to fixtures and for recirculation lines). The largest DHW lines in schools were 3 in. insulated with 1½-in.-thick insulation. On average, the schools analyzed contained about 0.022 linear ft of DHW piping per square foot of floor space.
Insulation quantities for the HVAC systems, as expected, depended on the HVAC systems used. Piping for hydronic heating water (HHW) systems was present in three of the five schools. Hydronic piping is commonly used to supply heating coils in air handling units and terminal boxes and for perimeter heating. The three schools that had HHW piping averaged about 0.032 linear ft per square foot of floor space.
Chilled water piping was identified in three of the five schools and averaged about 0.012 linear ft per square foot of building area. Sizes ranged from 1 in. up to 14 in. Note that two of the schools used water loop heat pumps for heating and cooling (no chilled water piping was present).
All the schools had insulated supply-air ductwork (averaging about 0.47 ft2 of duct surface per square foot of floor area). Current energy codes and standards do not require insulation for supply-air ducts in conditioned (or indirectly conditioned) spaces. Condensation control and/or noise control are likely the design objectives for these systems.
Four of the five schools had insulated return-air ductwork as well. Note that energy codes and standards do not typically require insulation on return-air ductwork within the building envelope, but acoustical considerations are important in classrooms.
Insulation Quantities in Hospitals
Mechanical insulation quantities are greater in hospitals than in schools because on average, hospitals are larger and contain more energy-intensive systems than schools. Additionally, mechanical insulation has a larger energy impact because most hospitals operate 24 hours per day year round.
Insulated DHW piping in hospitals is extensive. Quantities ranged from 9,700 linear ft to over 50,000 linear ft (9.5 mi.). Piping sizes ranged up to 4 in. The hospitals averaged about 0.069 linear ft of DHW piping per square foot of floor space.
HHW piping was also identified in all the hospitals analyzed. HHW is used extensively in hospitals to supply air handling units, terminal boxes, and perimeter heat loops. The Phoenix hospital project has 51,000 linear ft of HHW piping (9.7 mi.). Sizes range from ½ in. to 18 in. On average, the hospitals contained about 0.091 linear ft of HHW piping per square foot of building area.
All the hospitals contained a significant amount of steam supply and condensate piping. Hospitals use steam for sterilization, humidification, and laundry facilities. Quantities of steam piping ranged from about 800 linear ft to about 11,000 linear ft. Sizes ranged from ½ in. to 18 in. On average, the hospitals had about 0.015 ft of steam piping per square foot of floor area.
Chilled water piping was present in all hospitals as well and averaged about 0.015 linear ft per square foot of floor area. The Phoenix hospital has roughly 12,600 linear ft (2.4 mi.) of chilled water piping. Chilled water piping sizes range up to 20 in. in diameter.
Large quantities of insulated supply-air ductwork were identified in all the hospitals analyzed. Quantities ranged from 39,000 ft2 to 410,000 ft2 and averaged about 0.52 ft2 of supply-air ductwork per square foot of floor area.
Insulated return-air ductwork was present in six of the nine hospitals analyzed and averaged 0.15 ft2 of duct surface area per square foot of floor area.
Energy Impact of Mechanical Insulation
Estimates of the energy savings attributable to mechanical insulation are summarized in Figure 4. These energy savings are all estimated relative to a baseline case of no insulation (the bare case). The savings are shown in several different ways: absolute site energy savings in billions of Btu/yr, savings normalized to the gross floor area of the project (kBtu/sf), and savings normalized to the projected annual Site Energy Usage of the building (in percentages).
As discussed earlier, most of the projects analyzed were either recently completed or under construction. Actual energy consumption data was not available for most of these buildings. The site energy usage values were therefore projected using the DOE Commercial Building Benchmark Models as a point of comparison.
As indicated in Figure 4, the savings due to mechanical insulation vary greatly. The largest savings are for the hospital in Los Angeles (85 billion Btu/yr), while the smallest savings are in the elementary school in Sunrise, Florida (0.28 billion Btu/yr). The ratio of high to low is roughly 300 to 1. Normalized to building area, the savings range from roughly 200 kBtu/sf to 2 kBtu/sf (a ratio of 100 to 1).
The primary reason for the large variation is the difference in building function and systems. Hospitals are typically large facilities with many energy-intensive systems that operate continuously. Schools are generally smaller with fewer energy-intensive systems that operate only 5 days a week for 9 months per year.
To illustrate, Figure 5 contrasts the take-off quantities for the Los Angeles hospital with the quantities for the elementary school in Florida.
Based on differences in quantities alone, it is obvious that the mechanical insulation systems in the large hospital will result in significantly more energy savings than those in the elementary school. Additionally, most of the systems in the hospital will operate 8,760 hours per year, compared to roughly 2,300 hours per year for the school.
Figure 4 also shows that the variation in savings within the two categories of buildings is less but still significant. For the schools, energy savings ranged from 10 billion Btu/yr to 0.28 billion Btu/yr (a range of about 40 to 1). Normalized to floor area, the variation is still roughly 12 to 1 (from 27 to 2.3 kBtu/sf/yr). Again, this variation is explained by the differences in the systems installed. Within the hospital category, the estimated savings due to mechanical insulation ranged from a high of 85 billion Btu/yr to a low of 17 billion Btu/yr. This is a 5 to 1 variation. Normalizing to floor area reduces this variation to about 2 to 1 (194 kBtu/sf/yr to 89 kBtu/sf/yr). The average energy savings for the nine hospitals in this study was 149 kBtu/sf/yr.
These energy savings are large. Expressed as a percentage of the total projected energy usage of the building, they range from 4 percent to 101 percent.
In reality, that doubling of energy consumption could but probably would not occur because the boiler capacity would be exceeded (boilers would be running flat out trying to replace the heat lost from over 15 mi. of uninsulated steam and hot water lines), while at the same time the chiller capacity would be exceeded (trying to satisfy the increased cooling load caused by over 15 mi. of uninsulated hot lines). Temperature control in the patient spaces would be lost, and the patients would need to be moved to another hospital because the thermal conditions inside would be unacceptable. The hospital would be shut down until the system could be repaired, so the energy usage would not double.
These results illustrate the critical nature of mechanical insulation for the efficient operation of the energy distribution systems in many commercial buildings. Without insulation, extensive steam, hot water, and chilled water distribution systems would be impractical.
Comparisons to ASHRAE 90.1
The study also investigated how the mechanical insulation levels in these buildings compare to levels required by ASHRAE Standard 90.1. ASHRAE 90.1-2010, which was recently published, contains more stringent requirements for insulation on above-ambient piping than previous versions. The requirements for cold piping and for ductwork are unchanged from earlier versions of the standard. Figure 6 shows the history of thickness requirements for selected sizes of piping. The requirements had remained essentially unchanged since the 1989 version of the standard.
The data from the study provides an opportunity to address two questions:
- How do the insulation levels being installed in real buildings compare to the levels required by ASHRAE 90.1?
- What is the likely impact of the increase in stringency for the above-ambient piping?
Figure 7 compares the estimated energy savings for the 14 buildings with the savings that would be expected if the insulation requirements of ASHRAE 90.1 had been strictly followed. Savings were calculated for three cases:
- using insulation levels as specified for the project (labeled “As Built” in the table)
- using the insulation thickness requirements in ASHRAE 90.1-2007 (labeled ASHRAE–2007)2
- using the insulation thickness requirements in ASHRAE 90.1–2010.
As before, the savings are expressed as billions of Btu/yr (relative to the bare case). The last two columns compute the differences between the cases expressed as a percent of the projected annual site energy usage.
Taking the Harvard, Illinois, elementary school as an example, the as-built savings are estimated at 1.27 billion Btu/yr. If the piping and ductwork in the school had been insulated in strict compliance with ASHRAE 90.1–2007, the energy savings would be 1.25 billion Btu/yr. Overall, the school building exceeds the requirements of 90.1–2007. If the piping and ductwork had been insulated in strict compliance with ASHRAE 90.1–2010, the estimated savings would be 1.30 billion Btu/yr. The incremental energy savings (As Built–2010) is 0.03 billion Btu/yr, or about 0.6 percent of the projected annual site usage of this school.
Comparing the as-built savings with the ASHRAE standard, all 14 of the buildings (100 percent) exceed the 2007 standard. In addition, four of the five schools (80 percent) exceed the 2010 standard. For the hospitals, only one of the nine facilities (11 percent) exceeds the 2010 standard. Additional savings ranging from 0.1 percent to 2.6 percent are estimated for the eight other hospitals if they were compliant with the 2010 standard.
Comparing the two versions of the ASHRAE 90.1, we see that the incremental savings expected for the 2010 version over the 2007 version range from 0.1 percent to 3.4 percent. The average savings are 0.7 percent for these schools and 2.1 percent for these hospitals.
Four of the five schools exceed the requirements of the 2010 standard as well. For hospitals, only one of the nine hospitals exceed the 2010 requirements, and additional energy savings ranging from 0.1 percent to 2.6 percent could accrue if the other eight complied with ASHRAE 90.1–2010.
Conclusion
For the schools studied, it is estimated that mechanical insulation saves, on average, 13 kBtu/sf/yr of site energy (about 20 percent of the total usage). For hospitals, the energy savings from mechanical insulation are estimated to average about 149 kBtu/sf/yr (roughly 78 percent of the total site energy usage). These large numbers highlight the importance of mechanical insulation in commercial buildings. In fact, it can be argued that some of the energy distribution systems in commercial buildings could not function without mechanical insulation because distribution losses would become excessive. The importance of properly maintaining the insulation on these distribution systems is evident.
Notes
1. U.S. Department of Energy, 2009 Buildings Energy Data Book.
2. Note that ASHRAE 90.1-2007 is used as a base for this discussion. Since the requirements for mechanical insulation are unchanged from the 1999 version through 2007, comparisons hold for those earlier versions as well.
Acknowledgements
The authors would like to thank the participating contractors for their assistance during the study.
 Figure 1
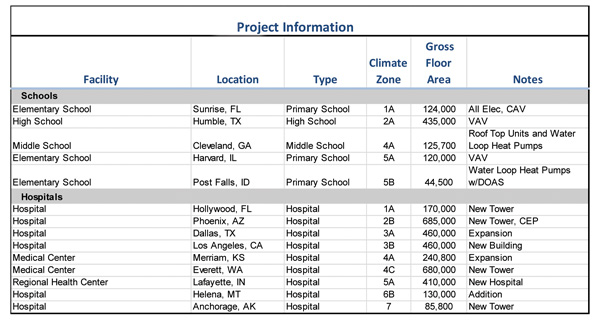 Figure 2
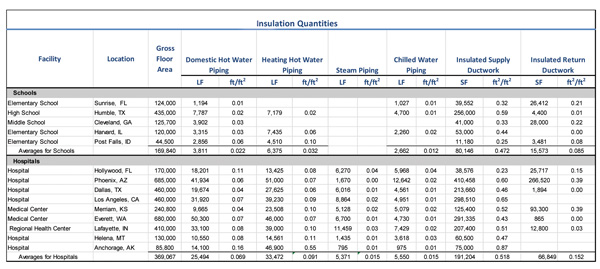 Figure 3
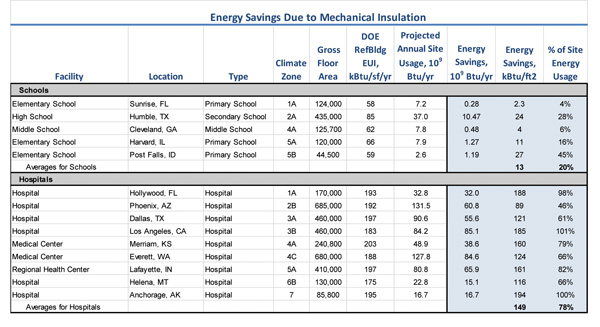 Figure 4
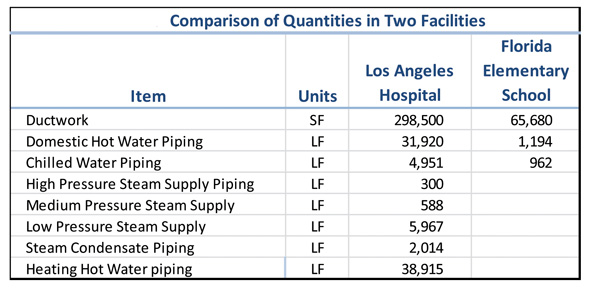 Figure 5
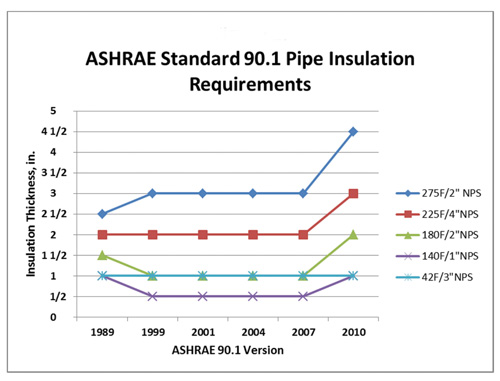 Figure 6
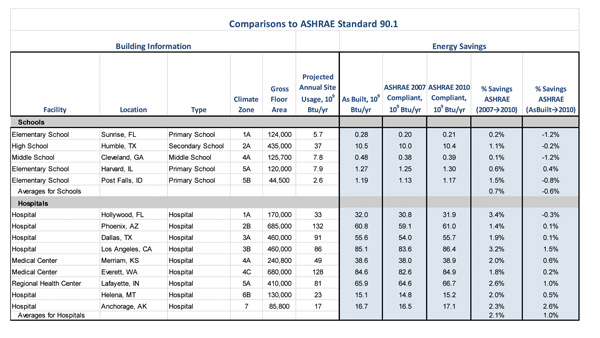 Figure 7