Profiling Corrosion Under Insulation
One of the greatest risks at any industrial facility is the unanticipated failure of process piping. Almost all piping is susceptible to internal and/or external degradation; however, piping exposed to a marine environment or subjected to water or chemical spray has a higher probability of corroding much faster. Insulated piping is susceptible to external corrosion because the insulation may become wet, accelerating the corrosion of the pipe while hiding the corrosion from detection. Most plants will remove the insulation from obviously damaged areas to see if the pipe is corroding. In many cases, the pipe appears to be in good condition. The problem is that water will seek the lowest level possible and, usually, the lowest level of the piping run will not coincide with the damaged area. Therefore, a false confidence is achieved when the piping directly underneath damaged insulation is found to be in good condition, while anywhere from a few feet to hundreds of feet away, a corrosion cell is actively destroying the integrity of the pipe, ultimately leading to a leak or catastrophic failure.
Very few nondestructive inspection techniques are available to identify corroded areas on insulated piping. Most of the available techniques involve some removal of insulation to inspect the pipe. In many cases, the removal of insulation shows minimal, if any, corrosion at inspection, but because the insulation was breached, corrosion cells may later occur at or near the locations where the insulation was removed and replaced. The best policy is to avoid disturbing the insulation unless absolutely necessary.
According to statistics published in Keep it Running, Keep it Safe—Process Machinery Safety and Reliability (W. Wong, 2004), the causes of pipework failure ranked in descending order include the following:
- Leakage at flanged joints
- Leakage from corroded pipe (especially under insulation or lagging)
- Leakage at small-bore piping
- Failure at pipe supports
- Leakage at bellows
- Leakage at instruments
- Failure of steam traps
- Modifications
- Wrong materials
- Over-pressure
The second highest failure rate of process piping is corrosion under insulation (CUI). Insulated piping is also the most difficult to inspect with most available technologies today.
The Lixi Profiler is one of the new tools on the market designed to quickly and accurately detect CUI. It can detect almost any anomaly in process piping that causes a change in density from one area of pipe to another. The Profiler may be used to inspect insulated piping without insulation removal, including straight runs of pipe, elbows, tees, reducers, weld-neck flanges, and most other piping components.
How the Profiler Works
After calibration using two known thickness values, a Profiler scan will reveal the presence of density variations caused by corrosion, welds, wet insulation, product buildup on the walls of the pipe, and any other indication caused by a change in density (see Figure 2). The Profiler is capable of inspecting all known materials used in pipe fabrication, including carbon steel, stainless steel, cast iron, aluminum, plastic, and PVC. No barricades are required, so this inspection method will not adversely affect any other personnel or craft near the device.
Results of a Profiler inspection are graphically displayed in real time to the operator (see Figures 3 and 4). With a couple days of training and a few weeks of use, most Profiler operators are able to quickly and accurately assess process piping systems. Corrosion or other problems are found in real time, and the pipe may be marked for additional remedial action or monitored for further degradation over time.
In the Sample Report (Figure 5), Gamma Graphics inputs the pipe size and schedule as provided by the client, along with the Lixi Profiler readings. The spreadsheet calculates the wall loss in three ways. The “Less Nom” column is the adjusted Profiler reading minus the nominal wall value. The “Worst Case” column takes into account a mill tolerance of 12.5 percent. The “Divided by 2” column assumes any corrosion is equally distributed on two walls of the pipe. Positive values in the “% Wall Change” column denote more dense areas than expected and usually indicate the presence of wet insulation or debris in the pipe.
Compared to more conventional inspection methods like ultrasonic thickness testing and industrial radiography, the Profiler is capable of collecting much more data in a short period. Typically, on insulated pipe, approximately 20 to 30 radiographs can be taken and about 30 to 50 ultrasonic thickness readings can be taken in a day. In contrast, approximately 150 to more than 300 piping locations may be inspected in a day with the Profiler.
Some of the more recent technologies for pipe inspection, like long-range ultrasonic testing, can be negatively affected by the number of direction changes in a section of pipe, the condition of the pipe where the insulation is removed to place the test collar, and even by wet insulation. Because the Profiler is handheld, simple to use, and not reliant on complicated physics, it can perform in most process environments and provide quick, reliable results.
Real-World Scenarios
At a power station, the Profiler was used to verify the condition of insulated piping during a routine maintenance outage. A particular section of pipe was known to have some erosion and was being monitored on the extradose of an elbow with periodic ultrasonic thickness testing. In a 20-second scan, the Profiler found that the elbow and adjacent piping had actually eroded much more severely than the ultrasonic testing results showed. The insulation was removed, and the elbow was replaced. Inspection of the removed elbow showed a remaining wall thickness of only 0.03 inch; it would probably have failed during start-up of the plant if it had not been located and repaired.
A furnace at a refinery was being cooled down for maintenance. As part of the maintenance routine, a cleaning pig was installed in the serpentine furnace coils and forced through the piping by pressurized air but became lodged in the pipe. Under normal circumstances, all the return elbows in the furnace would have to be removed, the furnace piping cleaned individually, and the return elbows rewelded to the piping. That would mean the refinery furnace would be out of commission for approximately 2 weeks. However, an inspector at the refinery recommended the Profiler for locating the stuck cleaning pig. In a matter of a few hours, the pig was located. Only two return elbows had to be removed, and the pig was forcibly removed with pressurized fluid. The furnace was back in operation within a day.
At a refrigerated warehouse, the Profiler was used to inspect ammonia refrigerant piping. A small section of piping was found to have significant corrosion. A maintenance person remarked that the section of pipe in question was replaced only 3 years previously and he doubted very much that the pipe had corroded significantly in that time, especially when the rest of the piping system was over 40 years old. The insulation was removed and the corrosion was visually confirmed.
At a West Coast refinery, an inspection crew worked for over a month trying to locate blockage in a feed line with no success. The Profiler was finally tried on the line, and the blockage was located within 20 minutes. Other tests were used to confirm the location of the blockage, and remedial action was taken. Had the Profiler been one of the first inspection methods instead of one of the last, the refinery’s production would not have been diminished for over a month. The Profiler has proved to be an efficient tool in terms of time and cost for finding CUI, identifying changes in pipe schedules in process piping lines, locating wet insulation and ice in insulation, and determining anomalies in process piping systems that could affect production or jeopardize worker safety.
 Figure 1
The Lixi Profiler.
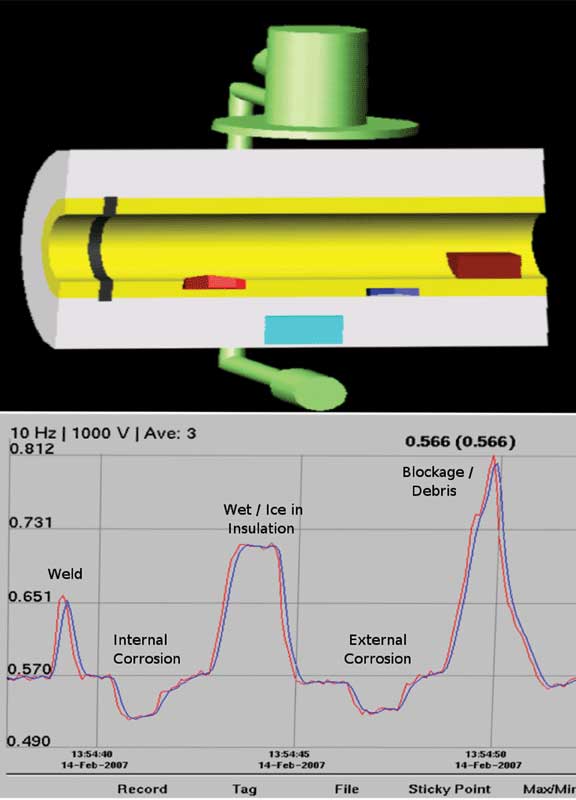 Figure 2
Profiler display of piping anomalies.
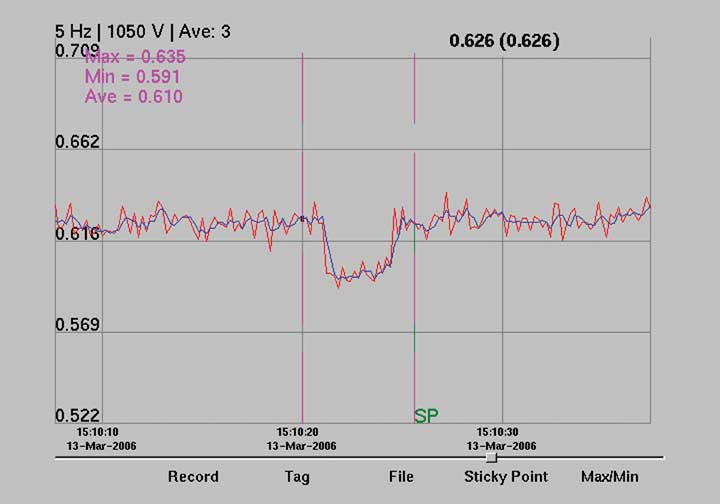 Figure 3
Profiler display of corrosion.
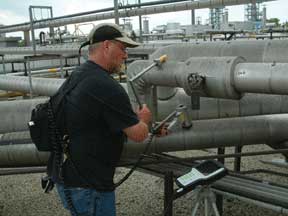 Figure 4
Technician using the Profiler.
 Figure 5
Sample report of Profiler results.