Steam Efficiency Investments-Maximizing Your Investment
Steam efficiency is a major opportunity for manufacturers to boost financial performance in an increasingly competitive environment. An immediate policy challenge is to raise manufacturers’ awareness of these opportunities. A major barrier to accomplishing this is the communications disconnect between plant superintendents and the financial decision-makers who set capital budgeting priorities. Energy engineering literature is rich with technical how-to discussions; the more daunting task is to overcome the perceptual barriers that preclude the approval of these initiatives. This article assumes that strong, financial justification is the key to the full realization of steam efficiency opportunities. That premise is followed by a step-wise review of the ways that steam efficiency can boost a manufacturer’s return on investment.
Background
Steam systems represent significant value in manufacturing facilities. The sheer volume of energy consumed by U.S. manufacturing makes this evident: 16.5 quads of energy are consumed by industry as fuel; 35 percent of that is used to raise steam. Add to that the fuel used by steam systems in institutional, commercial, and military settings, and the total energy required by all steam systems (about 9 quads) represents approximately one tenth of total U.S. energy demand (98 quads). With energy prices in the neighborhood of $5.00 per MMBtu, this adds up to $45 billion for just the fuel cost of raising steam. (Note: one "quad" is one quadrillion British Thermal Units (Btu). Stated differently, one quad is 1015 Btu.)
At the facility level, steam remains a ubiquitous yet underappreciated utility. While steam performs a countless variety of thermal transfer tasks within the majority of manufacturing industries, it’s widely perceived as a "support" utility. In other words, steam is considered a power source subordinate to process lines that are the real focus of manufacturing activity.
Steam system savings potential is within practical reach. One comprehensive study of 66 major steam plants found that 12.3 percent of fuel consumption, totaled over all plants, was avoidable. The payback for these opportunities, overall, equaled 1.7 years. But while this volume of savings was identified, the actual implementation rate of enabling projects represented only 3.9 percent of fuel consumption (i.e., only one third of the opportunities were implemented). An additional point worth noting is that only about half of the opportunities identified required capital investment; the balance required only operational or behavioral changes.
Why do companies forfeit additional earnings? Many companies simply fail to capture the full range of opportunities that occur where financial and engineering priorities intersect. Steam and other energy efficiency proposals may be stalled by a variety of corporate barriers-indifference, technical incompetence, capital budgeting procedures, and investment biases are but a few examples. Financial criteria are paramount-as must be the case for any profit-motivated enterprise. The challenge is for plant superintendents to advance steam plant optimization not simply as engineering projects, but as effective contributions to financial performance.
Impacting Business Through Steam Efficiency
The actions which provide steam efficiency are training, proper technology selection, adequate maintenance, and disciplined monitoring of fuel and other system inputs. Data describing plant operations provides a window on system performance. Because of system optimization, anomalies are more often detected before they become failures that shut down the plant or injure employees. As downtime is reduced, so too is the need to run overtime shifts to "catch up" to production targets. Combustion emissions decline proportionately with fuel consumption. In addition, optimized plant equipment increases productivity. When thermal losses are contained, a greater portion of boiler capacity can be directed to productive functions, enabling the plant to extend production runs or perhaps even begin new product lines.
Return on Investment
Global competition and decentralized corporate structures provide formidable challenges for manufacturing industries. Cost control is especially important for producers of bulk chemicals, grains, oils, paper, and other commodity products, which cannot be easily differentiated from competitors’ output. Decentralized corporate structures give rise to virtually independent profit centers within a corporation. This fosters internal competition among profit centers in the allocation of investment capital. The overarching measure of success within the manufacturing corporation is return on investment (ROI), which becomes a benchmark for deciding (1) how well managers are employing currently invested capital, and (2) which profit centers should get new investment capital. If steam plant superintendents are to be successful in securing capital budget funds, their proposals must clearly demonstrate effective contribution to the corporation’s return on investment. The ROI measurement is derived from the financial elements shown on the top of this page.
A few concepts in this figure are worthy of additional discussion. Net operating income represents earnings before interest and taxes. It’s what remains of sales revenue after deducting operating expenses, which include the cost of goods sold, operations and maintenance, administrative costs, selling expenses, and depreciation.
Average operating assets are the mean dollar value of all assets held over the course of an accounting period (usually a year).
Margin is the ratio of net operating income to sales revenue. As such, it’s expressed as a percentage and can be interpreted as the "cost-price efficiency" of a profit center. Margin may be most useful for measuring sales and marketing performance. However, margin doesn’t incorporate asset utilization, so it’s only a partial measure of overall manufacturing performance. Keep in mind that manufacturing involves amortized plant assets, which incur interest and carrying costs that accrue daily, regardless of production volume. It therefore makes financial sense to maintain asset utilization rates as close to 100 percent as possible.
Asset turnover is margin’s complement. Asset turnover expresses sales revenue as a multiple of the value of assets that produced that revenue. In effect, asset turnover is a measure that compares the relative revenue-making effectiveness of two or more plants, or to track one plant’s performance over time. When a profit center’s margin and asset turnover are multiplied together, the product is return on investment. Therefore, ROI is a simultaneous measure of the profit center’s control of expenses as well as its utilization of production assets.
Why must margin and asset turnover be used together? Think of these analogs: margin is to speed as asset turnover is to time. Taken singularly, speed and time are of limited interpretation. But multiplied together, speed and time describe distance, or the product of travel. Similarly, margin times asset turnover describes the financial product of a manufacturing facility.
A review of the elements in Figure 1 reveals that there are five ways, broadly speaking, to increase ROI:
1. Increase Product Price
This sometimes applies to consumer goods, especially when they can be marketed as "green" or environmentally friendly. In this case, the manufacturer’s effort to optimize energy use also reduces emissions output, thus fulfilling its environmental responsibility. These isn’t realistic for bulk commodities which have prices set by the market (instead of the manufacturer), and are sold in business-to-business markets which, aside from any compelling regulation, have little regard for altruistic intentions.
2. Increase Production Volume or Number of Product Lines
If the market will accept the plant’s additional output, fine. But does the plant have the capacity to produce more output? Steam system efficiency can recapture thermal resources that were lost to leaks, radiant losses, and poor condensate recovery, and apply that load to new production initiatives.
3. Reduce Operating Expenses
The impact of steam optimization in this instance should be obvious-become energy efficient to spend less on fuel. There are additional impacts:
a. Plant optimization helps to preclude downtime. In turn, production schedules become more predictable. This gives the manager tremendous leverage when negotiating with fuel marketers. Fuel is cheaper when purchased in fixed-priced contracts, so predicable consumption allows a greater proportion of fuel to be acquired in this manner. This avoids the bother and expense of purchasing fuel in spot markets, which may happen when plants put on extra, unscheduled shifts to compensate for downtime.
b. Similarly, overtime salaries are avoided.
c. The optimized plant is safer, thanks to more diligent monitoring and maintenance. This is reflected in a clean boiler logbook, which is leverage for reducing hazard insurance premiums.
d. The same actions reduce the exposure to penalties imposed by safety and emissions regulations.
e. For some processes, scrap reduction is achieved through the same actions that enable energy efficiency. Insufficient heat transfer can spoil works in progress, rendering a greater waste of raw materials. For example, improved insulation of steam distribution lines and the reduction of scale build-up in pipes both ensure that heat transfer is achieved at or near system design specifications. Stability of operating parameters reduces waste, as reflected in lower direct material costs.
4. Reduce Asset Holdings
This is an option frequently favored by corporate leaders whose expertise is more financial than engineering-based. ROI embodies the "do more with less" concept when attempts are made to reduce the volume of assets employed per unit of sales. Concurrent to this approach is the aversion to investing in new assets unless it’s absolutely necessary. This is one reason why industry still employs many boiler assets that are decades old. True, as assets are reduced, ROI is increased primarily in the short run.
5. Reduce Downtime of Asset Holdings
The price for avoiding new assets is to endure the failure of old ones. Corporate leaders can maintain ROI by avoiding asset additions, but eventually the downtime imposed by failing assets begins to defeat this strategy. Plant optimization achieved through applied energy efficiency can only support the manager’s adherence to production schedules. It’s worth repeating that assets impose the same carrying costs whether they’re operable or not, so financial performance is improved by moving asset utilization factors as close to 100 percent as possible. From a financial perspective, plant optimization permits greater yield from assets in place.
Impacts on ROI
This section illustrates a hypothetical manufacturer’s step-wise improvement of return on investment. Each of the consolidated financial statements in this sequence (Appendices 1-3) shows the financial elements that make up return on investment.
Step 1
Appendix 1 (page 30) is a financial snapshot of manufacturing operations before implementation of a steam efficiency initiative. There is nothing remarkable about this model statement. The highlights include a profit margin of 10 percent (line 22), which means the company earns 10 cents from every dollar of revenue. The revenue generated by these assets is twice the value of the assets themselves (line 18). Together, margin and asset turnover (line 23) yield a return on investment of 20 percent (line 24).
Step 2
Appendix 2 (page 30) shows this company’s consolidated financial statement for the accounting period after implementing steam efficiency. The steam plant superintendent spends more on operations and maintenance, labor, and training. In return, the savings in fuel expenditures, waste reduction, and reduced overtime more than compensate for the increases. Manufacturing now produces more gross margin (line 9). Savings for reduced emissions penalties and hazard insurance (lines 10 and 11) add to income performance (line 15). The profitability of the plant is reflected in the increased margin (line 22), but this is facilitated in part by investment in new plant assets (line 16). Accordingly, asset turnover (line 23) declines relative to Step 1. Still, the magnitude of margin improvement more than compensates, so ROI is improved to 26.5 percent (line 24).
Step 3
The plant decides to capture the full economic value of its improvements. See that Step 2 generated an additional $456,000 in net income (line 15, Appendix 2). Since the plant makes money (it costs $0.854 to make $1 of revenue; line 21 of Appendix 2), it makes sense to reinvest these savings into production. Accordingly, production is increased by 533 units ($456,000 additional earnings divided by $854 production cost per unit). All manufacturing expenses (line 8) increase relative to Step 2, but this is mostly due to the increase in production. Higher salaries for better-trained plant staff (line 3) push overall expenditures even higher. But with margin per unit still at 15 percent (line 22), the increased production boosts the overall magnitude of net operating income even more (line 15). Finally, the increased production in Step 3 is generated without increasing the asset base, so asset turnover (line 23) improves relative to Step 2. Despite the constant margin, the improvement in asset turnover is enough in Step 3 to increase ROI by another 2.3 percentage points, to 28.8 percent (line 24).
Note that this analysis omits some additional opportunities. For example, the steam efficiency initiative as described here simply increased capacity for making more of the same product. An alternative would be to let that capacity serve a new product line-perhaps one that’s marketed as a "green" or environmentally friendly alternative. As such, the new product may command a premium price, which ultimately would have driven return on investment even higher.
To whom do the benefits of steam efficiency accrue? Figure 2 (page 28) shares again the ROI schematic, but with detail showing impacts on specific financial elements.
In the final analysis, the investment in steam system optimization provides benefits beyond the boiler room. True, plant staff gets some training and a corresponding boost in pay. The steam plant superintendent gets the resources to upgrade steam assets and maintenance. But in addition, product managers enjoy lower costs per unit due to reduced waste of direct materials, as well as avoided downtime. Sales and marketing staff enjoys a bit more negotiating room since the spread between product cost and price has widened. The corporate officers demonstrate to shareholders a higher return on investment, thus positioning the company well for attracting more investment capital. Finally, the manufacturing operation survives another round in the continuing battle with global competition.
This article is part of an ongoing discussion of policy and programs that impact the market for mechanical insulation and energy management in general. The Alliance to Save Energy, a Washington, D.C. based non-profit organization, is closely allied with the National Insulation Association in promoting the benefits of energy efficiency.
References and Resources
- Ray H. Garrison, Managerial Accounting, Sixth Edition, Irwin Publications, 1991.
- Robert Griffin, The Enbridge "Steam Saver" Program, Steam Boiler Plant Efficiency Update to Year-End, 2002, March 2003 (http://www.steamingahead.org/Enbridge03.pdf).
- A.D. Little, Overview of Energy Flow for Industries in Standard Industrial Classifications 20-39, Reference 71563, Dec. 4, 2000
(http://www.ase.org/steamingahead/papers/adlittle.pdf). - U.S. Department of Energy, Energy Information Administration, various data for 2001 (www.eia.doe.gov).
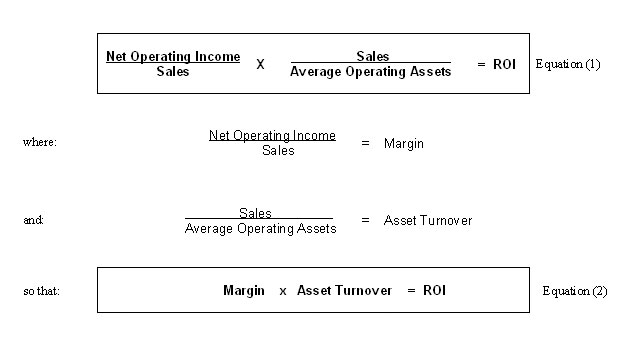 Figure 1
The financial elements shown above help demonstrate return on investment measurement.
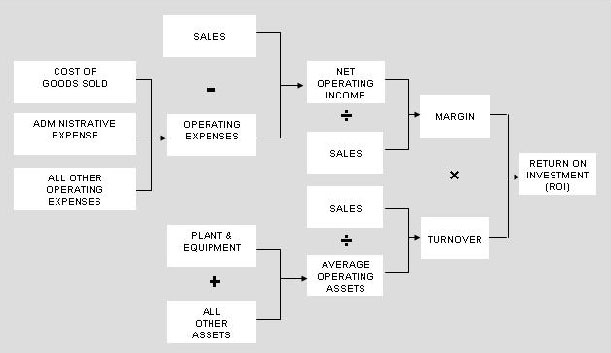 Figure 2
Elements of manufacturing return on investment.
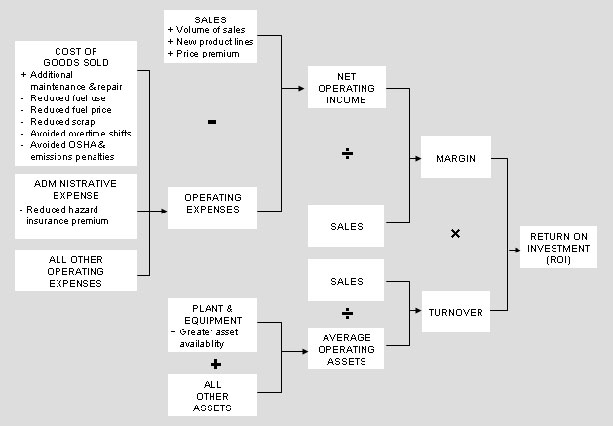 Figure 3
Breakout of elements of manufacturing return on investment.
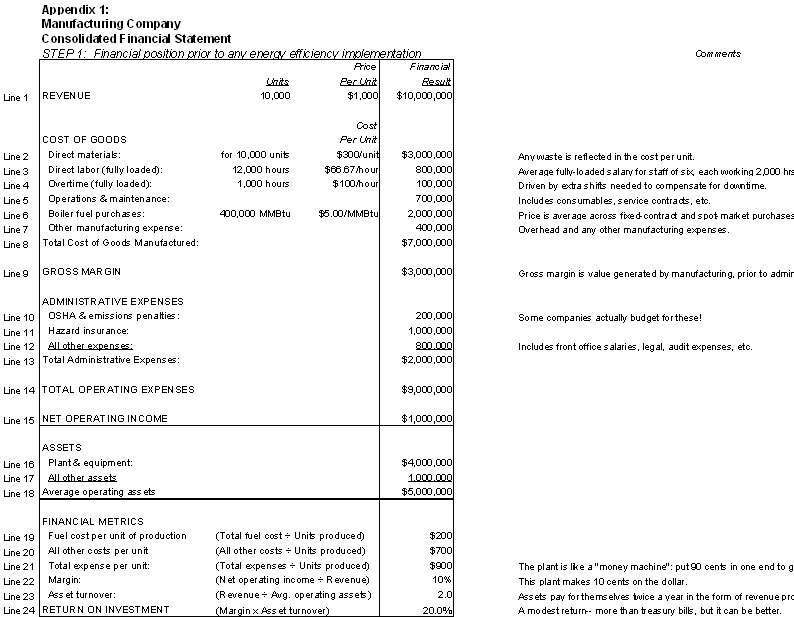 Figure 4
Appendix 1 is a financial snapshot of manufacturing operations before implementation of a steam efficiency initiative.
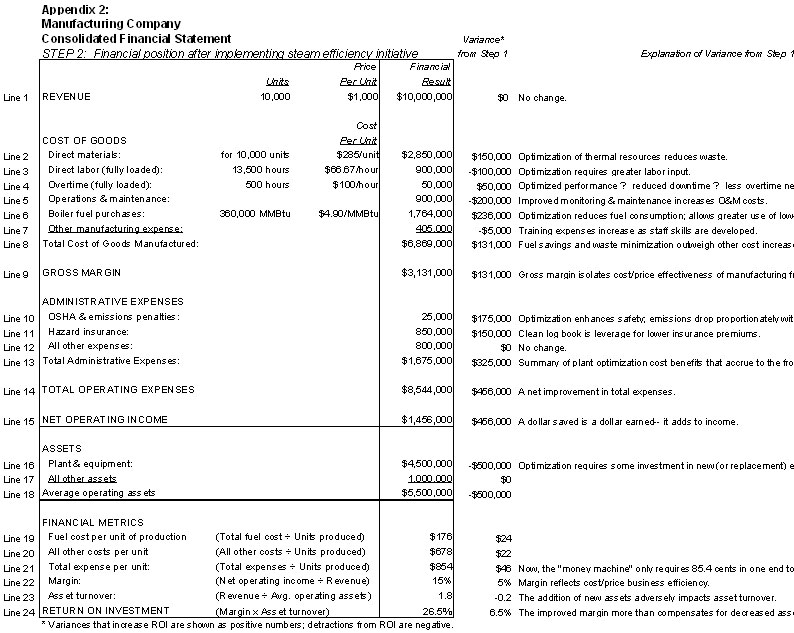 Figure 5
Appendix 2 shows financial position after implementing a steam efficiency initiative.
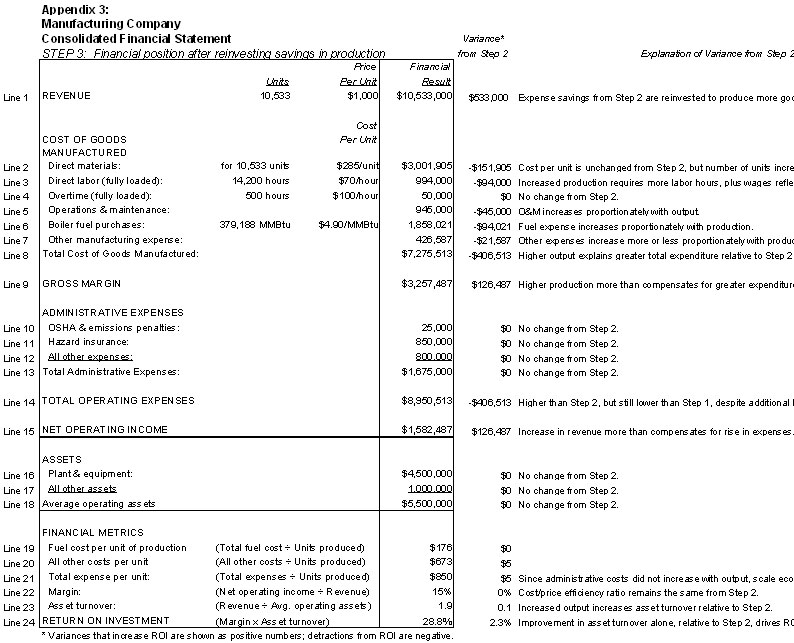 Figure 6
Appendix 3 shows a company’s financial position after reinvesting savings in production.
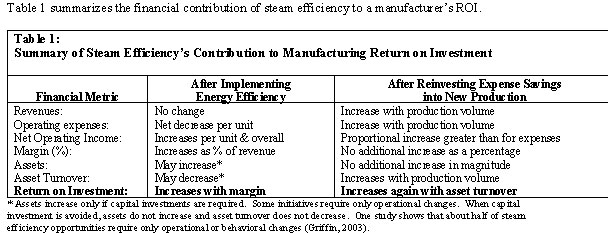 Figure 7
Table 1 summarizes the financial contribution of steam efficiency to a manufacturer’s ROI.