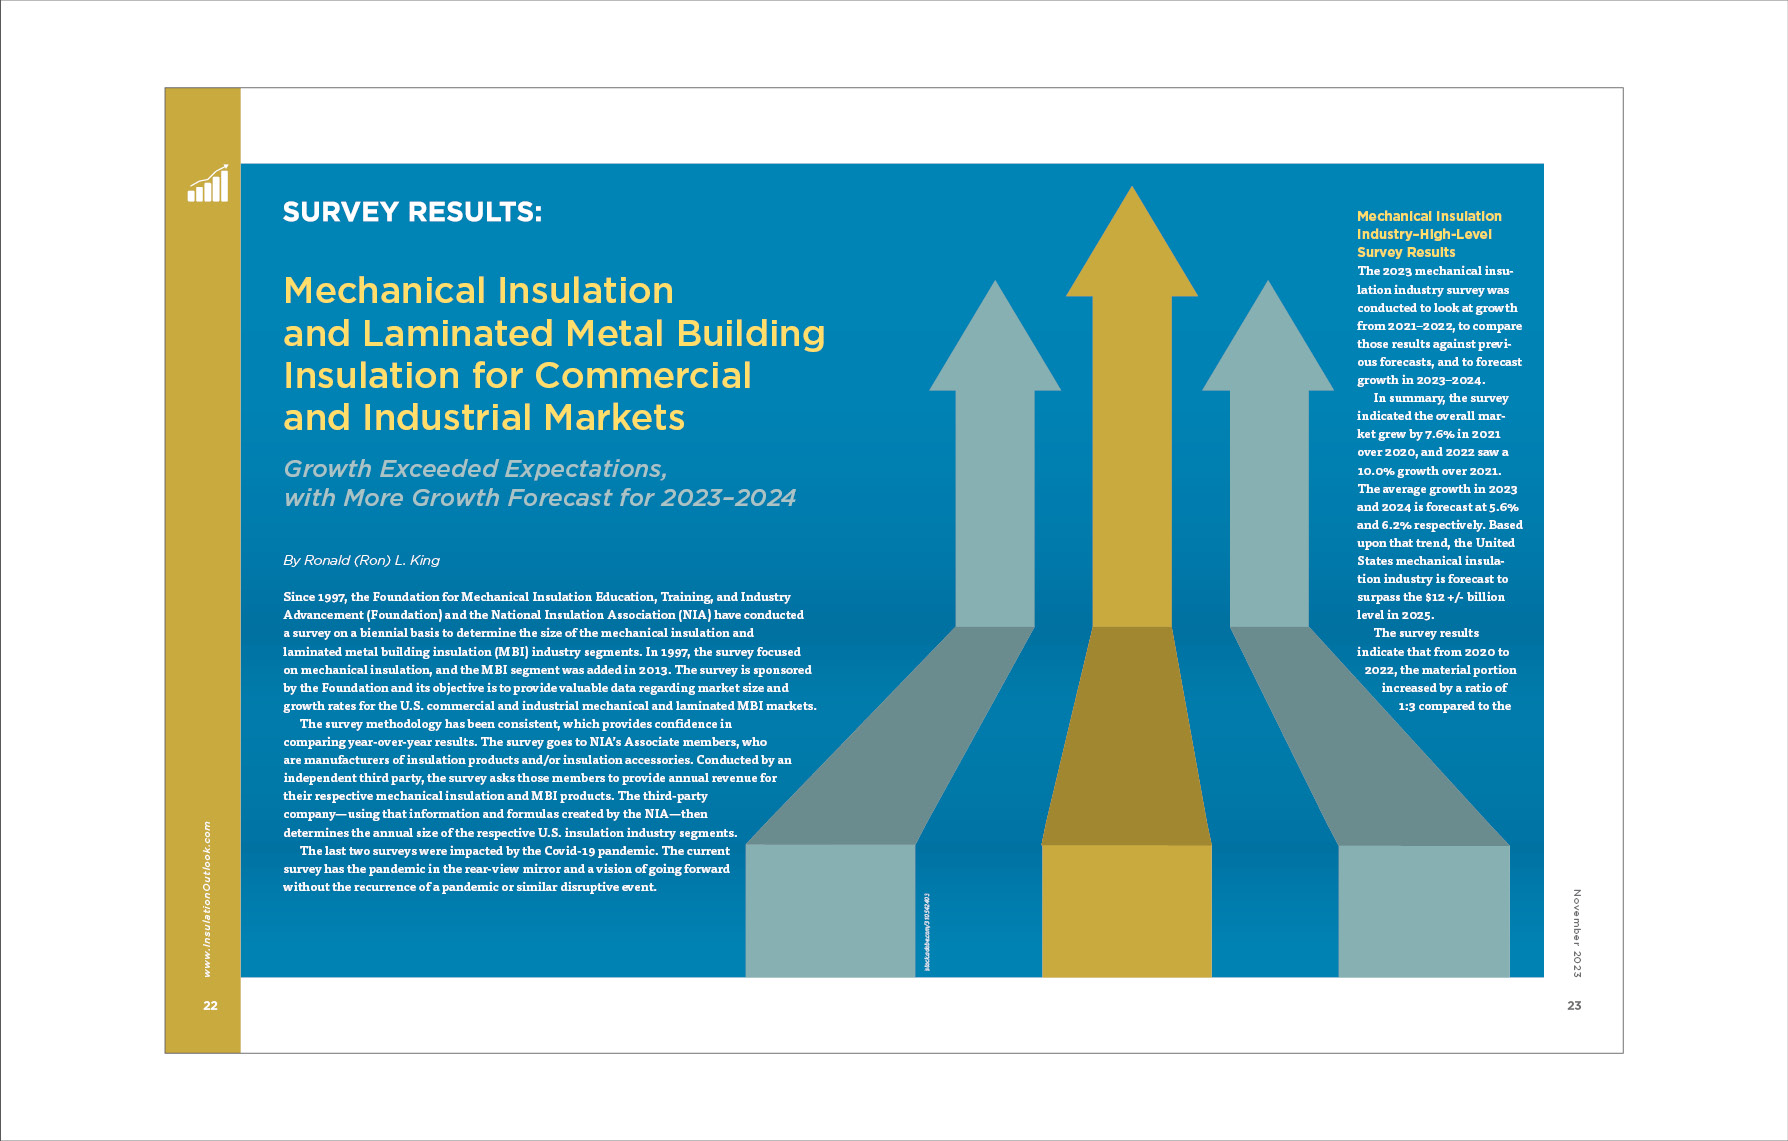
Survey Results: Mechanical Insulation and Laminated Metal Building Insulation for Commercial and Industrial Markets
Growth Exceeded Expectations, with More Growth Forecast for 2023–2024
Since 1997, the Foundation for Mechanical Insulation Education, Training, and Industry Advancement (Foundation) and the National Insulation Association (NIA) have conducted a survey on a biennial basis to determine the size of the mechanical insulation and laminated metal building insulation (MBI) industry segments. In 1997, the survey focused on mechanical insulation, and the MBI segment was added in 2013. The survey is sponsored by the Foundation and its objective is to provide valuable data regarding market size and growth rates for the U.S. commercial and industrial mechanical and laminated MBI markets.
The survey methodology has been consistent, which provides confidence in comparing year‑over‑year results. The survey goes to NIA’s Associate members, who are manufacturers of insulation products and/or insulation accessories. Conducted by an independent third party, the survey asks those members to provide annual revenue for their respective mechanical insulation and MBI products. The third-party company—using that information and formulas created by the NIA—then determines the annual size of the respective U.S. insulation industry segments.
The last two surveys were impacted by the Covid-19 pandemic. The current survey has the pandemic in the rear-view mirror and a vision of going forward without the recurrence of a pandemic or similar disruptive event.
Mechanical Insulation Industry–High-Level Survey Results
The 2023 mechanical insulation industry survey was conducted to look at growth from 2021–2022, to compare those results against previous forecasts, and to forecast growth in 2023–2024.
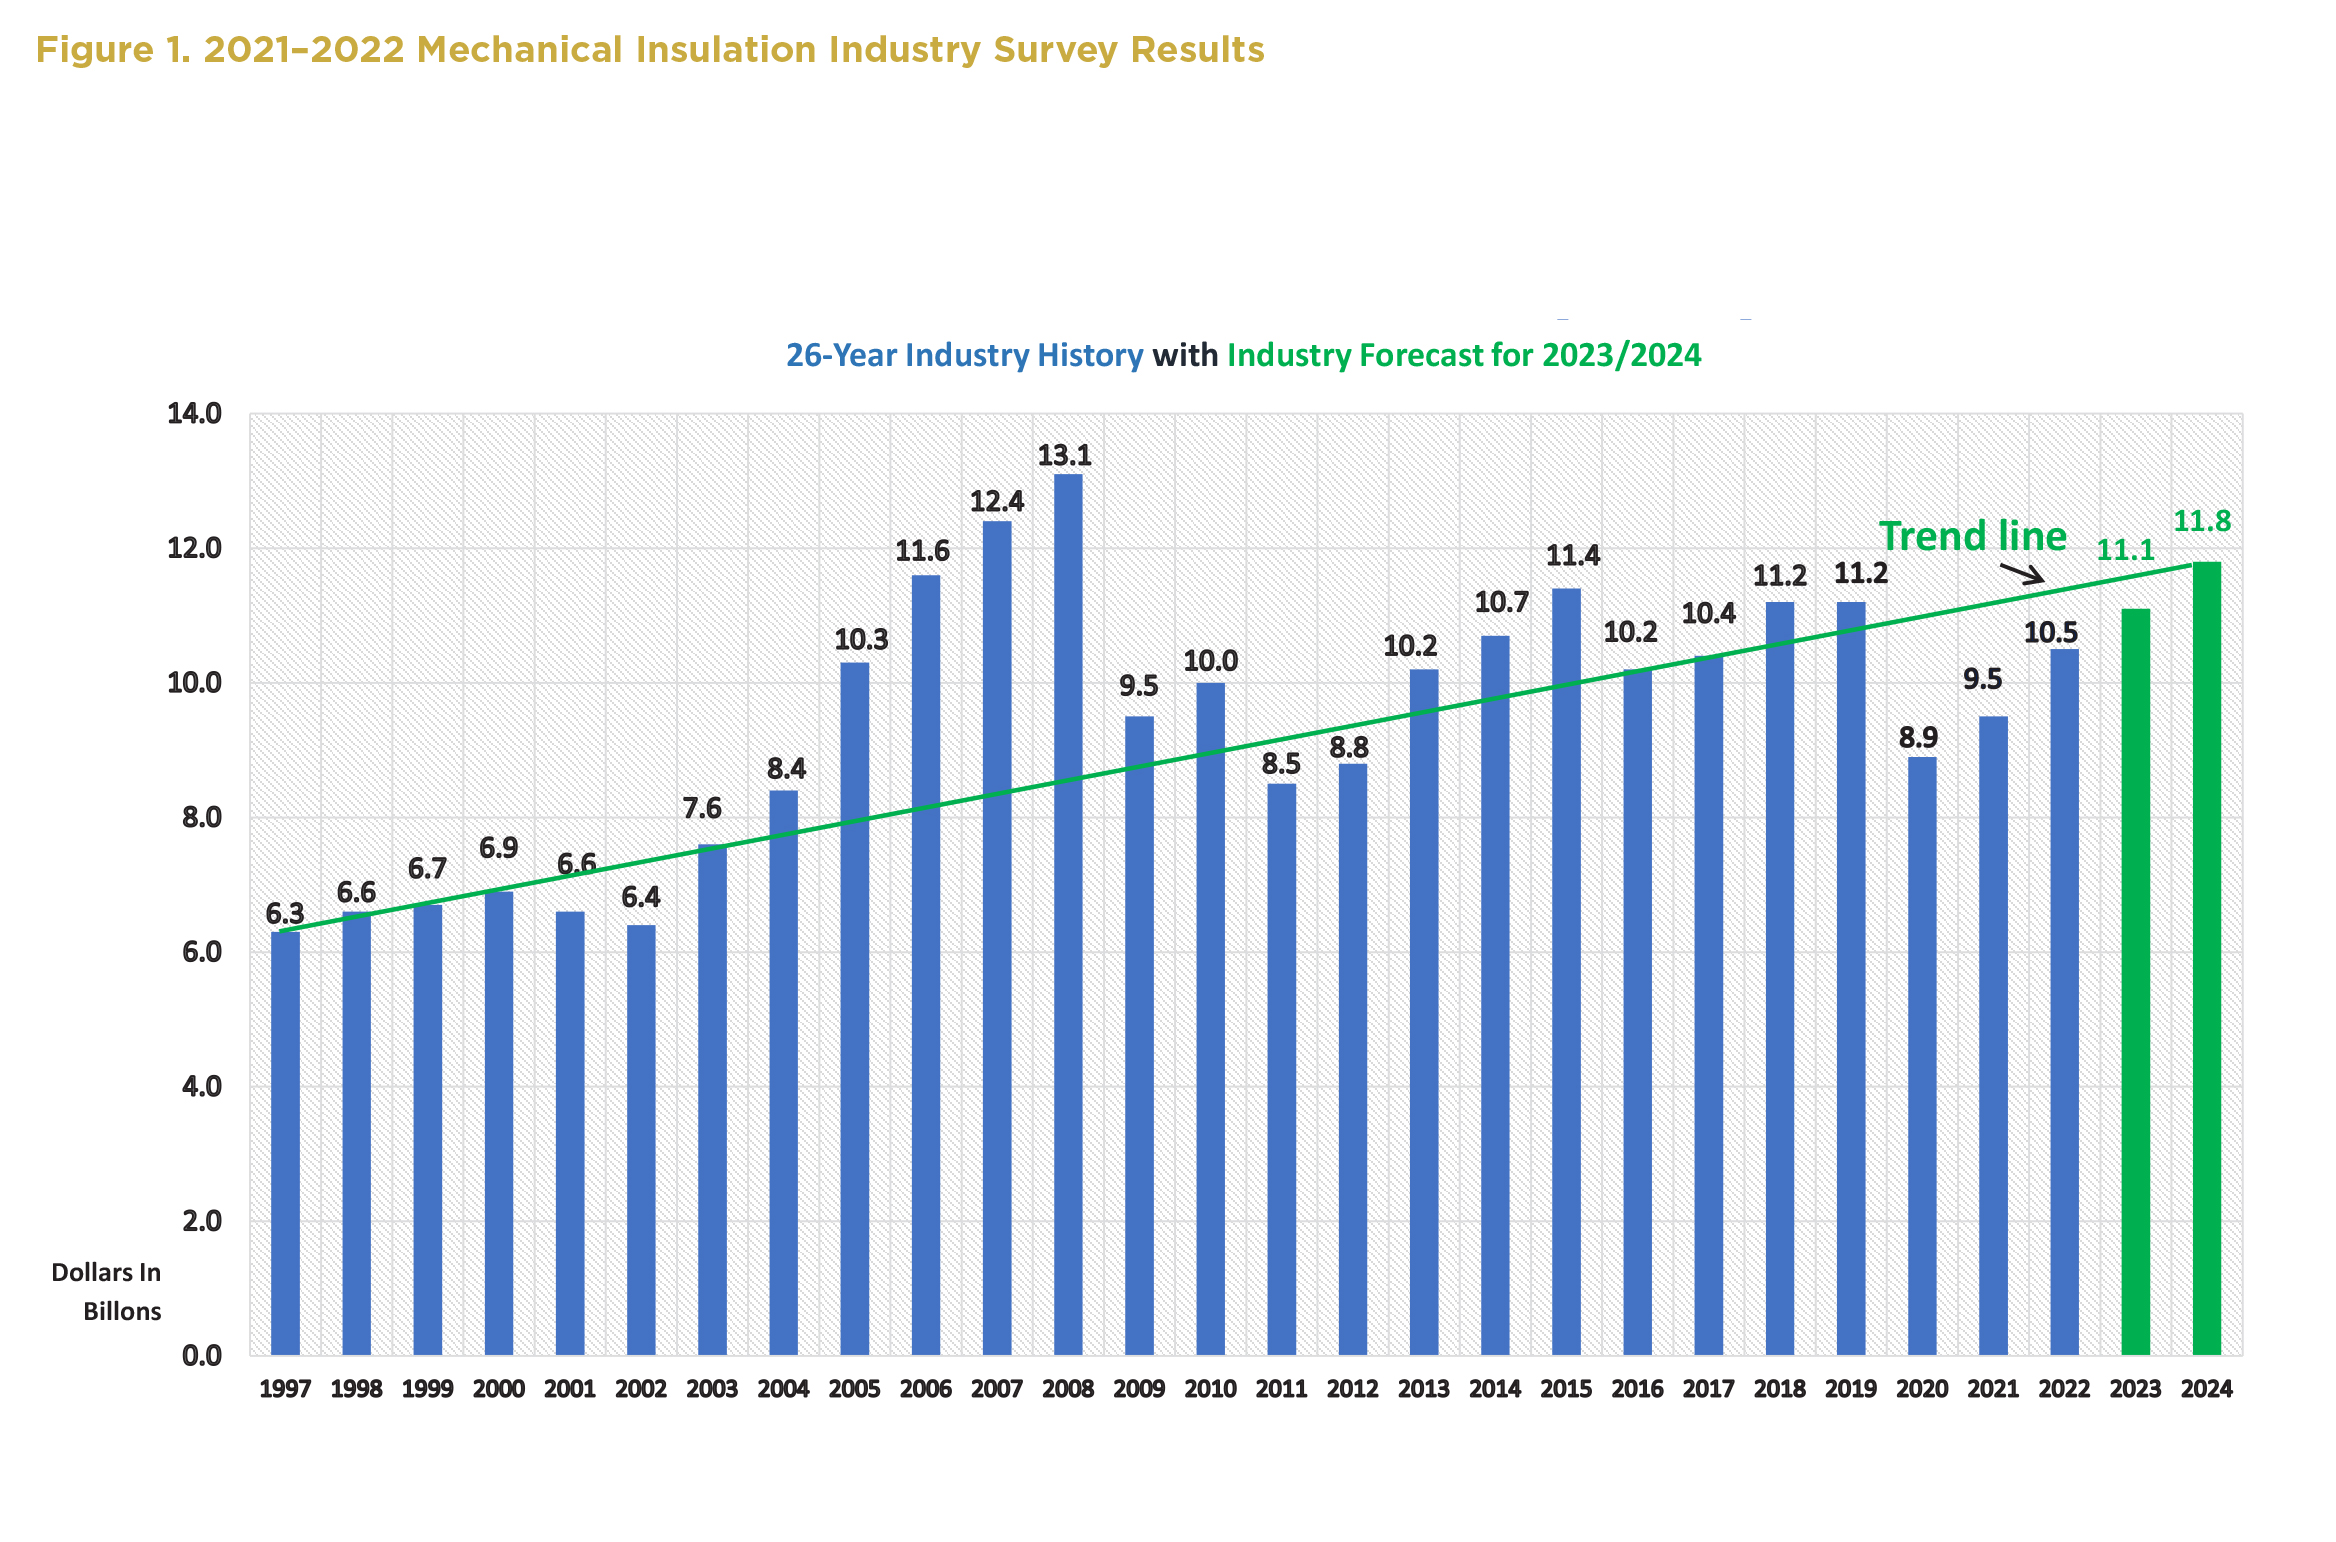
In summary, the survey indicated the overall market grew by 7.6% in 2021 over 2020, and 2022 saw a 10.0% growth over 2021. The average growth in 2023 and 2024 is forecast at 5.6% and 6.2% respectively. Based upon that trend, the United States mechanical insulation industry is forecast to surpass the $12 +/- billion level in 2025.
The survey results indicate that from 2020 to 2022, the material portion increased by a ratio of 1:3 compared to the labor portion. It appears that material cost continued to increase at a faster pace than labor, but the increased use of higher cost insulation systems also would have impacted the ratio.
Detailed Findings
As we have seen with past surveys, industry growth is not uniform across market segments, the country, regions, states, or even within states. Figure 1 exhibits the industry growth trend over the last 26 years (1997–2022), including the forecast for 2023 and 2024.
The survey methodology does not provide a breakdown between what is generally referred to as the commercial and industrial market segments. In previous surveys, respondents indicated a larger percentage of their insulation materials were utilized in the commercial market: 55–60%. That estimate is believed to be representative of the current market. Insulation units (linear and/or square foot) installed in the commercial sector are larger than the industrial sector; however, due to the higher cost of insulation systems utilized in the industrial section, the dollar value is probably equal between the market segments.
We began including annual forecasts in the 2013 survey. Figure 2 provides a graphic comparison of actual versus forecast annual figures. Over a 10-year span, on average, actual results have been 95% of forecast, even with the impact of the pandemic in 2020. Without the impact of the pandemic, adjusted 2020 activity would have been in line with what was forecast, yielding average actual results of 97% of the forecast.
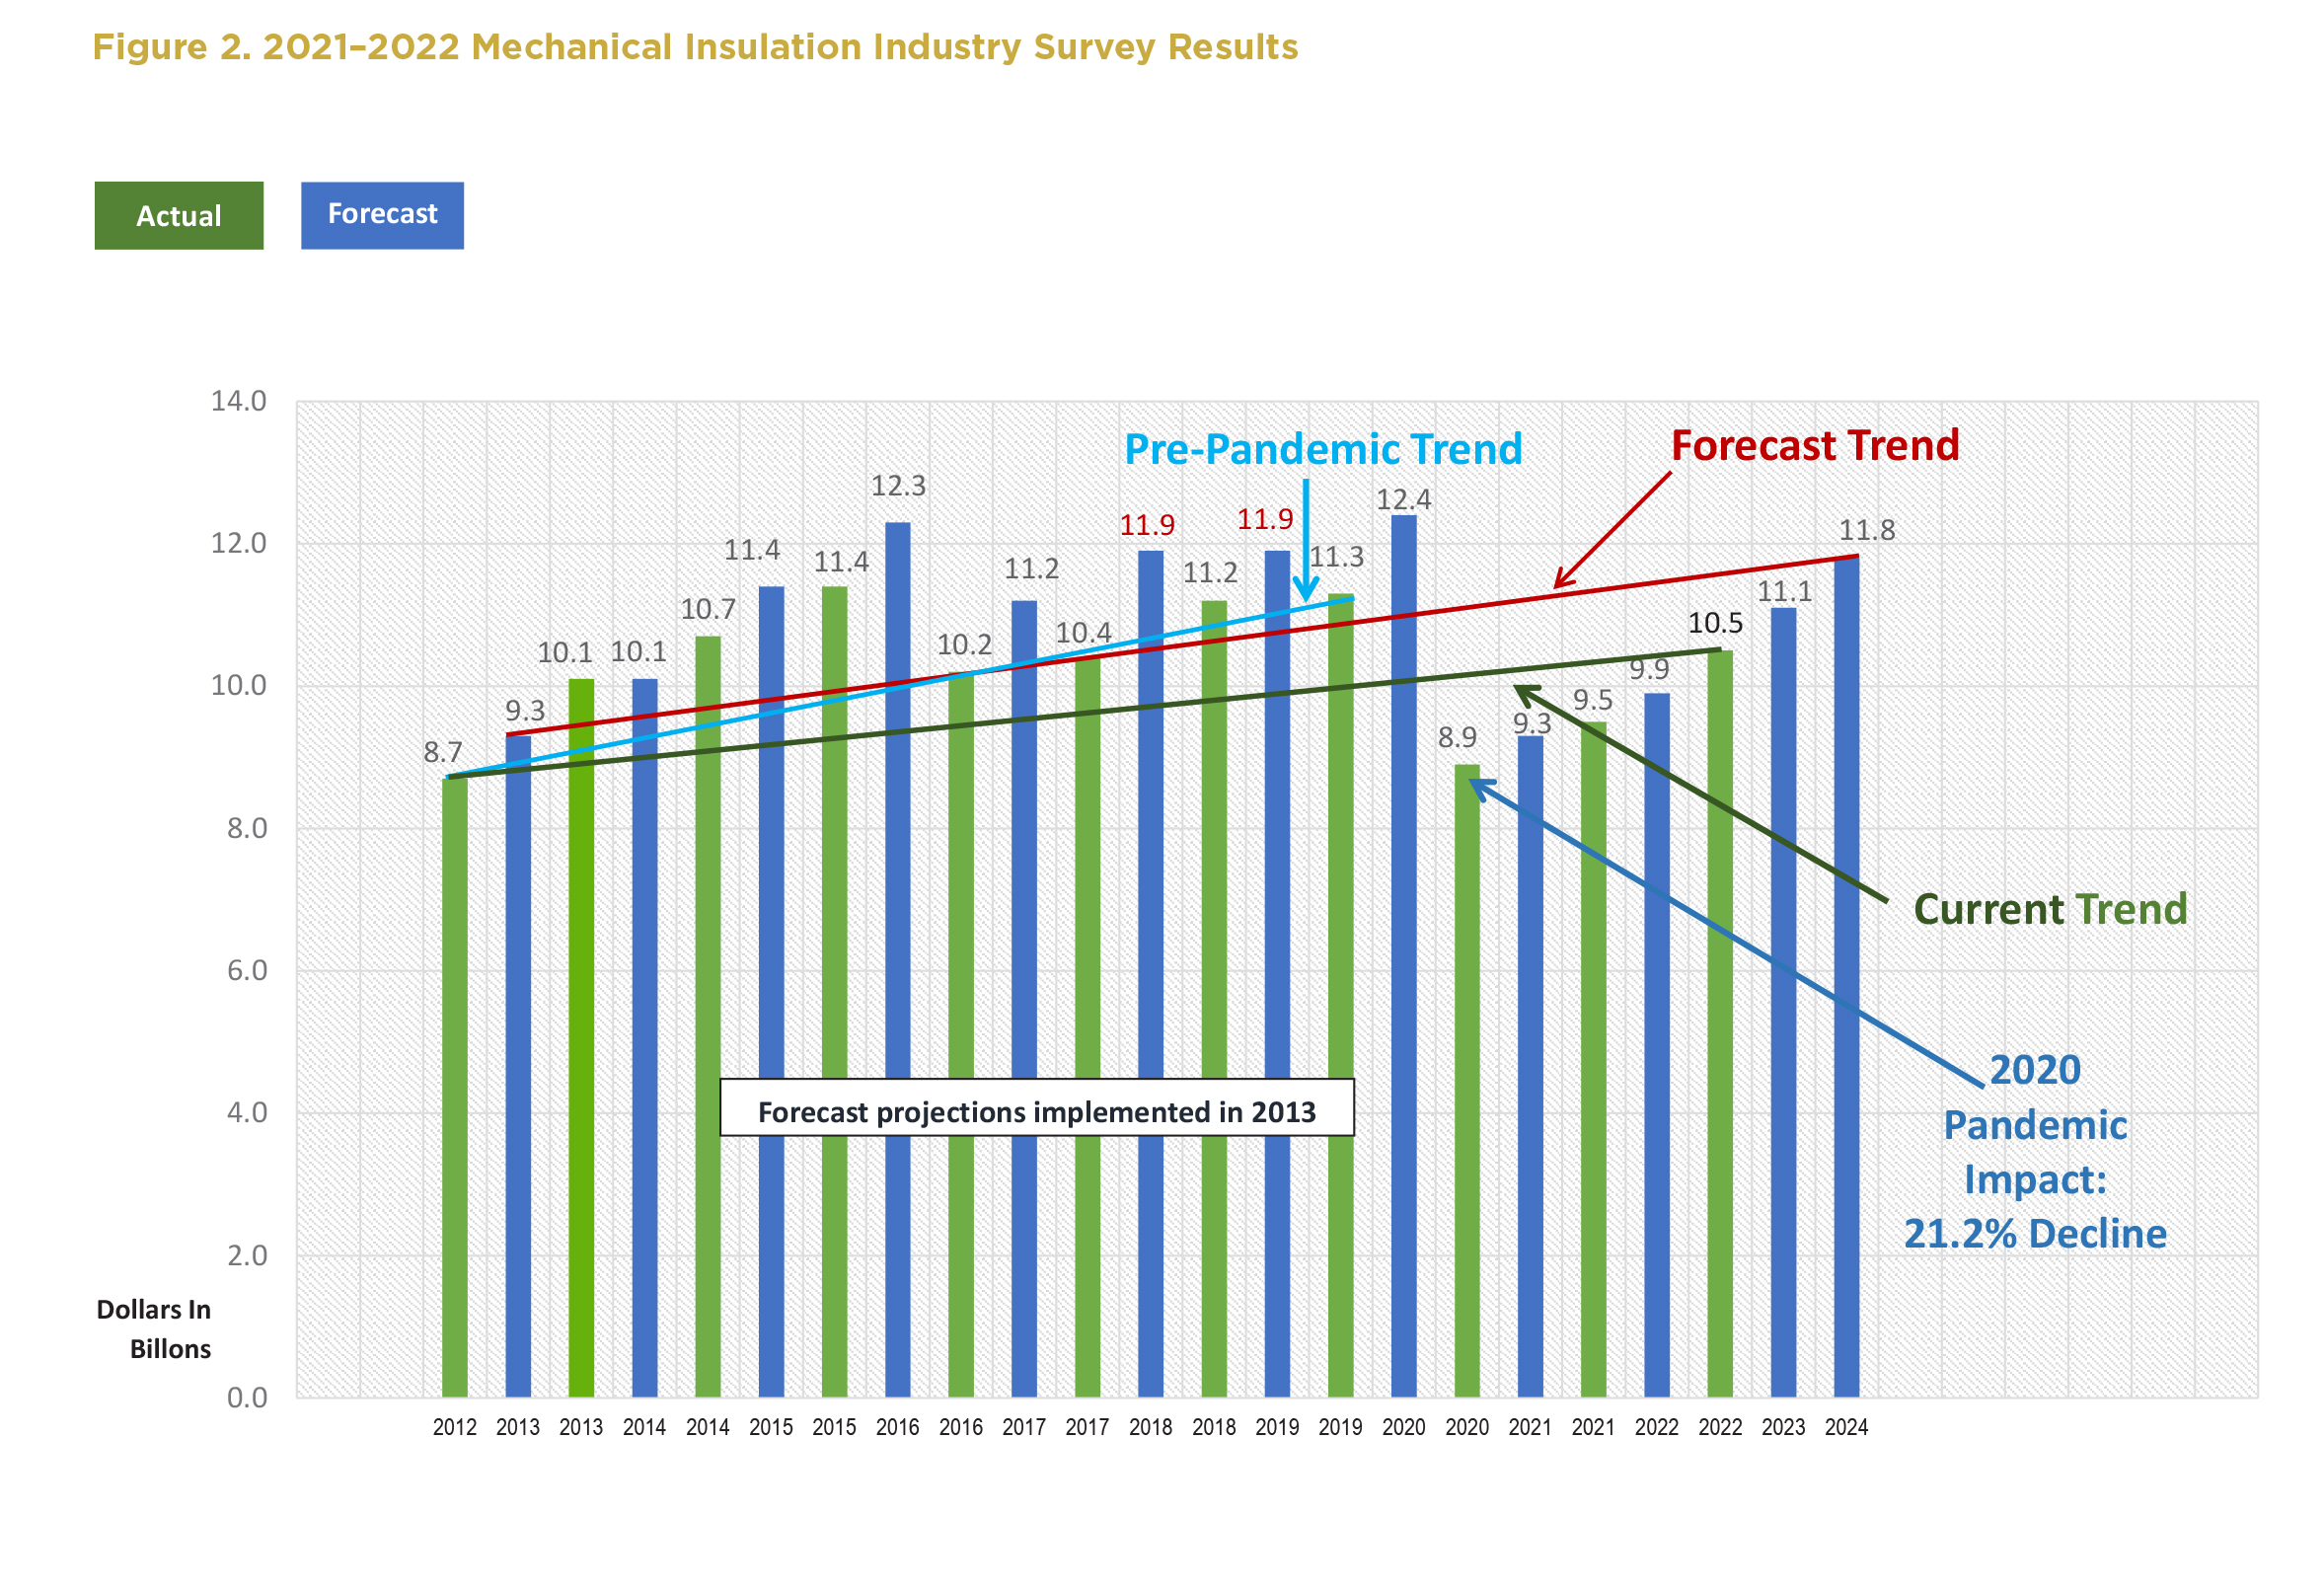
There is considerable range in actual versus forecast performance, from the market exceeding forecasts by 9.7% in 2013 to missing forecast by 28.2% in 2020 (no one could have predicted the impact of the pandemic).
Forecasting is generally a result of analysis of available pertinent data. One’s view when comparing actual to forecasted numbers may depend on which side of the desk one sits, but when you consider the many potential variables from an industry perspective, achieving 95–97% of forecast over a 10-year span is impressive. Of course, exceeding forecast is always better.
Consistent with prior years, in an effort to gain a more complete picture, the Foundation and NIA conducted an informal survey regarding the ratio of labor to material among contractors, and sales margins among distributors and contractors.
Beginning in 2017, contractors reported a significant change in the labor to material ratio. The ratio consists of blended numbers across both commercial and industrial industry segments, and across all projects (new construction and maintenance) and contract types. That ratio changed again in 2019 and 2020, from 70% labor and 30% material in 2018, to 69% labor and 31% material. The ratio changed again in 2022 to 68% labor, 32% material.
The ratio of labor to material varies between the commercial and industrial projects or applications. While the ratio in each market segment was not obtained, is it estimated that the greater impact would have been in the industrial segment. Survey calculations are based on an estimated blended ratio. With the methodology used in the survey calculations, a change in the ratio can have a pronounced effect on the survey results.
Change in the ratio is believed to be driven by a combination of the use of higher cost insulation systems; a higher number of projects utilizing multiple layer/complex insulation systems, specifically for cryogenic applications; continued growth related to the use of flexible, removable, reusable insulation covers; the growth of fabricated pipe insulation from board products; and similar types of market impacts.
The survey indicated gross margin improvement in both the distribution and contractor channels in 2021 and 2022. Many items impact gross margin, and the basis of that improvement will obviously vary by company.
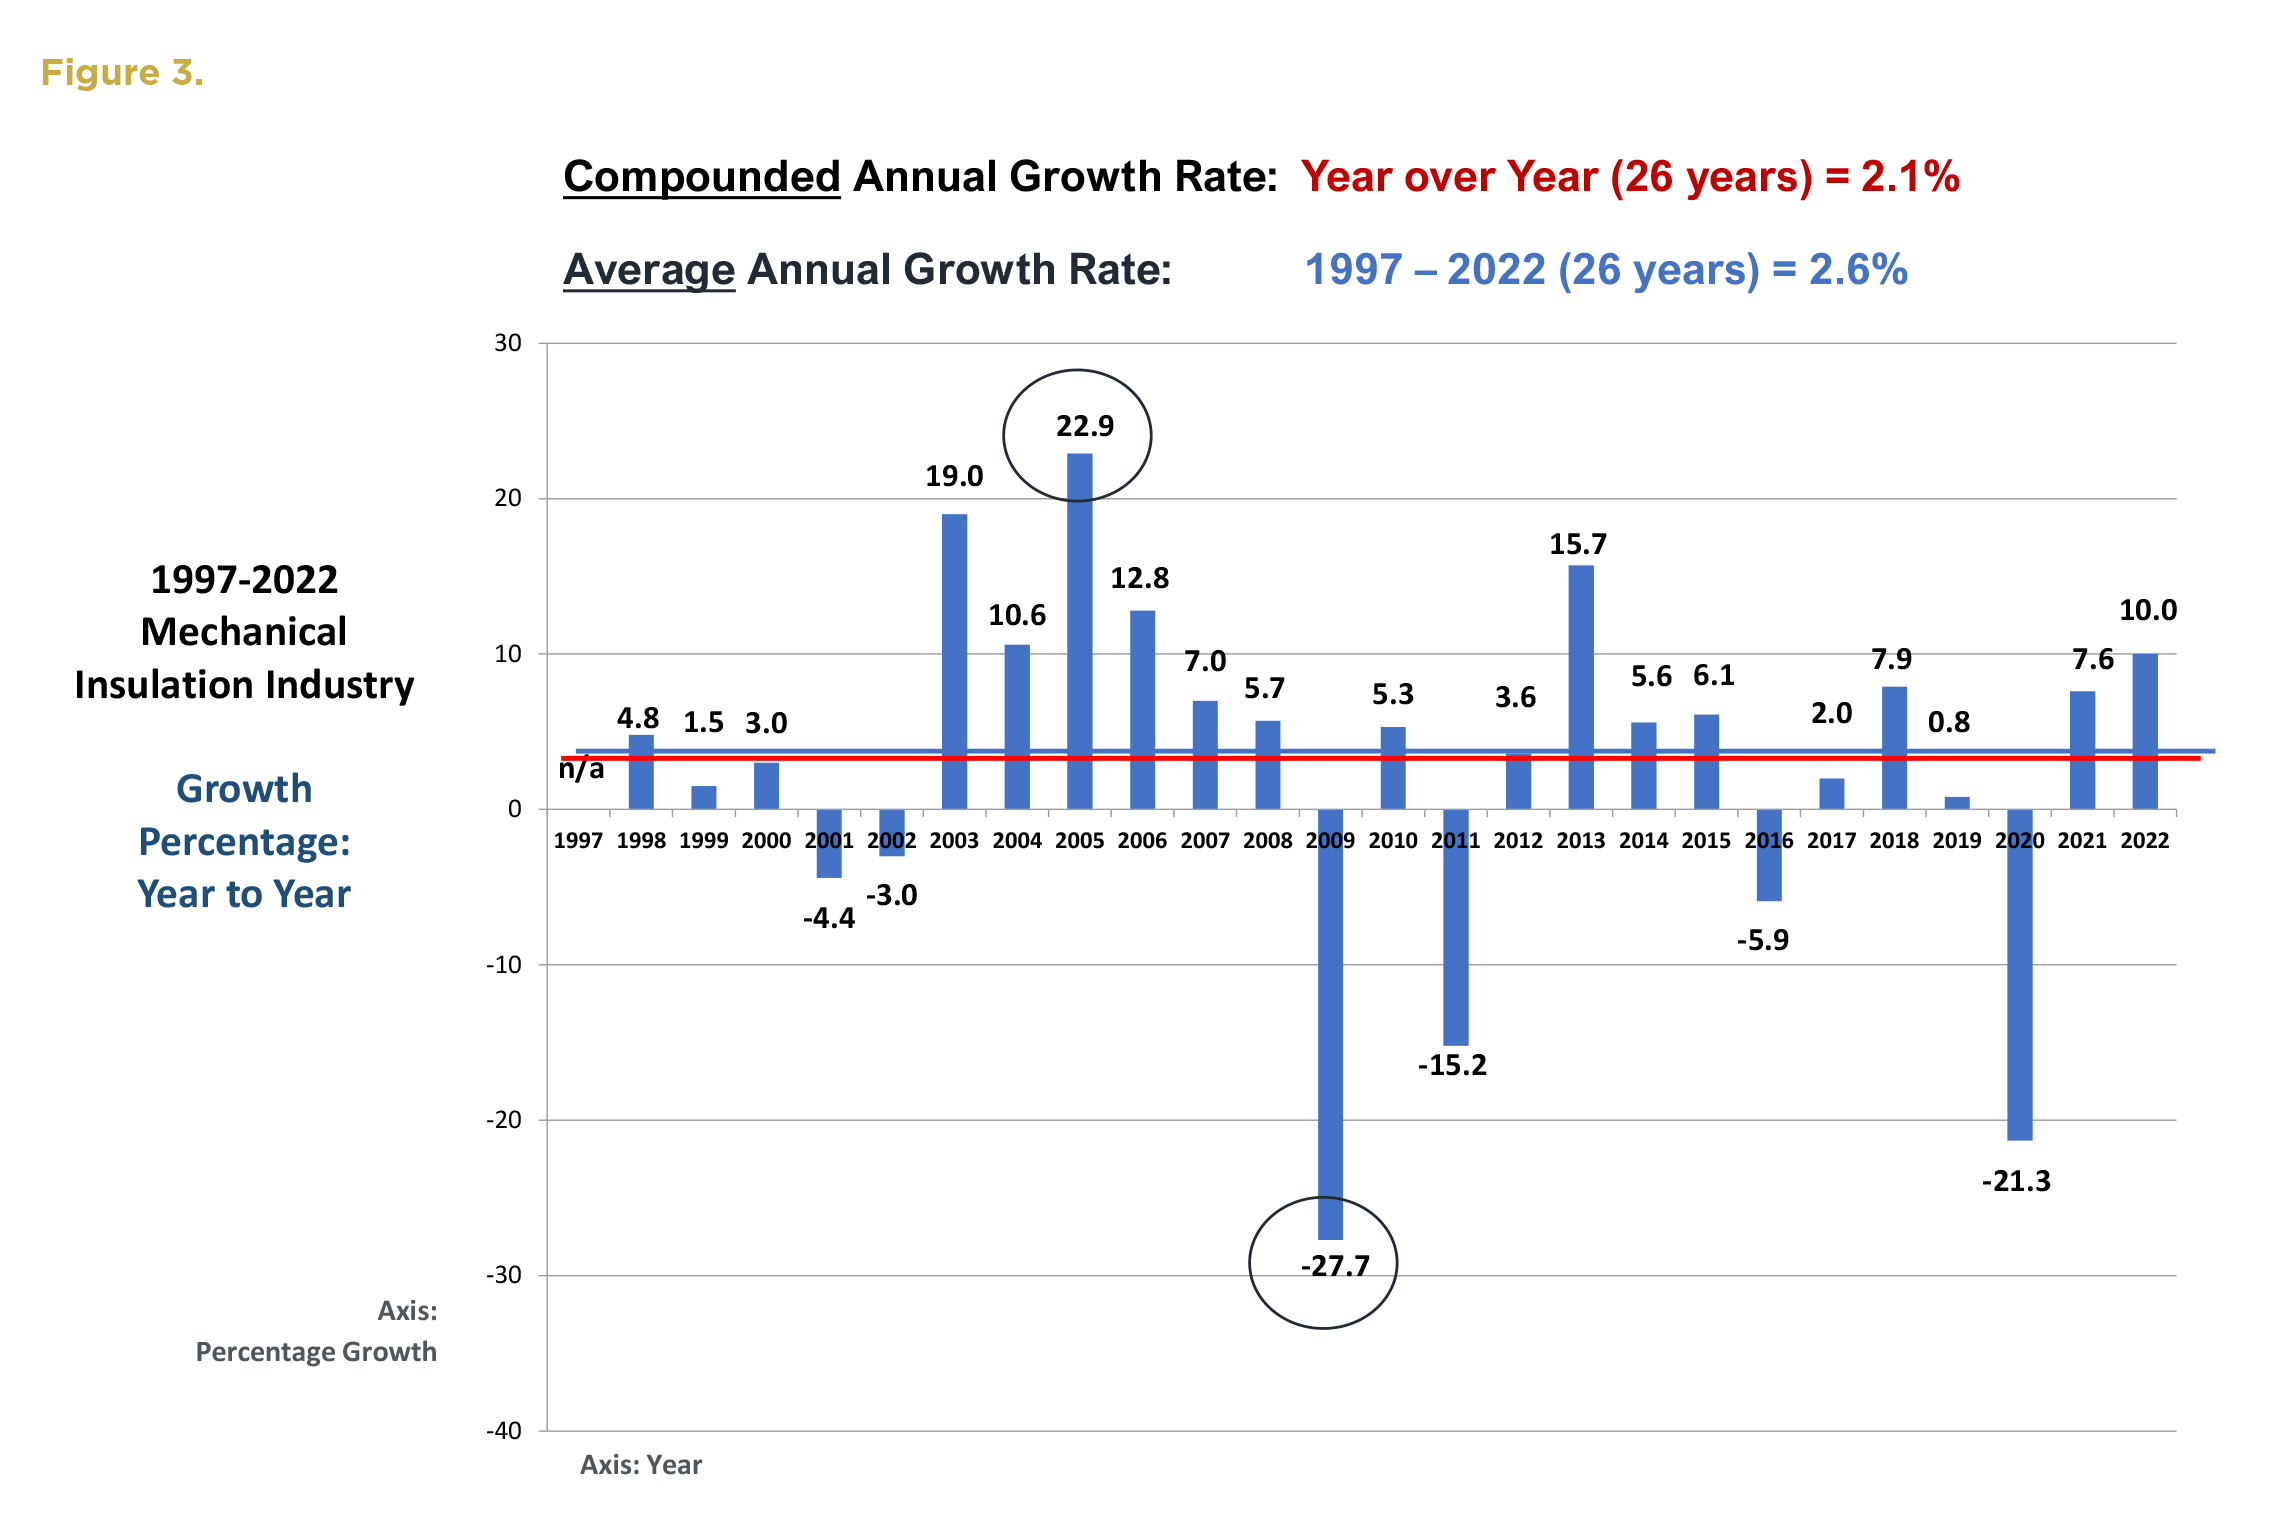
Figure 3 illustrates the industry growth percentage year to year. 2005 exhibited a 22.9% annual growth rate, and 2009 marked a decline of 27.7%. While the decline in 2020 as a result of the pandemic was significant, it was not the worst decline the industry has experienced in the last 26 years.
Annual fluctuations are to be expected and are caused mainly by changes in the overall economy. When analyzing the data in comparison to the economy, one needs to take into consideration that, due to construction cycles, the mechanical insulation industry typically trails overall economic trends by 9 to 15 months.
The compounded annual growth rate—which refers to industry growth over the entire 26 year period—is 2.1%, while the average annual growth rate over that period is 2.6%. If 2020 had resulted in zero growth, the average growth rate would have been 3.4%. The industry has experienced growth in 20 of the last 26 years.
The survey indicates an expected average industry growth of 5.6% in 2023, and 6.2% in 2024. The range in forecasts among insulation manufacturer respondents was -1% to +23% for 2023, and +2% to +21% in 2024. Both years, the increase was basically split between unit and dollar growth, with unit growth being slightly higher in both years.
With that wide a spread in projections for both years, pessimistic or optimistic projections could impact the average. If you discount the two lowest (pessimistic) and highest (optimistic) projections, the average projected growth rate for 2023 is 4.6%, and 4.5% for 2024, ranging between 2% – 8% for 2023 and 3% – 8% for 2024.
Analysis of survey results is always subject to individual interpretation. Considering the high-level basis of this survey, and the methodology employed to determine survey results, the comparison of actual results versus the forecast is worthy of discussion.
Without adjusting forecast or actual results for impacts from unforeseen or uncontrollable events (like the pandemic), unexpected changes in the economy, the change of the labor to-material ratio and/or global events, adjusting for inflation and similar factors, the survey results seem to be reasonable in comparison to the economy, which is the primary driver of the mechanical insulation industry.
Economists have referred to the United States having endured a short-term Covid-19 recession in 2020. After finalizing the survey results in 2020, we decided to look back at prior recessions after 1997 and see how the duration of those recessions aligned with the annual growth, or decline, in the mechanical insulation industry.
A recession, in simple terms, is a period of temporary economic decline during which trade and industrial activity are reduced, generally identified by a fall in GDP in two successive quarters.
Over the 26 years the survey has been conducted, it is generally recognized that a recession occurred in 2001, 2007–2009, and again in 2020. Figure 4 illustrates those periods in comparison to annual survey results.
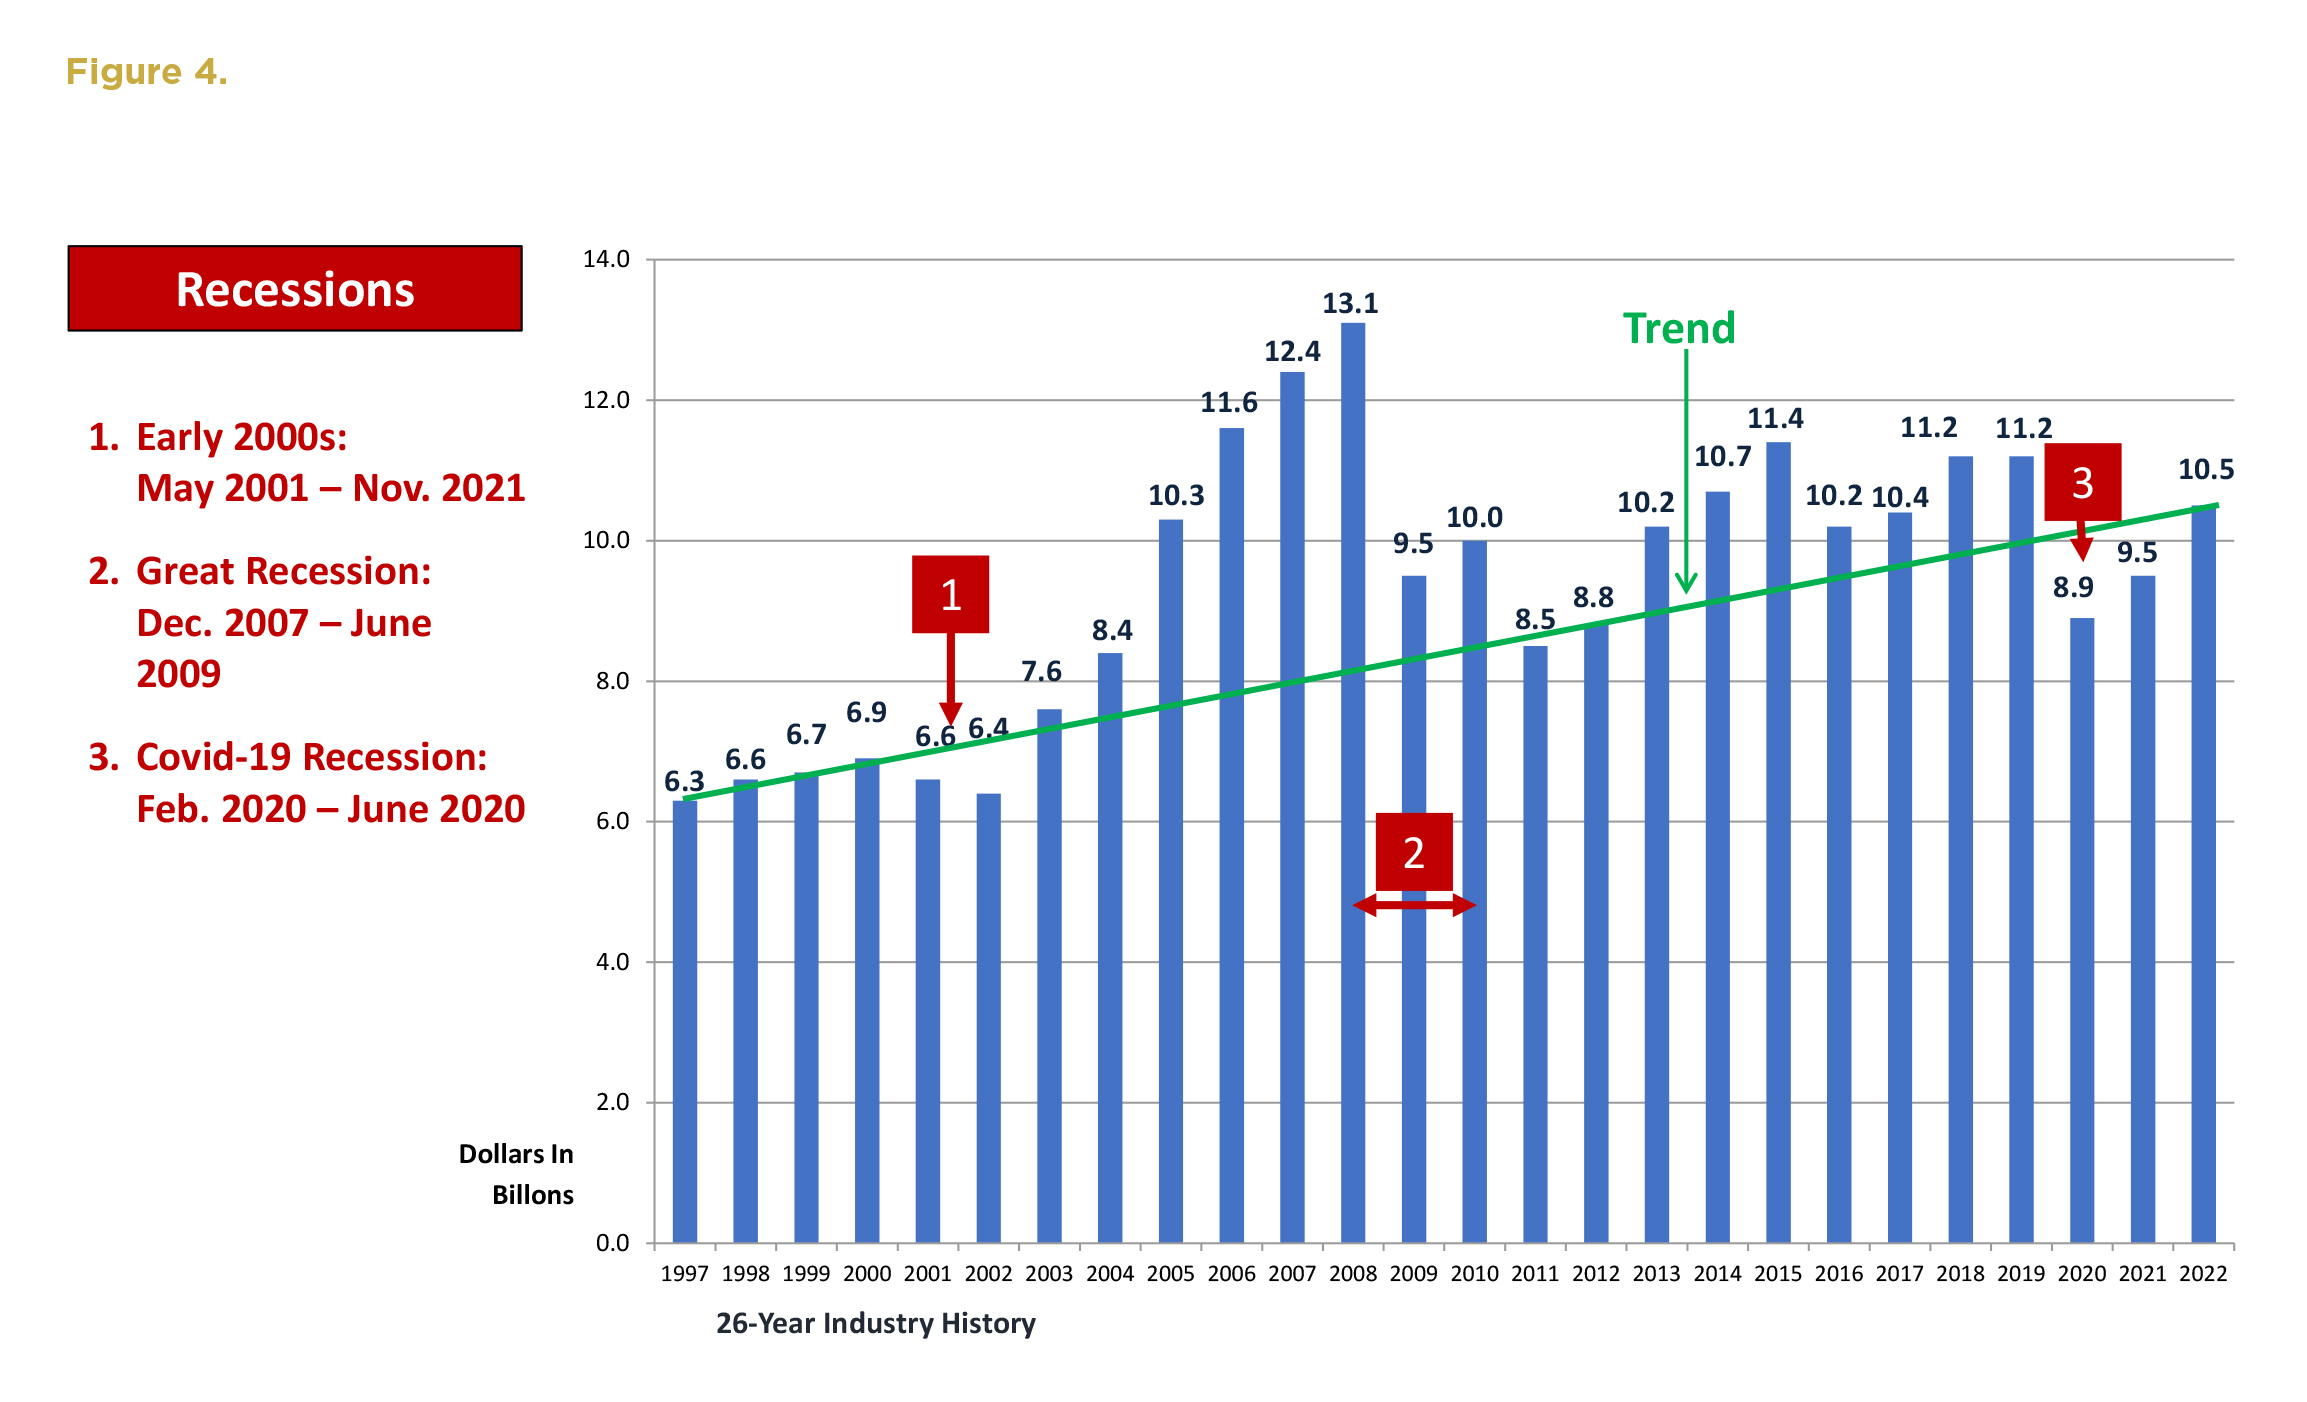
Due to the nature of commercial and industrial construction projects, the mechanical insulation industry typically is one of the last segments to feel the impact of a recession and then experience the benefits of recovery.
While the 2001 recession was short lived, the industry did experience a decline beginning in 2001, continuing through 2002, with a slow recovery starting in 2003. The Great Recession began in late 2007, yet the industry had its biggest year ever in 2008, with a substantial decline in 2009 that lingered through 2012 before sustained recovery began.
2013 through 2019 experienced more normal fluctuations, trending in an upward direction; then the Covid-19 recession hit. The major difference in that recession is that there was no substantial trailing effect. The industry felt the impact immediately, and the recovery slowly began in the second half of 2021. It was a different type of recession, but a recession nevertheless. The results of the most recent survey clearly indicate the Covid-19 recession is in the rear-view mirror.
Survey Methodology and Assumptions
The following is some information about the survey and a few takeaways that have been developed in conjunction with tabulation of the survey data. Again, survey results are always subject to individual interpretation.
- The potential impact of imported products coming from outside North America in past surveys was believed to be minimal and not included, nor are they included in the most recent survey. All indications are that the degree of imported products has increased so that they may need to be included in future surveys.
- The survey excludes major project scaffolding and similar types of project requirements. Informal surveys were conducted to determine margins and labor and material ratios. Variations in those results could affect the total insulation market estimate.
- The survey is based upon dollars, not units, and a consistent approach has been utilized over 26 years (1997–2022). Based on the survey methodology, the results should represent a conservative number.
- This portion of the survey does not include data related to MBI; heating, ventilating, and air-conditioning (HVAC) duct liner; original equipment manufacturer products; building/envelope insulation; residential insulation; refractory products; other specialty insulations; or insulation products or technologies not currently within the scope of NIA members’ mechanical insulation products.
- Insulation products include any/all accessory products when sold as an integral part of the manufacturer’s products (e.g., all-service jacket [ASJ] or other facing on blanket, board, or pipe covering).
- The survey is intended to show a national picture for the respective calendar year. Based upon observations and conversations, there are significant geographical and product variances in the survey results. This is consistent with a survey this broad in nature.
- A few minor methodology modifications were required with the 2022 survey to ensure comparable results year over year. The changes were needed to accommodate the continued growth of flexible, removable, reusable insulation covers; fabricated pipe insulation from board products; increased use of accessory products in insulation systems; insulation system changes to mitigate corrosion under insulation; increased use of prefabricated fitting materials; and a host of similar industry trends—combined with consolidation at the manufacturer level.
- The 2023 and 2024 forecasts seem conservative in comparison to some economists’ projections, but keep in mind that the mechanical insulation industry normally trails construction start projections. The forecast does not break out growth expectations between the commercial or industrial market segments or between new construction, retrofits, and/or maintenance applications. Historically, a forecast of this nature includes a blend of these applications, with new construction being the largest percentage. Regardless, the growth forecasts are welcome news.
- Along with interpretation between the commercial and industrial market segments, the survey methodology unfortunately does not allow for analysis between types of applications, contracts, or products. The survey does allow for detailed analysis as to whether the increases or decreases were led by unit or dollar growth, however, and it is believed dollar growth was slightly higher.
- The Foundation always requests that survey participants share detailed information about their participation in the insulation industry; to date, however, many are only willing to share general information, rather than detailed segment or product line information. In addition, many products are fabricated into different shapes and shipped to various locations for use in multiple industry segments, which makes reporting or forecasting by industry segment or geographic region difficult.
Looking Forward
The mechanical insulation market is once again on a sustained growth track. The industry continues to exhibit compounded growth over an extended period. Some segments may fluctuate year over year, and occasionally the overall market may experience a decline. As unpredictable and vulnerable to outside influences as the commercial and industrial construction industry seems to be, the mechanical insulation industry continues to stand the test of time, and the future is looking promising. The recent pandemic, industry consolidation, and our country’s need for carbon reduction has reshaped—and will continue to reshape—our industry and its participating companies. The mechanical insulation industry is resilient and strong, and the drive for decarbonization is a massive opportunity for the industry.
When considering other technologies, existing or emerging, the use of mechanical insulation as a decarbonization strategy will not only further reduce emissions, it often can improve financial health, providing a return on investment in just months, lasting years.
All industrial and commercial buildings, private and government facilities, and sectors can benefit. Public and private school systems, universities/colleges, healthcare facilities, military installations, power and process industries, oil and gas industries, data processing centers, chip and other manufacturing facilities, etc. can experience the potential benefits of mechanical insulation systems—no company, community, or country is excluded.
The Laminated Metal Building Insulation Industry
Laminated MBI was excluded from the mechanical insulation segment because the survey methodology utilized was not applicable to laminated MBI. With the help of several metal building laminators, an approach and methodology for MBI was developed.
The survey’s goal is to provide valuable data regarding market size and growth rates for the U.S. laminated MBI market. The NIA members who participated in the survey provided information to an independent, third-party company. The company took that information and applied a formula created by the NIA to extrapolate the annual size of the laminated MBI industry in the United States.
The latest survey was conducted earlier in 2023 to determine industry growth from 2021 through 2022 and to obtain an indication of estimated growth for 2023 and 2024.
Survey results indicate that the market continued to grow by double digits in 2021 and 2022. As shown in Figure 5, the U.S. Laminated MBI market exceeded $542 million in 2021 (an 18.2% increase over 2020) and rose to $650 million in 2022 (a 19.8% increase from 2021).
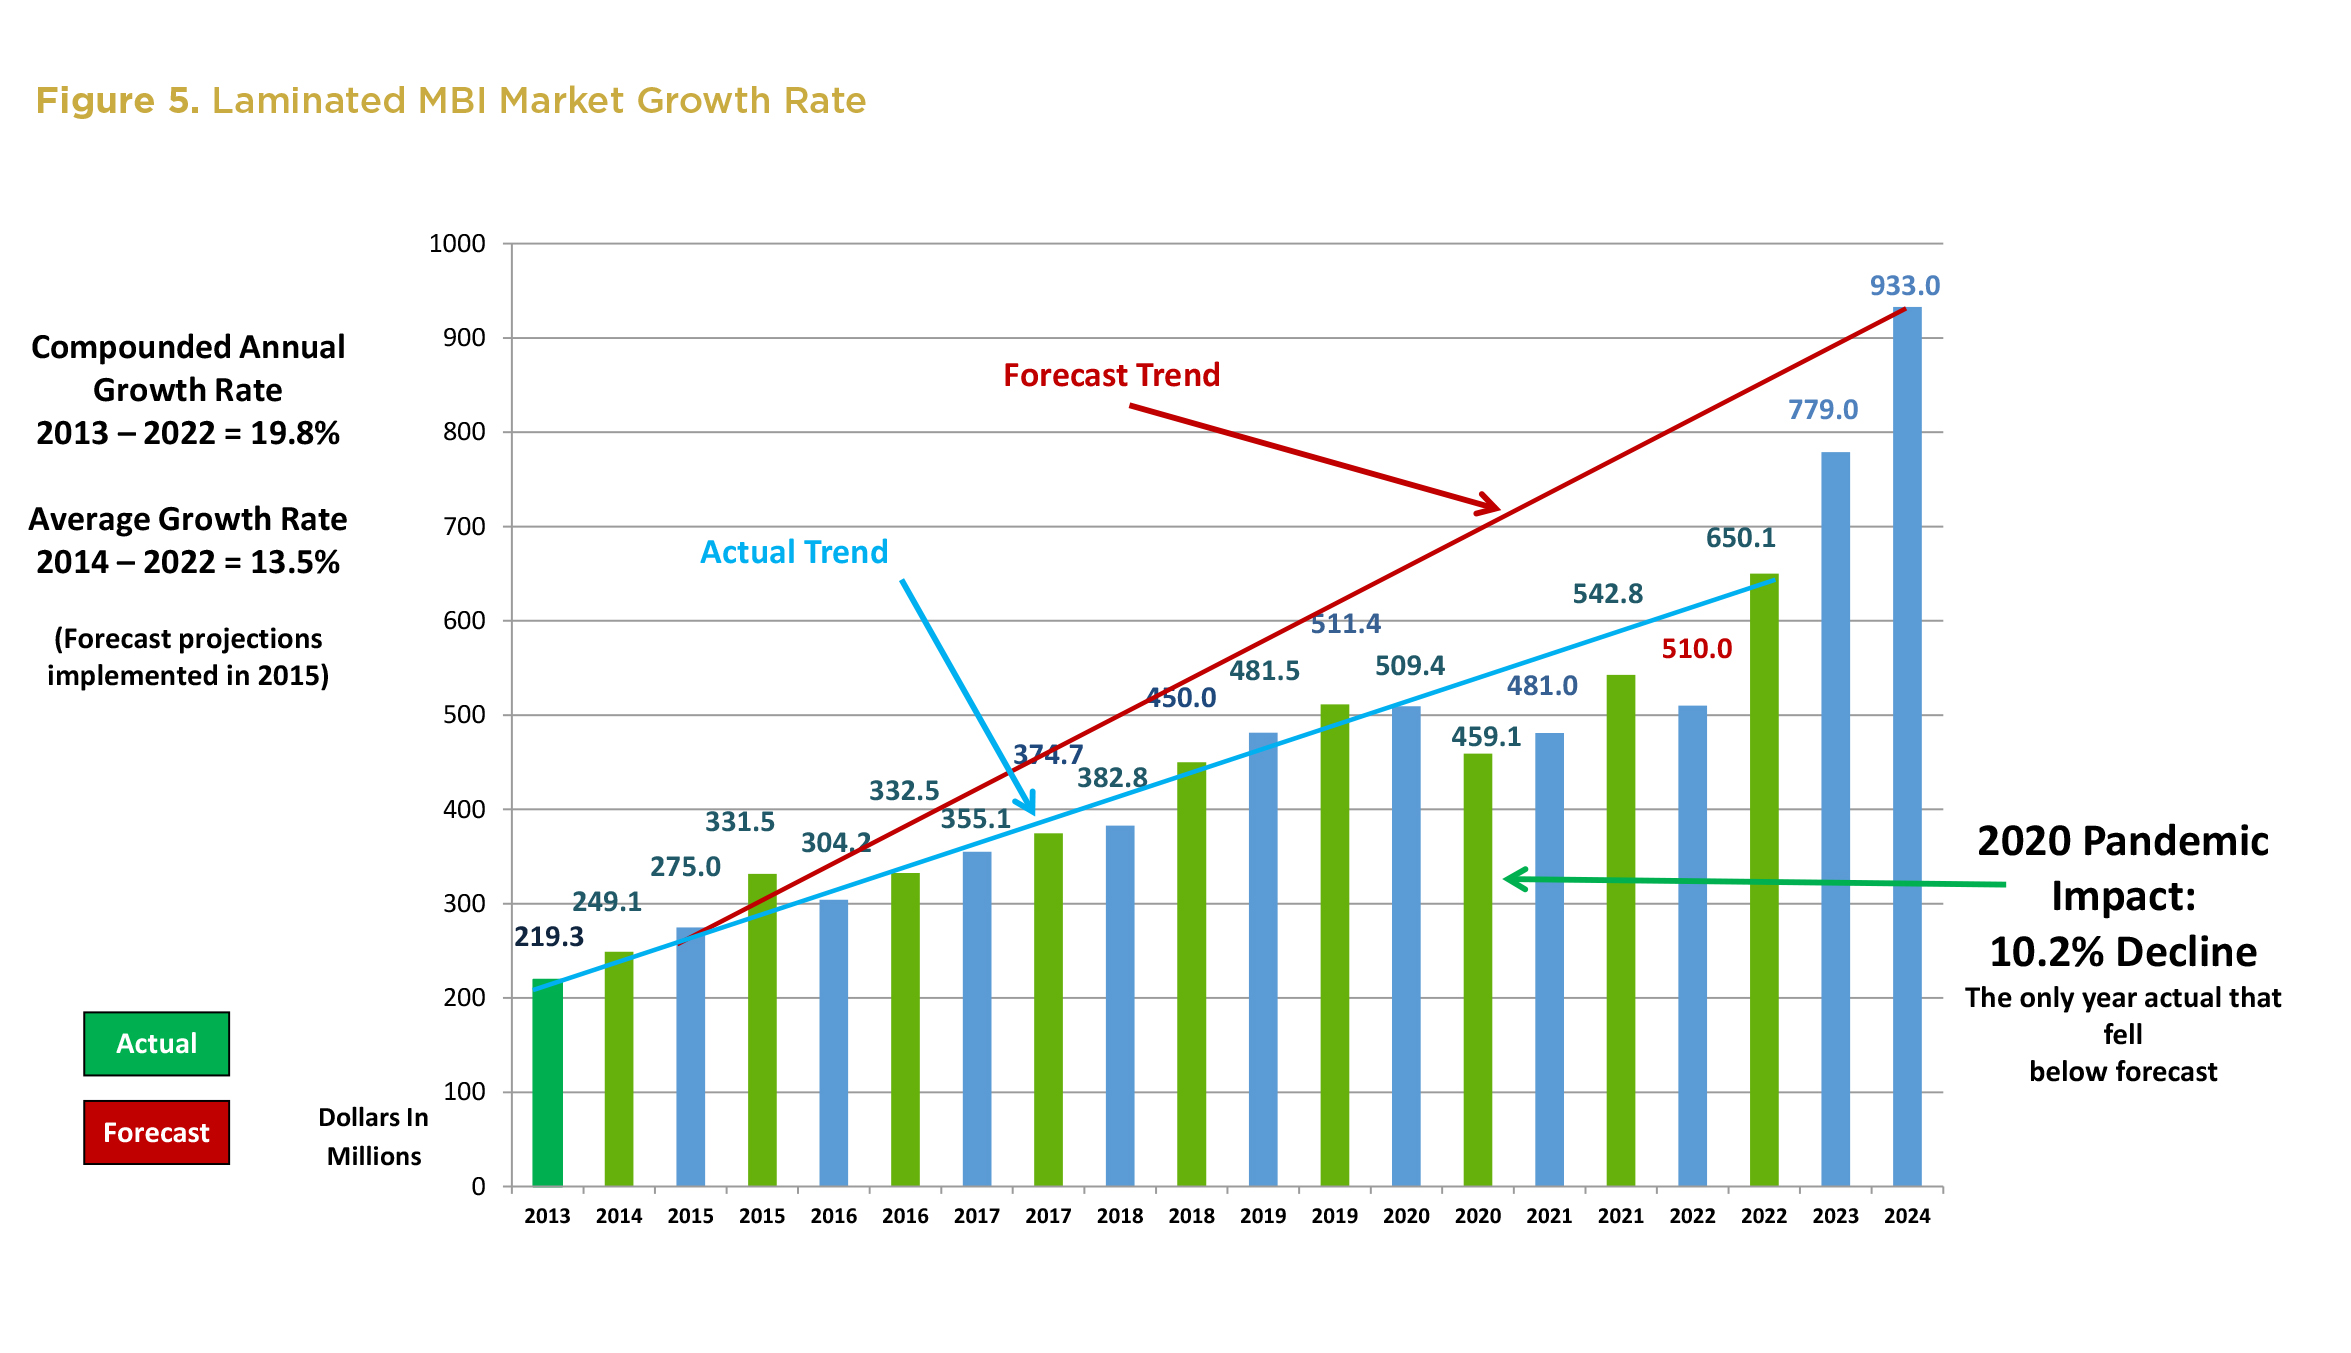
While the survey did not include projected growth rates for 2023 and 2024, high single-digit to low double-digit growth is expected.
The average annual growth rate since 2013 is 13.5%, and the compounded annual growth rate equals 19.8%. The market has essentially doubled in size from 2013–2014 levels. Those growth rates would be the envy of many industries.
It is important to note that the survey results have exceeded projections each year, with the exception of 2020, which suffered due to the impact of the pandemic. That trend is nothing less than impressive; and, if it continues, the market will surpass $1 billion in 2025.
The survey used the following general definition for laminated MBI products: all fiber glass insulation and jacketing products sold by manufacturers for use in developing (fabricating/laminating) laminated MBI systems. Using informal survey methods, the following were added to develop the final survey results: lamination accessory materials (adhesives, packaging, etc.), laminating labor, laminator margin (believed to have remained steady during the survey period), and delivery costs. The intent was for the survey to represent only laminated MBI, but the methodology employed may have captured some allowance for liner-type products.
As with the mechanical insulation survey, the results of laminated MBI survey are subject to individual interpretation. What follows is information about the survey and some takeaways that have been developed in conjunction with conversations before and after tabulation of the survey data.
- The survey is based upon dollars, not units, and a consistent approach has been utilized. Based on the survey methodology, the results should represent a conservative number. The survey does not include all the various products utilized in the laminated MBI market, nor has the potential impact of imported products from outside North America been considered.
- The survey is intended to show a national picture for the respective calendar year. Based upon observations and conversations, there are significant geographical and product variances to the survey results. This is consistent with a survey this broad in nature.
- Based upon an informal survey, it was felt that while laminator/fabricator margins’ varied geographically, the overall national average margin has not substantially changed—increased slightly—from the previous survey, and the ratio between core insulation and jacketing materials similarly has not changed substantially.
- Mechanical insulation and building insulation, including all accessory products, are excluded for the purposes of the survey.
Looking Forward
With the exception of 2020, with the impact of the pandemic, the laminated MBI market continues to sustain annual growth without regard to the fluctuations in the general economy. The market has essentially tripled in size from 2013 (i.e., in 10 years). No matter how you look at it, that is an impressive trend.
Conclusion
The Foundation, NIA, and this author appreciate the Associate members’ continued support and participation in this survey, which benefits all NIA members and the industry at large. For those that have not yet participated, we ask that you join with your colleagues in the next survey. The greater the participation, the better the data.
After a merciless year in 2020, which was marked indelibly by a global pandemic and economic calamity and uncertainty, the mechanical insulation and laminated MBI industries have endured, and not only rebounded but grown substantially.
The continued growth in both insulation industry segments demonstrates once again the strength, commitment, and continued enthusiasm of the companies and people within the industry.
The pandemic, consolidation, and the ever- fluctuating economy may have changed the way people live, work, travel, shop, and interact, but it has not changed the importance and value of insulation or the commitment and resolve of the people who work in the insulation industry.