Findings
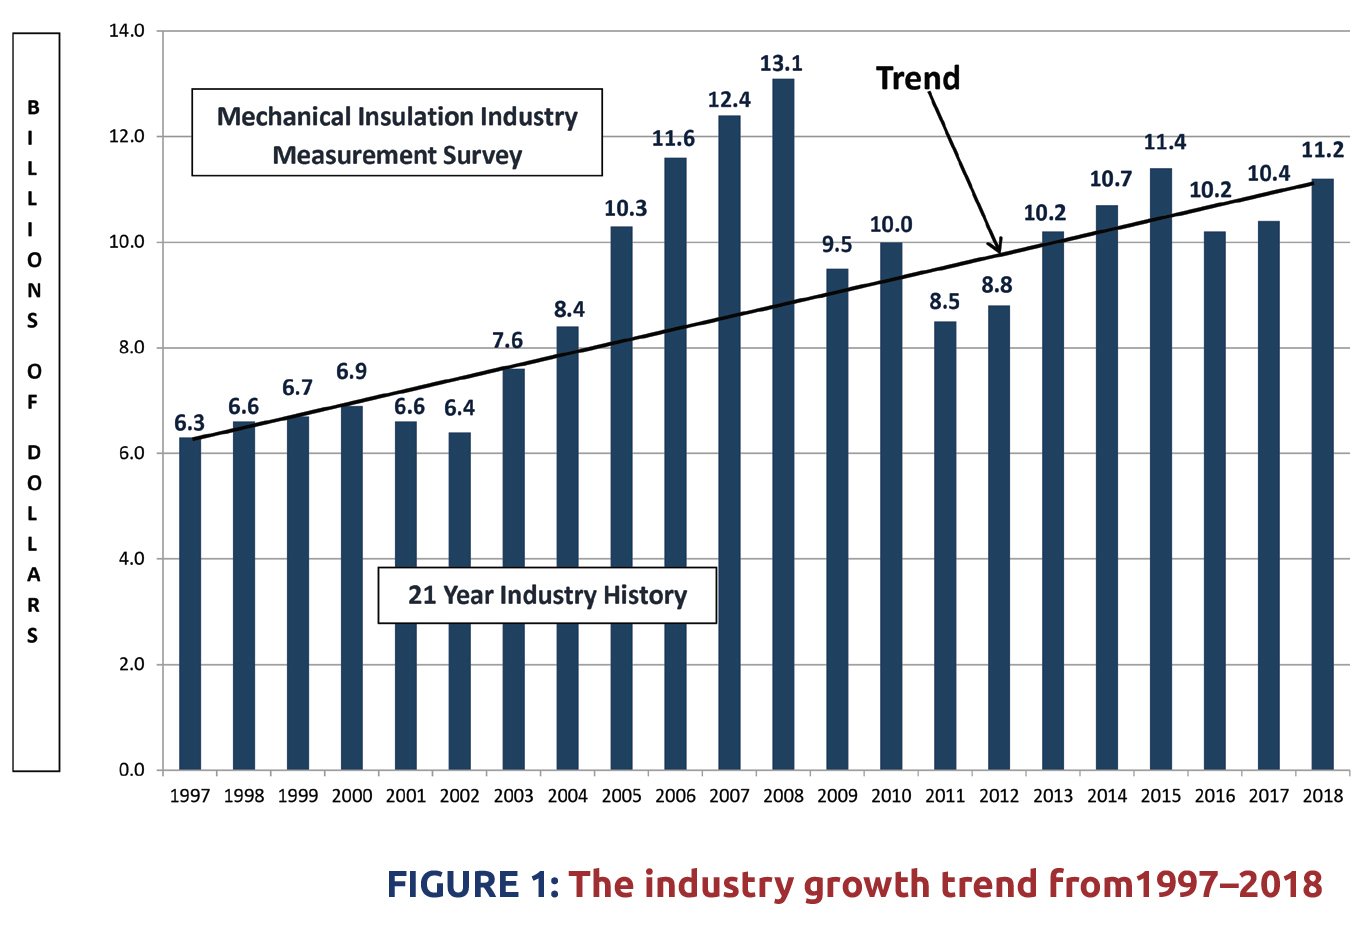
As we have seen with past surveys, industry growth is not uniform across market segments, the country, by region, state, or even within states. Figure 1 exhibits the industry growth trend over the last 21 years (1997–2018).
While the survey process does not provide a breakdown between what is generally referred to as the commercial and industrial market segments, informal analysis indicates the commercial and industrial market experienced growth in 2017 and in 2018.
To gain a more complete picture, NIA also conducts an informal survey regarding the ratio of labor to material among contractors, and sales margins among distributors and contractors.
Contractors reported a significant change in the labor to material ratio. In more recent surveys, the blended ratio in commercial and industrial industry segments, across all projects (new construction and maintenance) and type of contracts was estimated to be 72% labor and 28% material (72/28 ratio). The ratio changed to 71/29 in 2017 and 70/30 in 2018. The 2017 and 2018 ratios changed due to changes in both fields, with industrial having a stronger change.
The change is believed to be driven by a combination of the use of higher-cost insulation systems, major price increase adjustments with many materials driven by tariffs, raw material and freight cost, and a larger number of projects utilizing multiple layer/complex insulation systems specifically for cryogenic applications.
The ratio of labor to material varies between commercial and industrial projects and applications. The survey calculations are based on an estimated blended ratio. With the methodology utilized in the survey calculations, a change in the ratio can have a pronounced effect on the survey results.
The survey indicated that, on a national basis, there was gross margin improvement in both the distribution and contractor channels. More significant improvement was reported with this survey than in other recent surveys. This was expected and is not an uncommon occurrence when revenue opportunities are abundant—especially combined with a shortage of qualified workers.
With improving margins at the distributor and contractor levels, one might expect that the manufacturing segment experienced similar results, though we cannot know for certain since the survey looks exclusively at manufacturing sales volume.
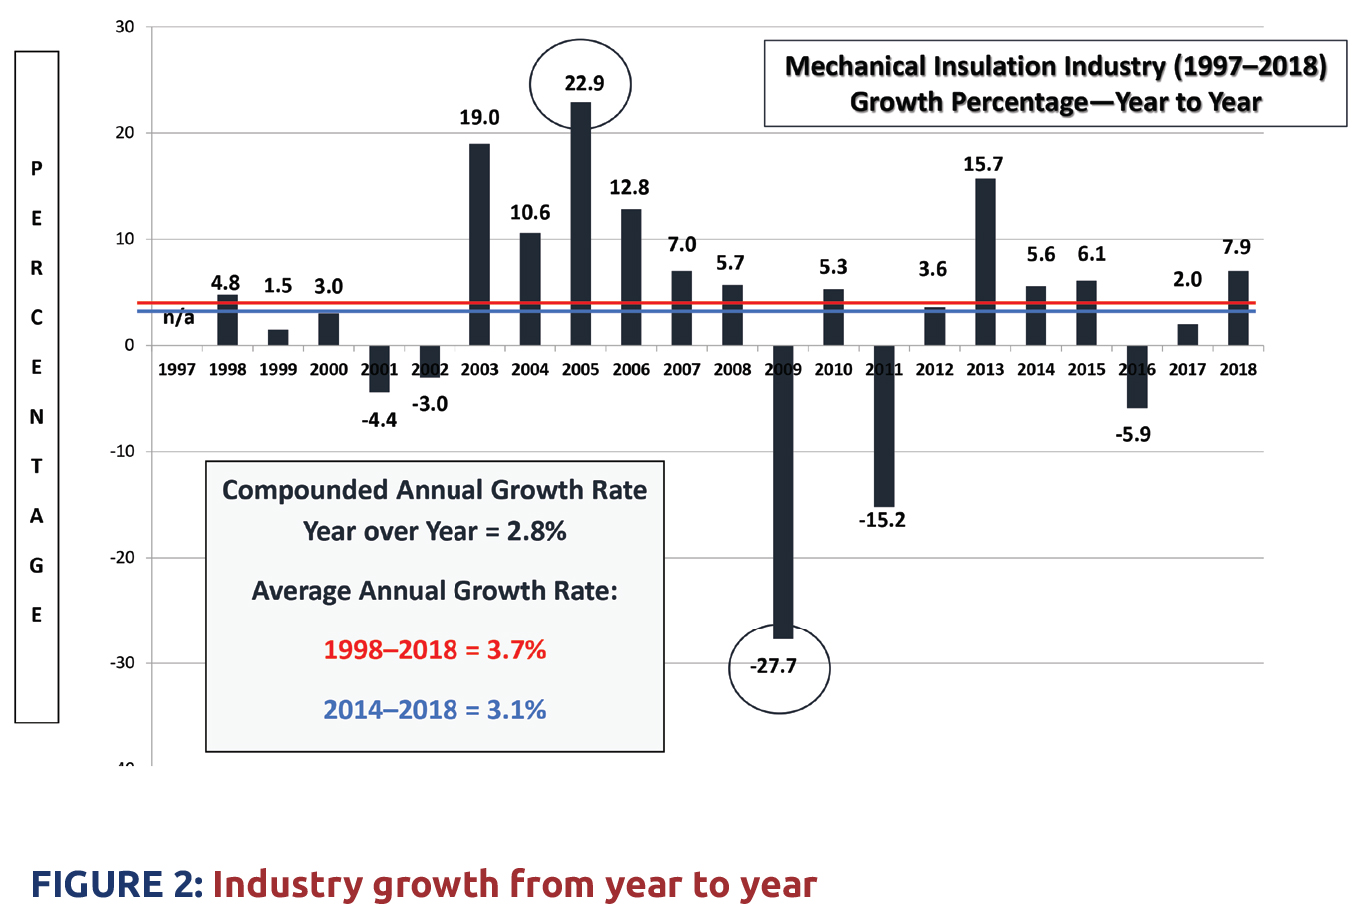
Figure 2 illustrates the industry growth percentage year to year. 2005 marked a high, with a 22.9% annual growth rate, while 2009 represented a decline of 27.7%. Annual fluctuations are to be expected and are caused mainly by changes in the overall economy. When analyzing the data in comparison to the economy, one needs to take into consideration that, due to construction cycles, the industry typically trails the economy between 9 and 15 months. The compounded annual growth rate—which refers to industry growth over the entire period—is 2.8%, while the average annual growth rate over that period is 3.7%. The average growth rate over the last 5 years is 3.1%.
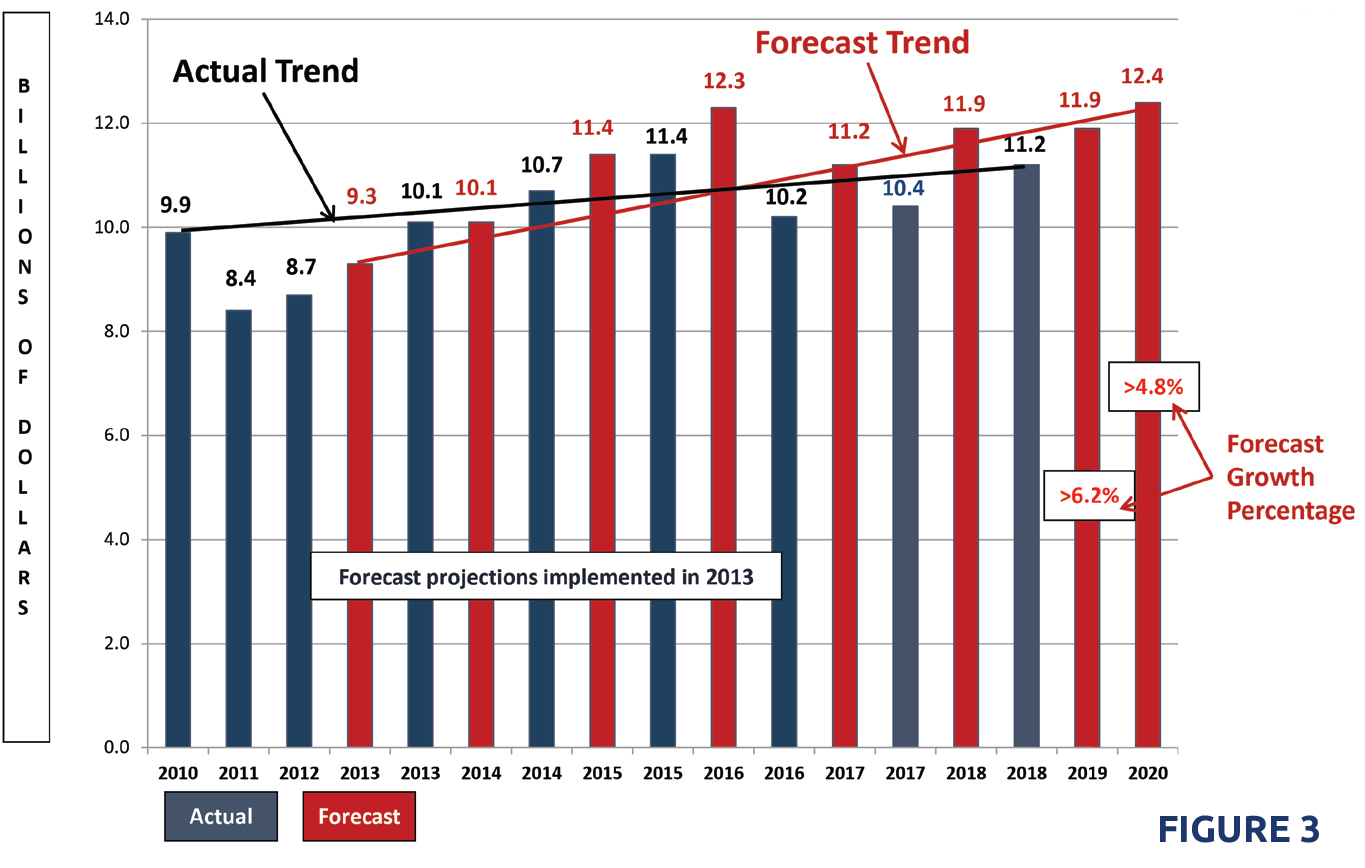
Beginning with the 2013–2014 survey, the survey respondents provided their forecasted growth over the preceding 2 years. The current survey indicates an expected average industry growth of 6.2% in 2019 and 4.8% in 2020.
The 2019 forecast varied from 3% to 18% for an average of 6.2%. If you remove the high and low numbers, the average is 5.6%. 45% of the increase is projected to be in unit growth, and the balance in dollar growth (price increases).
The 2020 forecast had a similar variance, from 3% to 9%. Without the high and low percentage, the average was 4.6%. The forecast was split evenly between unit and dollar growth.
Based upon the 2018 survey results, and compounding the forecast for 2019 and 2020, the mechanical insulation industry is projected to reach $12.4 billion in 2020.
Actual industry results were below forecasted levels for both 2017 and 2018. That difference was greatly impacted by the labor/material ratio change. If the same ratio would have been in effect for 2017, the results would have been 96.4% of forecast and 2018 would have equaled the forecast of $11.9 billion dollars.
Analysis of survey results is always subject to individual interpretation. In this case, considering the high-level basis of the forecast and the methodology employed to determine the survey results, the comparison of actual results versus the forecast is worthy of discussion.
Without adjusting the forecast or actual results for impacts due to unforeseen or uncontrollable events like unexpected changes in the economy, the change of the labor and material ratio, global events, and similar considerations, forecasted results have been reasonably close to actual results. Actual results met or exceeded the forecast in 2013–2015 and fell short from 2016–2018. Of those 6 years, 2016 was the only year that actual results were less than 90% of forecast—and that was the year that may have surprised many companies. While averages in this case may be less meaningful, over the 6-year period, actual results have been 99.1% of forecast.
Unfortunately, the survey methodology does not allow for differentiation between increases in unit or dollar growth or between industry segments. Based upon the informal survey results, both market segments had growth in 2017 and 2018. Unit growth may have been higher in 2017 than dollar growth, but 2018 may have seen more dollar growth.
The recent survey exhibited a similar ratio of accessory materials in comparison to primary core insulation materials. That may be indicative of more expensive finishing systems that are traditionally utilized in the industrial market being offset by the use of high-cost insulation systems.
Facility or shop fabrication hours of labor and related accessories/consumables were included in this survey, whereas prior to 2015 they were excluded. That addition had less than one tenth of a percent (.1%) impact on the results. All previous survey results have been adjusted to include a similar impact for year-over-year comparisons.
Survey Methodology and Assumptions
While survey results may be subject to interpretation, below are considerations and possible conclusions suggested by survey data.
- The survey is based upon dollars, not units, and a consistent approach has been utilized over the 21 years (1997–2018). Based on the survey methodology, the results should represent a conservative number.
- The survey does not include data related to metal building insulation; heating, ventilating, and air-conditioning (HVAC) duct liner; original equipment manufacturer products; building insulation; residential insulation; refractory products; other specialty insulations; or insulation products or technologies not currently encompassed in NIA’s scope of mechanical insulation products. The potential impact of imported products outside North America, which is believed to be minimal, also has not been included. The survey excludes major project scaffolding and similar project requirements. Informal surveys were conducted to determine margins and labor and material ratios. Variations in those results could affect the total insulation market estimate.
- Insulation products include any/all accessory products when sold as an integral part of the manufacturer’s products (e.g., all-service jacket [ASJ] or other facing on blanket, board, or pipe covering).
- The survey is intended to show a national picture for the respective calendar year. Results reveal significant geographical and product variances, which is not inconsistent with a survey of
this nature.
- The 2019 and 2020 forecasts seem to be reasonably in line with overall commercial and industrial construction market forecasts: a reasonably strong 2019, and a softer market in 2020. The forecast does not break out growth expectations between the commercial or industrial market segments, or between new construction, retrofits, and/or maintenance applications. Historically, a forecast of this nature includes a blend of these applications, with new construction being the largest percentage. Regardless, the growth forecasts are welcome news and some believe they may be conservative.
- Unfortunately, the survey methodology does not allow for interpretation between the commercial and industrial market segments, or between types of applications, contracts, or product types. The survey does allow for any analysis as to whether the increases or decreases were led by unit or dollar growth.
- The Foundation always requests survey participants to share detailed information about the insulation industry, but many are only willing to share general information, rather than detailed segment or business information. In addition, many products are fabricated into different shapes and shipped to various locations for use in multiple industry segments, which makes reporting or forecasting by industry segment difficult.
Looking Forward
The mechanical insulation market continues to exhibit compounded growth over an extended period. While some market segments may fluctuate year over year, and occasionally the overall market may experience a decline, the industry has experienced a 2.8% compounded annual growth rate over 22 years, and a 3.1% growth rate over the last 5 years (2014–2018). As unpredictable and vulnerable to outside influences as the commercial and industrial construction industry seems, those compounded growth rates indicate the mechanical insulation industry continues to stand the test of time, and the future is looking bright.
The Laminated Metal Building Insulation Industry
In the original industry-measurement surveys, dating back to 1997, laminated metal building insulation was excluded because the survey methodology used for mechanical insulation was not applicable. With the help of several metal building laminators, an approach and methodology for laminated metal building insulation was developed.
The survey's goal is to provide valuable data regarding market size and growth rates for the U.S. laminated metal building insulation market. The NIA members who participated in the survey provided information to an independent, third-party company. The company took that information and applied a formula created by NIA to extrapolate the annual size of the laminated metal building insulation industry in the United States. The latest survey was conducted in the first quarter of 2019 to determine industry growth from 2017 through 2018 and to obtain an indication of estimated growth for 2019 and 2020.
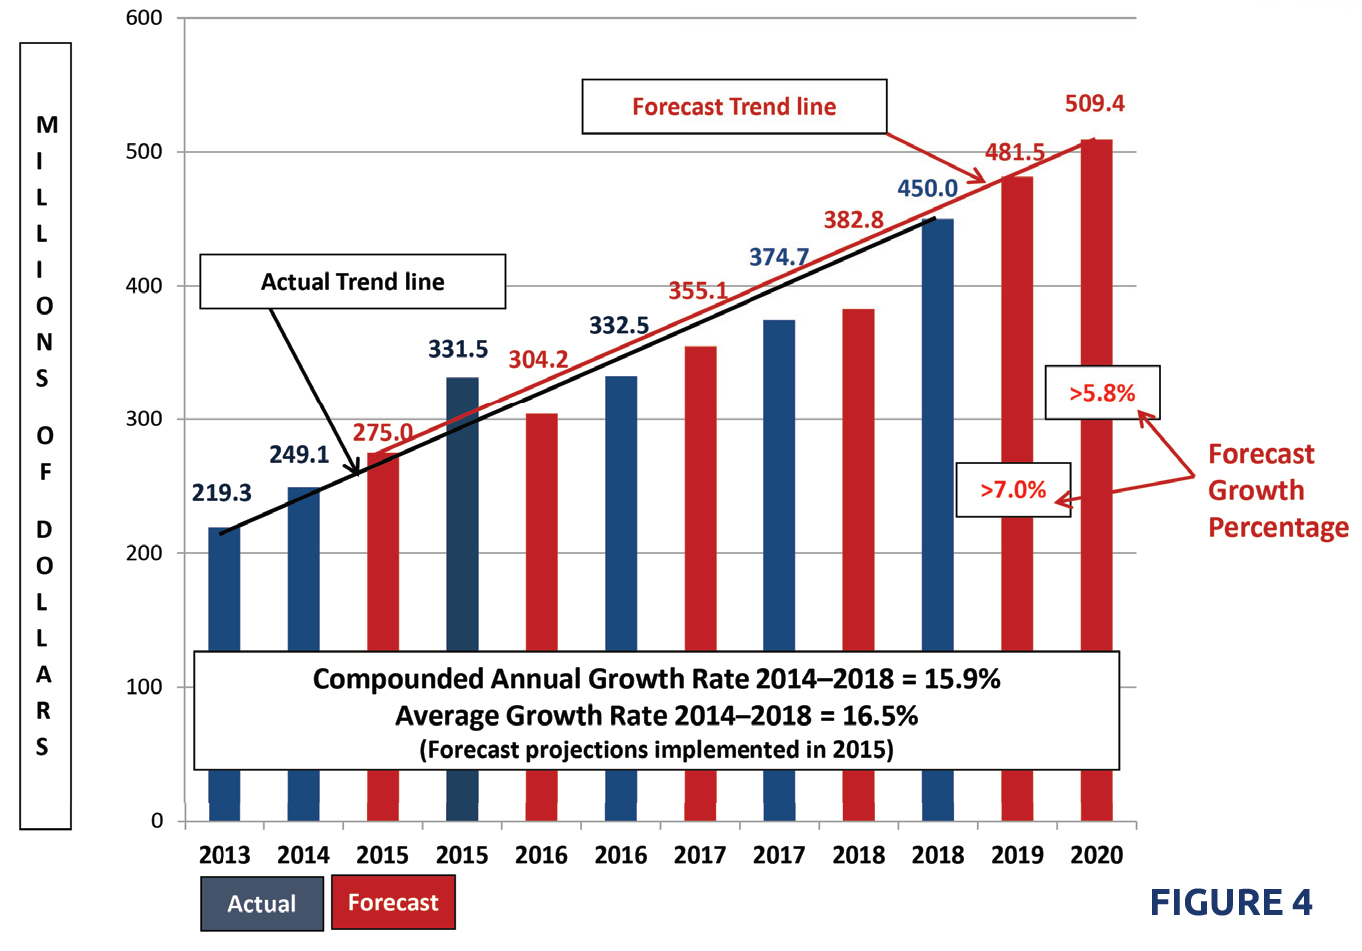
Survey results indicate that the market is continuing to grow at double-digit rates. As shown in Figure 4, the U.S. laminated metal building insulation market exceeded $374 million in 2017 (a 12.7% increase over 2016) and grew 20.1% in 2018 to $450 million. The market is forecast to reach $481.5 million in 2019 (a 7% increase over 2018), and over $509 million in 2020 (a 5.8% increase over 2019).
The average actual annual growth rate since 2013 is 16.5%, and the compounded annual growth rate for 2013–2018 equals 15.9%. The market has basically doubled in size in 6 years. Those growth rates are the of envy of many industries.
The survey included the following general definition for laminated metal building insulation products: all fiber glass insulation products and jacketing products sold by manufacturers for use in developing (fabricating/laminating) laminated metal building insulation systems. Using informal survey methods, the following were added to develop the final survey results: lamination accessory materials (adhesives, packaging, etc.), laminating labor, laminator margin (believed to have remained steady during the period), and delivery costs. The intent was for the survey to represent only laminated metal building insulation, but the methodology employed may have captured some allowance for liner-type products.
It is important to note that survey responses regarding 2019 forecast (7% growth) varied slightly from 6% growth to 8%. Overall growth was expected in both units and dollars (price increases) with 60% of the forecast increase coming from dollar growth. The variances were greater for the 2020 forecast (5.8% growth), ranging from 0% to 10%, with 60% coming from dollar growth. The greater variance in the dollar growth category may indicate some uncertainty among the respondents as to sustainability of dollar growth in 2020.
In the 4 years that the survey has included forecast information, the actual results have exceeded forecasts by an average of 13.2%. That indicates the markets have been stronger than anticipated, or perhaps some responders are underreporting. Regardless, that trend is nothing less than impressive; if it continues, the market will exceed $600 million in 2022.
As with the mechanical insulation survey, the results of the Laminated Metal Building Insulation Industry survey are subject to individual interpretation. The following paragraphs offer survey considerations and possible conclusions suggested by survey data.
- The survey is based upon dollars, not units, and a consistent approach has been utilized. Based on the survey methodology, the results should represent a conservative number. The survey does not include all of the various products utilized in the metal building insulation market, nor has the potential impact of imported products outside North America been included.
- The survey is intended to show a national picture for the respective calendar year. The significant geographical and product variances in survey results are not inconsistent with a survey of this nature.
- Based upon an informal survey, it appears that while laminator/fabricator margins varied geographically, the overall national average margin has not substantially changed from the previous survey, nor has the ratio between the core insulation and jacketing materials. However, there was margin improvement in 2017 and in 2018.
- Mechanical insulation and building insulation, including all accessory products, are excluded for the purposes of this survey.
- The 2019 and 2020 forecasts seem to be reasonably in line with the overall commercial construction market forecast. The forecast does not break out growth expectations between new construction, retrofits, or maintenance applications. Historically, a forecast of this nature includes a blend of each, with new construction being the largest percentage. Regardless, the growth forecasts are good news.
Conclusion
Results from both survey segments show continued growth. The laminated metal building insulation
market continues to sustain impressive annual growth and if that trend continues, the industry could reach the $500 million plateau by 2020.