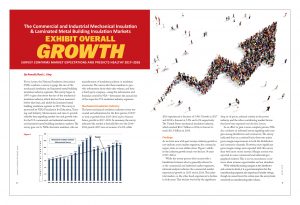
The Commercial and Industrial Mechanical Insulation & Laminated Metal Building Insulation Markets Exhibit Overall Growth
Every 2 years, the National Insulation Association (NIA) conducts a survey to gauge the size of the mechanical insulation and laminated metal building insulation industry segments. This survey began in 1997 to gain data about the size of the mechanical insulation industry, which had not been measured before that time, and added the laminated metal building insulation segment in 2013. The survey is sponsored by NIA’s Foundation for Education, Training, and Industry Advancement, and aims to provide valuable data regarding market size and growth rates for the U.S. commercial and industrial mechanical and laminated metal building insulation markets. The survey goes out to NIA’s Associate members, who are manufacturers of insulation products or insulation accessories. The survey asks those members to provide information about their sales volume, and then a third-party company—using this information and formulas created by NIA—determines the annual size of the respective U.S. insulation industry segments.
Mechanical Insulation Industry
The latest mechanical insulation industry survey was created and administered in the first quarter of 2017 to look at growth from 2015–2016 and to forecast future growth in 2017–2018. In summary, the survey indicated the market is basically flat over the 2014–2016 period. 2015 saw an increase of 6.1%, while 2016 experienced a decrease of 5.9%. Growth in 2017 and 2018 is forecast at 5.5% and 6.1% respectively. The United States mechanical insulation industry, which reached $10.7 billion in 2016, is forecast to reach $11.9 billion in 2018.
Findings
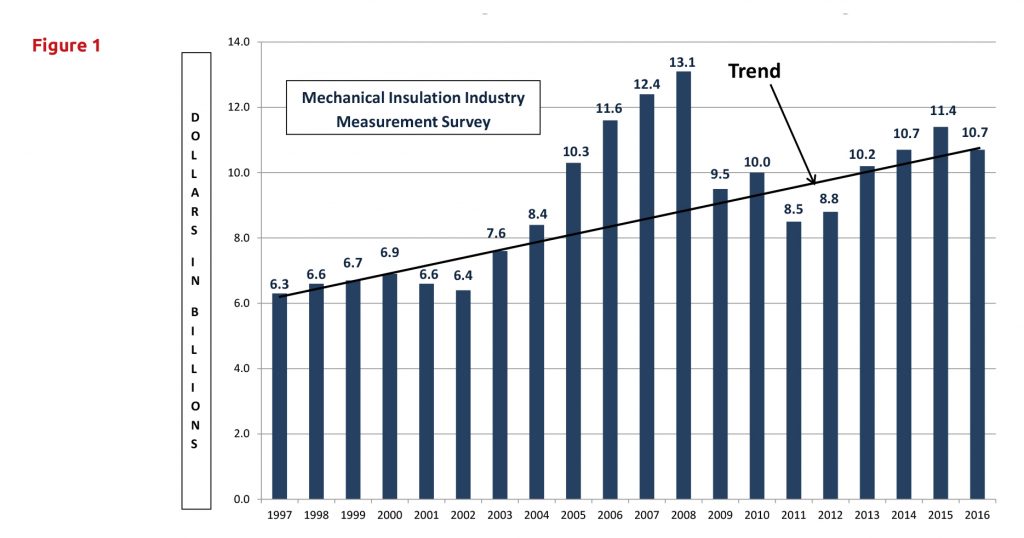
As we have seen with past surveys, industry growth is not uniform across market segments, the country, by region, state, or even within states. Figure 1 exhibits the industry growth trend over the last 19 years (1997–2016).
While the survey process does not provide a breakdown between what is generally referred to as the commercial and industrial market segments, informal analysis indicates the commercial market experienced growth in 2015 and in 2016. The industrial market, on the other hand, experienced a decline in both years. That decline was led by the significant drop in oil prices, reduced activity in the power industry, and the other contributing market factors that have been reported over the last 2 years.
In an effort to gain a more complete picture, NIA also conducts an informal survey regarding sales margins among distributors and contractors. The survey indicated that on a national basis, there was minor gross margin improvement in both the distribution and contractor channels. However, more significant gross margin swings were reported with this survey than with more recent surveys. Margin erosion was reported in some commercial and industrial geographical markets. This is not an uncommon occurrence when revenue opportunities are less abundant.
With widely fluctuating margins at the distributor and contractor levels, it is a good assumption that the manufacturing segment also experienced similar swings, though we cannot know for certain since the survey looks exclusively at manufacturing sales volume.
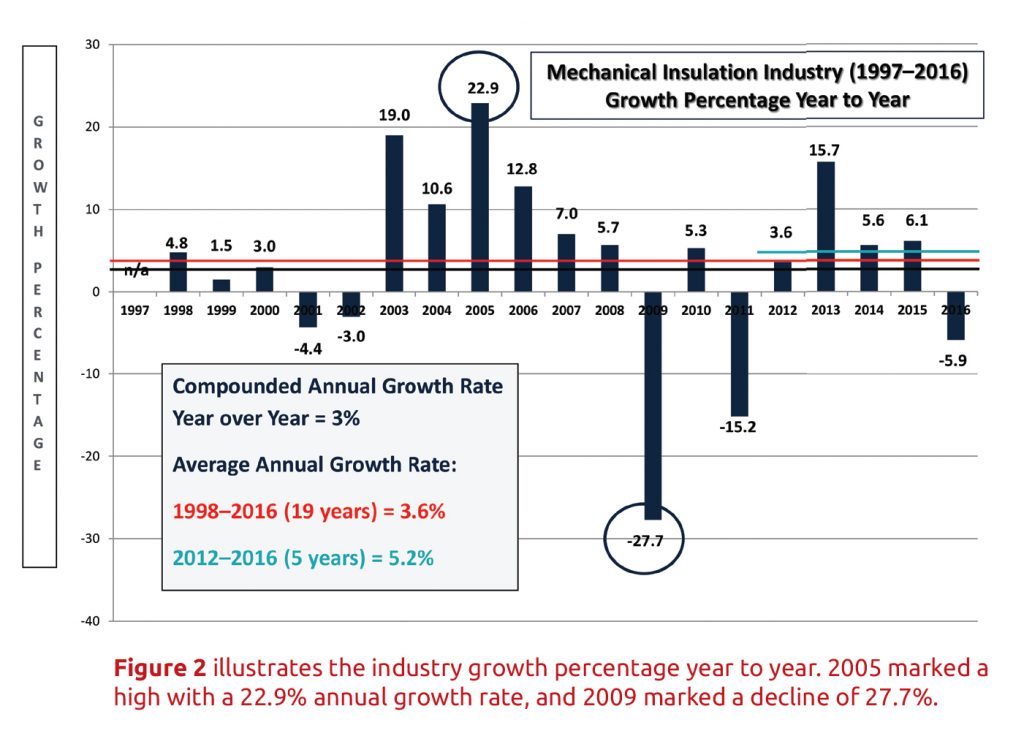
Figure 2 illustrates the industry growth percentage year to year. 2005 marked a high with a 22.9% annual growth rate, and 2009 marked a decline of 27.7%. Annual fluctuations are to be expected and are caused mainly by changes in the overall economy. When analyzing the data in comparison to the economy, you need to take into consideration that, due to construction cycles, the industry typically trails the economy between 9 and 15 months. The compounded annual growth rate—which refers to industry growth over the entire 19-year period—is 3%, while the average annual growth rate over that period is 3.6%. The average growth rate over the last 5 years is 5.2%.
Beginning with the 2013–2014 survey, the survey respondents provided their forecasted growth over the preceding 2 years. The current survey indicates an expected average industry growth of 5.5% in 2017 and 6.1% in 2018. Actual industry results were at or above forecasted levels with the exception of 2016. That difference is believed to be primarily attributable to the industrial segment and the unforeseen decline in oil prices.
It is important to note the 2016 and 2017 forecasts varied greatly, ranging from 0% growth to 15%. Growth was expected in both units and dollars (price increases). On average, 62% of the 2017 growth forecast was derived from unit growth while 2018 was split 50/50 between unit and dollar growth. Unfortunately the survey methodology does not allow for differentiation of those increases by market segment.
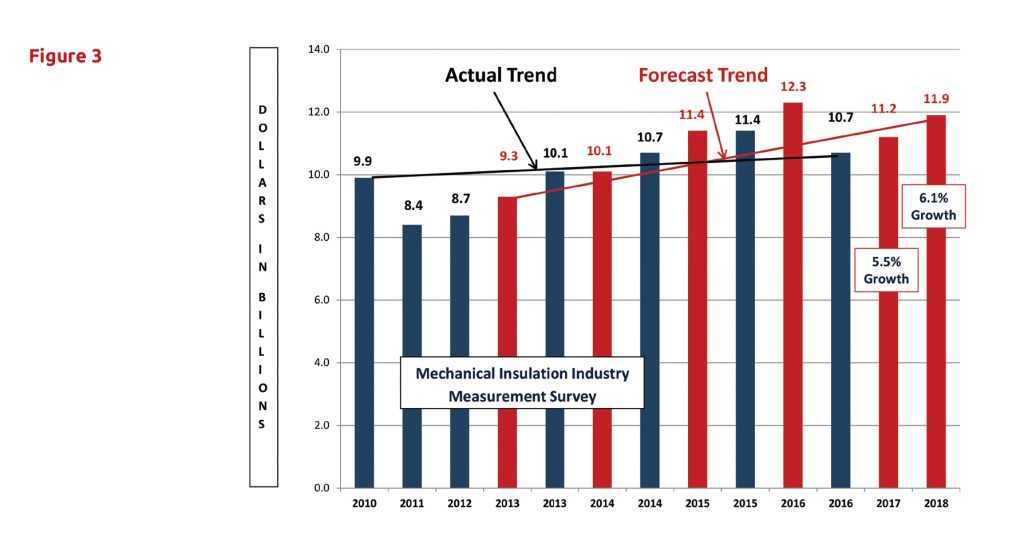
The 2014 survey respondents indicated that they expected a 7.0% increase in 2015 over 2014 and a 7.3% increase in 2016 over 2015. The actual results were 6.1% and -5.9%, respectively. In dollars, the projected and actual market size was $10.7 billion in 2015. For 2016, the projected market was size was $12.7 billion, but the actual was $10.7. If growth expectations are achieved through 2018, the industry size will be $11.9 billon.
For the 4 year period (2013–2016) actual growth exceeded or met forecast 3 of the 4 years. If you consider the 2013 forecast in relationship to the 2018 forecast, the forecasted compounded growth rate would be 5.6%. Assuming the actual for 2017 and 2018 are at forecasted levels, the actual compounded growth rate would also be 5.6%.
The recent survey also exhibited a lower ratio of accessory materials in comparison to primary core insulation materials. It is believed this decrease is indicative of the decline in the industrial market for more expensive finishing systems that are traditionally utilized in that market.
Facility or shop fabrication labor and related accessories/consumables have been included in this survey, whereas in past surveys, they had been excluded. That addition had less than one tenth of a percent (.1%) impact on the results. All previous survey results have been adjusted to include a similar impact.
Survey Methodology and Assumptions
Survey results are always subject to individual interpretation. Following is some information about the survey and some potential takeaways that have been developed in conjunction with conversations before and after the tabulation of the survey data.
• The survey is based upon dollars, not units, and a consistent approach has been utilized over the 20 years (1997–2016). Based on the survey methodology, the results should represent a conservative number.
• The survey does not include data related to metal building insulation; heating, ventilating, and air-conditioning (HVAC) duct liner; original equipment manufacturer products; building insulation; residential insulation; refractory products; other specialty insulations; or insulation products or technologies not currently encompassed in NIA’s scope of mechanical insulation products. The potential impact of imported products outside North America, which is believed to be minimal, has not been included. The survey excludes major project scaffolding and similar type project requirements. Informal surveys were conducted to determine margins and labor and material ratios. Variations in those results could affect the total insulation market estimate.
• Insulation products include any/all accessory products when sold as an integral part of the manufacturer’s products (i.e., all-service jacket [ASJ] or other facing on blanket, board, or pipe covering).
• The survey is intended to show a “national” picture for the respective calendar year. Based upon observations and conversations, there are significant geographical and product variances to the survey results. This is not inconsistent with any survey of this broad nature.
• The 2017 and 2018 forecasts seem to be reasonably in line with overall commercial and industrial construction market forecasts. The forecast does not break out growth expectations between the commercial or industrial market segments or between new construction, retrofits, and/or maintenance applications. Historically, a forecast of this nature includes a blend of these applications with new construction being the largest percentage. Regardless, the growth forecasts are welcome news and some believe they may be conservative.
• Unfortunately, the survey methodology does not allow for interpretation between the commercial and industrial market segments, or between type of applications, contracts, or product types. The survey also does allow for any analysis as to whether the increases or decreases were led by unit or dollar growth.
• The Foundation always requests survey participants to share detailed information about the insulation industry, but many are only willing to share general information, rather than detailed segment or business information. In addition, many products are fabricated into different shapes and shipped to various locations for use in multiple industry segments, which makes reporting or forecasting by industry segment difficult.
Looking Forward
The mechanical insulation market continues to exhibit compounded growth over an extended period. While some market segments may fluctuate year over year and occasionally the overall market may experience a decline (as it has 5 times since 1997), the industry as a whole has experienced a 3% compounded annual growth rate over 19 years and 5.1% growth rate over the last 5 years (2012–2016). As unpredictable and vulnerable to outside influences as the commercial and industrial construction industry seems to be, those compounded growth rates indicate the mechanical insulation industry is standing the test of time.
The Laminated Metal Building Insulation Industry
As previously mentioned, NIA has been conducting an industry-measurement survey for the mechanical insulation market since 1997. Laminated metal building insulation was excluded from that survey because it could not be applied to the survey methodology utilized for mechanical insulation. With the help of several metal building laminators, an approach and methodology for laminated metal building insulation was developed and data for this industry segment was collected for the first time for 2013.
The survey’s goal is to provide valuable data regarding market size and growth rates for the U.S. laminated metal building insulation market. The NIA members who participated in the survey provided information to an independent third-party company. The company took that information and applied a formula created by NIA to extrapolate the annual size of the laminated metal building insulation industry in the United States. The latest survey was conducted in the first quarter of 2017 to determine industry growth from 2015 through 2016 and to obtain an indication of growth for 2017 and 2018.
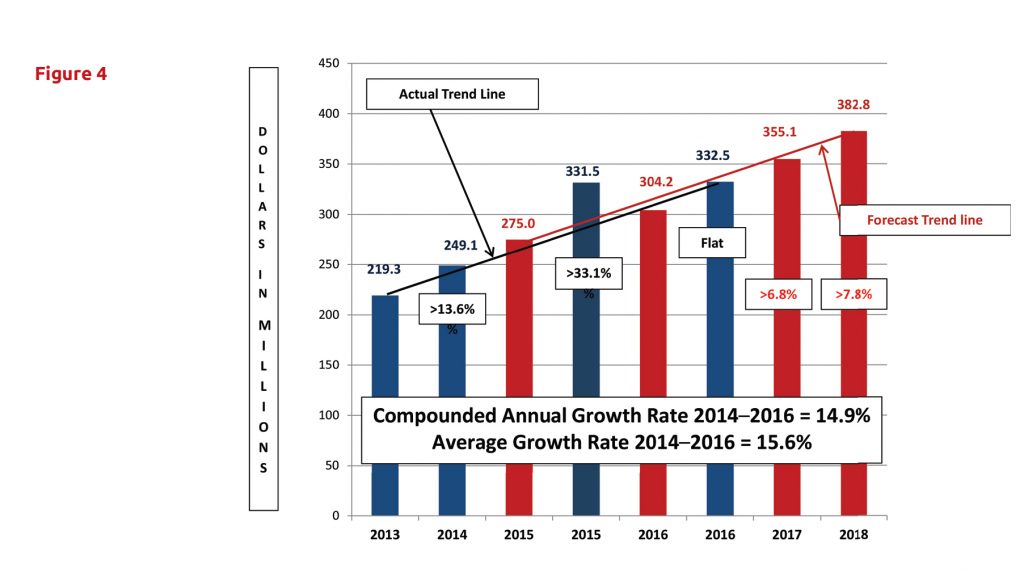
Survey results indicate that the market is continuing to grow. As shown in Figure 4, the U.S. laminated metal building insulation market exceeded $331 million in 2015 (a 33.1% increase over 2014) and grew slightly in 2016 to $332 million. The market is forecast to reach $355 million in 2017 (a 6.8% increase over 2016), and over $382 million in 2018 (a 7.8% increase over 2017).
The average actual annual growth rate since 2013 is 15.6%. The compounded annual growth rate since 2013–2016 equals 14.9%. If actual results equal the 2017 and 2018 forecast, the compounded growth rate from 2013 (6 years) will equate to 11.9%. Those rates are worthy of envy from many industries.
The survey included the following general definition for laminated metal building insulation products: all fiber glass insulation products and jacketing products sold by manufacturers for use in developing (fabricating/laminating) laminated metal building insulation systems. Using informal survey methods, the following were added to develop the final survey results: lamination accessory materials (adhesives, packaging, etc.), laminating labor, laminator margins, and delivery costs. The intent was for the survey to represent only laminated metal building insulation, but the methodology employed may have captured some allowance for liner-type products.
It is important to note that survey responses in regard to 2017 and 2018 forecasts varied from 3% growth to 10%. Overall growth was expected in both units and dollars (price increases). On average, approximately 50% was from unit growth, which illustrates core industry growth or increased demand for products and services.
Survey results are always subject to individual interpretation. The following is some information about the survey and some potential takeaways that have been developed in conjunction with conversations before and after the tabulation of the survey data.
• The survey is based upon dollars, not units, and a consistent approach has been utilized. Based on the survey methodology, the results should represent a conservative number. The survey does not include all of the various products utilized in the metal building insulation market nor has the potential impact of imported products outside North America been included.
• The survey is intended to show a national picture for the respective calendar year. Based upon observations and conversations, there are significant geographical and product variances to the survey results. This is not inconsistent with any survey of this broad nature.
• Based upon an informal survey, it was felt that while laminator/fabricator margin variances varied geographically, the overall national average margin had not changed since the previous survey, nor had the ratio between the core insulation and jacketing materials.
• Mechanical insulation and building insulation, including all accessory products, are excluded for the purposes of this survey.
• The 2017 and 2018 forecasts seem to be reasonably in line with the overall commercial construction market forecast. The forecast does not break out growth expectations between new construction, retrofits, or maintenance applications. Historically, a forecast of this nature includes a blend of each with new construction being the largest percentage. Regardless, the growth forecasts are welcome news.
Conclusion
The laminated metal building insulation market continues to sustain annual growth without regard to the fluctuations in the economy. If that trend continues, the industry could reach the $500 million level by 2020.
Copyright Statement
This article was published in the June 2017 issue of Insulation Outlook magazine. Copyright © 2017 National Insulation Association. All rights reserved. The contents of this website and Insulation Outlook magazine may not be reproduced in any means, in whole or in part, without the prior written permission of the publisher and NIA. Any unauthorized duplication is strictly prohibited and would violate NIA’s copyright and may violate other copyright agreements that NIA has with authors and partners. Contact publisher@insulation.org to reprint or reproduce this content.