Category Archives: Global

The construction industry has traditionally emphasized efficiency over environmental harmony. However, the trend toward “green building” is sweeping the country and changing this mindset dramatically. Whether green building is being encouraged for altruistic reasons or simply as a “politically correct” marketing technique, one thing is certain: Green building is here to stay. McGraw-Hill Construction estimates that green building will represent more than 10 percent of the nonresidential market by 2010. Subcontractors who quickly educate themselves and implement green building strategies will position themselves to successfully compete in a rapidly growing market and find that green is still the color of money.

What Is Green Building?

The goal of green building is to reduce the impact of construction on the environment and to promote human health and energy efficiency. Many proponents of green building believe that, for a nominal cost, dramatic operations and maintenance savings can be realized over the long run, in addition to a reduced environmental impact or “footprint.”

Frequently, but not always, the rating system used to evaluate green buildings is the U.S. Green Building Council’s LEED® system. (LEED stands for Leadership in Energy and Environmental Design.) LEED includes rating systems for different types of construction (e.g., homes, commercial, and institutional) and four levels of certification, ranging (from highest to lowest) from Platinum to Gold, Silver, and Certified. When an applicant (usually the project owner) seeks LEED certification of a building, a rating service company awards a certain number of points to the project based on different factors of design, construction, materials, water efficiency, and waste removal. Achieving one of the levels of LEED certification requires a collaborative approach throughout the project, because no single party on the construction team—owner, architect, contractor, subcontractor, or supplier—controls all the factors for which points may be awarded.

Subcontractors should be aware that green building may also mean something other than LEED certification. In recent years, a number of municipalities and states have adopted their own green building codes. For example, California adopted standards designed to achieve a reduction of 15 percent in energy and 50 percent in landscape water use. Other green rating systems exist as well.

What Are the Risks for Contractors?

For many subcontractors, the future business opportunities presented by green building are almost boundless, but as with any exciting opportunity, there are risks as well.

First, subcontractors should generally expect to incur many more hours of paperwork on a green building job as they need to document the “chain of custody” on materials and conform to other green building requirements. For example, the specifications may require a casework subcontractor to prove that the wood materials came from a local source. Contractors need to read the bid documents carefully and include adequate costs for these additional requirements in their bids.

Second, many bid documents will list a particular product or process to use to try to gain as many LEED points as possible. But what happens if the specified material (e.g., drywall from a source within 500 miles of the project) is not available in a timely fashion, or at a reasonable price? Will the subcontractor receive a time extension or a price increase to provide the owner’s desired product?

Third, some bid documents require subcontractors to attest to the quality of their work for LEED certification purposes. However, such a guarantee leaves subcontractors wide open to claims in case the project does not attain that level of LEED certification.

Because subcontractors don’t have the responsibility for all the factors, including design, that determine whether a building can earn LEED (or any other green) certification, generally they shouldn’t guarantee LEED certification or any given result. Unless acting as a true design-builder, a subcontractor is not hired to design and can only guarantee to build “per plans and specs.” Whether that design, as constructed, can achieve LEED or other certification is unknown and cannot be controlled by the subcontractor. Similarly, a certain end performance, such as energy savings, may be difficult to predict or control.

Design professionals should be reluctant to guarantee or promise certification results, as they do not control the waste stream or other construction efforts, nor do they know exactly how the third-party rating service will evaluate the submission for certification at the end of the job.

What Can You Do to Minimize Risk?

Subcontractors who want to make it clear they cannot guarantee results on a project seeking LEED certification might use simple contract language such as:

“Notwithstanding anything to the contrary, Subcontractor does not warrant or guarantee any result with respect to LEED certification.”

To avoid guaranteeing that material will secure points for LEED certification, subcontractors could insert language on submittals such as the following:

“With this submittal, Subcontractor makes no representation that this material will satisfy the requirements needed for LEED credit.”

Subcontractors will want to modify their force majeure clauses to entitle them to additional time in the event that a green source becomes unexpectedly unavailable, just as they are entitled to extensions in the event of an unexpected disaster or shortage.

Design professionals and design-builders may find it preferable to state that they will simply “endeavor to” achieve certification or exercise “good faith” efforts in that regard, rather than provide a guarantee.

How Should Risk Be Allocated and Insured?

All members of the construction team benefit from educating one another on reasonable expectations up-front before misunderstandings or conflicts develop. This is particularly true when dealing with an emerging subject like green building. Of course, there is always a risk of a claim on any project. Special green liability insurance is becoming available, and subcontractors should seek assistance from an experienced insurance professional to determine what policies are best for them in the event of a claim. Risk allocation on green building projects will become easier when ConsensusDOCS publishes its planned green addendum for construction projects. Set for release in late 2009, the addendum will help clarify the responsibilities and risk allocation on green projects.

Green building is far more than a fad and has the potential to dramatically improve the environment. As sustainability becomes increasingly important, subcontractors who adopt the strategies to work on green building projects will be well situated to compete against those unwilling to change.

This article originally appeared in The Contractor’s Compass and is reprinted with permission of the American Subcontractors Association and Naylor, Inc.

Disclaimer: This discussion is generalized in nature and should not be considered a substitute for professional advice. Readers are advised to contact counsel before embarking on any of the options discussed in this article.

These days, the talk of web visibility through social media tools and its ever-growing popularity is commonplace in mainstream media. Millions of savvy consumers are already way ahead of the business world and have been using social media tools for years. Certainly retailers, small business owners, and professional service providers can find value in these tools. Yet, many wonder what manufacturers and contractors could possibly accomplish from the high-traffic lanes of Twitter, Facebook, LinkedIn, YouTube, and other social media network tools. The answer is simple. People are discussing your products and services with your customers and potential customers—you just don’t know it.

Social media is in general terms defined as “the multitude of activities that integrate technology, social interaction, and the construction of words, pictures, videos, and audio.” In short, social media is changing the way in which the universe communicates. Yes, that includes insulation providers, installers, and consumers too.

Large established companies in this industry are found on LinkedIn and Twitter and use YouTube to teach customers how to properly install their insulation. Meanwhile, other companies use YouTube to introduce people to their companies via video plant tours.

Social media is not a fading trend; it is a fundamental shift in how we communicate. The old communication model was a monologue aimed at customers, but with today’s shift toward transparency, the new communication model is a dialogue. The good news is that 78 percent of people trust the recommendations of other consumers.1 That’s where social media and web visibility come into play.

Many people are talking about your brand and/or service right now. If you are not part of the conversation, you are taking a chance by trusting that the information being provided is accurate and honest. By engaging in social media, you increase the odds that well-informed consumers are the ones telling the story, and by using search engine visibility tools, you are helping spread your message to the right places.

Social networks are not just for family, friends, and direct sells; they are for everyone and every business. You need to be prepared to fully engage with them. Listen to the conversations about your company and the insulation industry. Understand what is being said and get a solid understanding of what you should say; try not to focus solely on an angle to enter the conversation, or selling. The goal is not to control the conversation, but to engage consumers directly so they become enabled, inspired, and influenced by your brand. People buy when they are ready to buy, and when they are ready to buy they ask their social networks. This is when your brand and/or service will be promoted, and the resultant positive exposure will be nearly incalculable.

Social media is a tool, not magic. When used correctly social media marketing can lead to an increase in website traffic, an increase in sales leads, enhanced brand awareness, a widened business network, and stronger relationships with your customers.

The most common question asked by companies interested in pursuing social media web marketing is “Where will we find the time to update all this stuff?” In the coming issues of Insulation Outlook, I will share with you practical tips and shortcuts designed to help you manage your social media activities with little time and effort.

Social media is dramatically changing the way that people access information about you and your business. Take your business to the next level and join the conversation.

Note

  1. University of Connecticut, Department of Economics: IDEAS: www2.aaaa.org/pubs/essentials/Pages/default.aspx.

Vancouver’s Olympic Athletes Village is being promoted—and sold—as one of North America’s most energy-efficient, green communities, but tucked away behind the new drywall are the ingredients for a moldy, energy-leaking mess.

The “model for sustainable development” has been built without insulation that is supposed to completely wrap hot and cold water pipes. Insulation reduces energy loss from the hot water pipes; it also prevents condensation from pooling around the cold water pipes, where it can turn into mold and mildew.

The problem won’t be visible until long after the athletes have left, but in about 3 years condo owners will begin to notice the tell-tale signs of a situation that may cause health problems for some residents as well as a financial nightmare to fix.

“We know the water will be pooling inside the walls, but it won’t show for 18 months or a little longer,” said Lee Loftus, business manager for the local union representing mechanical insulators.

Loftus and a colleague from the International Association of Heat and Frost Insulators and Allied Workers Union Local 118 have taken photographs of the bare pipes in several buildings on the Southeast False Creek site under development by Vancouver’s Millennium Group.

The photos show drywall installed over uninsulated pipes in several buildings. Some pipes are insulated where they are visible outside the walls; others are mostly insulated. In some areas, the drywall had already been completed so there was no way to see whether the pipes were properly wrapped.

Millennium Southeast False Creek Properties Ltd. is paying engineers and consultants to inspect the development, which is supposed to meet LEED gold standards, a designation for buildings that meet high standards for energy and water efficiency, indoor air quality, and sustainability. But the partially uninsulated pipes will mean lost heat and efficiency, and air quality will suffer when mold and mildew grow, Loftus said.

“There’s nothing green about that,” he said. “These people think they’re buying something well-made and green, but they’re not getting what they’re paying for—and the developer isn’t getting what they’re buying.”

GM Says Problem Fixed

Loftus said he met with Hank Jasper, general manager of development and construction for Millennium, 6 weeks ago and showed him the photos.

Jasper acknowledged he met with Loftus as well as representatives from other trade unions, and that he was given photos of improperly insulated pipe. But he said only one photo taken in a parking garage showed a problem, and it was fixed.

“They pointed out, I think in one location in one parcel, that there was a temporary piece of insulation that had been put on a piece of pipe that we dealt with immediately,” Jasper said in an interview Friday.

He said the site is being monitored and inspected by various inspectors, contractors, and engineers, and drywall could not be installed before every pipe was properly insulated.

The photos tell a different story. Jasper said he is not familiar with any photos other than the one taken in a parking garage.

“There’s no location I’m aware of where that has occurred and there’s no way that could happen anyway, because all of the suites, all areas, before any board is applied, inspections take place,” Jasper said. “No boarding can proceed without those sign-offs by inspectors. Every suite gets checked.”

At least five mechanical insulation companies—both union and non-union—are working as subcontractors on the site, and the development is so large inspectors may not see problems, says Loftus. He said he had hoped Millennium would have responded quickly to concerns about quality control, but after waiting for weeks, he decided to go public.

“They [the subcontractors] are cutting corners, and I will bet that the savings aren’t flowing back to the developer,” Loftus said. “The developer is spending money for LEED standards and they should get what they paid for.”

$450 Million and Counting

The city has already invested more than $450 million in the development that is supposed to provide a mix of market and social housing. The City of Vancouver is also financing the $1 billion project,
after buying out Fortress Investment Group
earlier this year.

The city retains ownership of the land during construction and expects to recoup its investment when the units are sold or rented.

Loftus said B.C. Building Trades Council organized a meeting between various trades representatives and Millennium Group on May 11. Wayne Peppard, executive director of the trades council, said he had approached Vancouver city councilor Geoff Meggs with some concerns about subcontracting at the development and Meggs suggested he speak with city manager Dr. Penny Ballem. Ballem advised the trades to meet directly with the developer.

During the meeting, Loftus says, Jasper was shown photos of the uninsulated pipes in various buildings on the site and said he would get back to the insulators union, but Loftus said he’s still waiting. A second visit to the site weeks after the meeting found the drywall still in place with the pipes now hidden behind it.

“I don’t think they can fix it on time,” Loftus said. “They would have to take the walls down, inspect all the piping, and then do it right. It would certainly be cheaper to do it now rather than later, but I’m guessing it would cost millions.

“And if they found mold, it would be even worse.”

Ballem said she wasn’t told about any specific problems with the construction of the Olympic Village, only that a union had some concerns about quality control.

“This is the first I’ve heard of this,” Ballem said when contacted by The Province. “If the concerns are true—and I have no evidence of whether they are or not—and they are not being paid attention to, that’s a concern for the city.”

She said she will direct the city’s project manager assigned to the Olympic Village development to consult with Millennium about the issue.

“Clearly this is a major concern for the developer because they will own the vast majority of the project—it is their development,” Ballem said. “To have a newspaper article saying we’re building leaky condos is not great for anybody.”

Campbell Confident

Senator Larry Campbell, who purchased two units at Millennium Water, didn’t know about concerns over the pipe insulation but said he’s confident the developer will fix any deficiency.

“I’m not concerned about it,” Campbell said. “I have complete faith in the developer—I wouldn’t have bought there if I didn’t. I’m looking forward to moving in.”

He did say he intends to check into the issue.

A Common Problem

Andre Pachon, president of the B.C. Insulation Contractors Association, said contractors often bypass the building specifications that require insulation around pipes as a way to save time and money. He has ripped out ceilings in municipal and residential buildings to repair damage caused by condensation dripping from cold water pipes and added insulation to hot water pipes that were left bare while cold water pipes were insulated properly.

“It’s the last thing that should happen,” Pachon said. “Without insulation, your heating costs go up and the building has a bigger carbon footprint, plus there’s condensation problems that show up years later with mold and mildew.

“Everyone knows they should insulate pipes properly—they just don’t do it.”

Ontario-based mold remediation specialist Graham Dewar said if conditions are right, mold can begin to grow in a few weeks, but it may take months or years to be visible.

“You won’t necessarily see it, but if it gets going, you’ll definitely smell it—that mustiness,” said Dewar, who was the senior project manager for a $23 million mold removal and repair job on a provincial courthouse in Newmarket, Ontario.

“I’m a huge supporter of the Olympics and I know Vancouver is under tremendous pressure to meet a deadline—I know it’s a huge task, but if they aren’t fully insulating the pipes, they’re taking risks.

“It may or may not cause problems for the athletes, but long term, there’s the potential for condensation to build and that’s not going to be a good thing. I think they’re making a grave mistake.”

© Copyright (c) The Province. Reprinted with permission.

Buildings account for roughly 40 percent of the energy consumption and 40 percent of the carbon dioxide emissions in the United States.1 As a consequence, energy usage in buildings (both residential and commercial) is receiving significant attention from federal, state, and local government agencies. The American Society of Heating, Refrigerating, and Air-Conditioning Engineers (ASHRAE) Standard 90.1 Energy Standard for Buildings Except Low-Rise Residential Buildings provides minimum requirements for the energy-efficient design of commercial and high-rise residential buildings. Insulation professionals concerned with energy efficiency in buildings should be familiar with ASHRAE 90.1.

What Is ASHRAE 90.1?

ASHRAE 90.12 is a consensus standard that provides minimum requirements for the design of energy-efficient buildings. The scope of the standard includes new buildings and their systems, new portions of buildings and their systems, and new systems and equipment in existing buildings.

The scope of the standard specifically excludes single-family homes, multi-family homes of three stories or fewer, manufactured houses, buildings that do not use either electricity or fossil fuels, and equipment or portions of building systems that use energy primarily for industrial, manufacturing, or commercial processes.

The standard was developed and is maintained by a committee within ASHRAE, a technical organization composed of roughly 51,000 individual members worldwide. ASHRAE’s stated mission is “to advance the arts and sciences of heating, ventilating, air conditioning, and refrigerating to serve humanity and promote a sustainable world.”3 ASHRAE traces its roots to 1894 (when it was originally organized as the American Society of Heating and Ventilating Engineers) and works to achieve its mission through research, standards writing, publishing, and continuing education. Like many technical organizations, ASHRAE publishes a technical journal, a series of handbooks, collections of peer-reviewed technical papers, and a variety of special publications. Unique to ASHRAE is a significant portfolio of technical research projects (funded by the ASHRAE Research Foundation). ASHRAE is considered the leading technical organization active in the development of building energy standards.

Development of energy standards for buildings began in response to the energy shortages of the early 1970s. The initial version of the standard was published in August 1975 as ASHRAE Standard 90-75 Energy Conservation in New Building Design. Over the ensuing decade, ASHRAE 90-75 was adopted (in some form) by most of the model code organizations and, subsequently, by most of the states. Revisions to ASHRAE Standard 90 have occurred regularly. In the mid-1980s, the standard was reorganized into two separate standards: 90.1, covering commercial and high-rise residential buildings, and 90.2, covering low-rise residential buildings.

The latest version of the commercial standard is officially titled ANSI/ASHRAE/IESNA Standard 90.1-2007 Energy Standard for Buildings Except Low-Rise Residential Buildings. The American National Standards Institute (ANSI) designation signifies that the standard was developed using ANSI-accredited procedures and is considered an American National Standard. ANSI requirements ensure the procedures in the development process reflect openness, balance, consensus, and due process. The Illuminating Engineering Society of North America (IESNA) designation indicates that the standard is co-sponsored by IESNA. The 2007 designation indicates the date of approval by the ASHRAE Board of Directors.

Why Is ASHRAE 90.1 Important?

ASHRAE 90.1 is important because it forms the basis of, or at least influences, most building energy code requirements in the United States. The International Energy Conservation Code (IECC) includes ASHRAE 90.1 by reference. Additionally, under the 1992 federal Energy Policy Act (EPAct), ASHRAE 90.1 was mandated as the basis for all state building energy codes. In effect, the EPAct requires all states to certify to the federal government that their energy codes are at least as stringent as ASHRAE 90.1-2004. Most federal agencies have adopted ASHRAE Standard 90.1 in some form as the minimum requirement for new federal buildings.

The subject of building codes and standards is complicated. In the United States, most construction and remodeling is governed by local building codes. Building codes are adopted by local jurisdictions and have the force of law. Enforcement of local building codes is accomplished by building code departments through a combination of plan review and inspections. Most code jurisdictions do not have the staff or the technical expertise to develop and maintain building codes internally. They therefore rely on various code organizations to develop model codes. Local code jurisdictions adopt the model codes in full or in part, depending on local needs. A model building code is not enforceable until it is adopted by a state or local jurisdiction and becomes law.

In the United States, the International Code Council (ICC) is the leading model code organization. The ICC was established in 1994 as a nonprofit organization dedicated to developing a single set of comprehensive and coordinated national model construction codes. The ICC has developed the I-Codes, a series of model codes available to local jurisdictions for adoption. The I-Code covering energy usage in buildings is titled the International Energy Conservation Code (IECC) and its intent is to “regulate the design and construction of buildings for the effective use of energy.” The I-Codes are updated on a 3-year cycle; the 2009 I-Codes are the current version.

Chapter 5 of the 2009 IECC covers commercial buildings. The chapter provides two paths for compliance: ASHRAE 90.1 or the requirements contained in Chapter 5. The Chapter 5 requirements represent a simplified approach generally consistent with ASHRAE Standard 90.1. Building designers can select either path for compliance but must stick with the path selected. Designers are not permitted to “pick and choose” portions from both paths.

What’s in ASHRAE 90.1?

ASHRAE Standard 90.1 is organized into sections:

  1. Purpose
  2. Scope
  3. Definitions, Abbreviations, and
  4. Administration and Enforcement
  5. Building Envelope
  6. Heating, Ventilating, and Air Conditioning
  7. Service Water Heating
  8. Power
  9. Lighting
  10. Other Equipment
  11. Energy Cost Budget Method
  12. Normative References

Requirements relating to insulation are mainly contained in Section 5 (Building Envelope) and Section 6 (Heating, Ventilating, and Air Conditioning).

Envelope Requirements

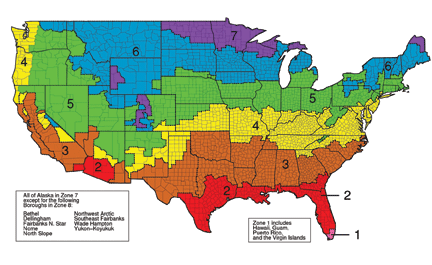
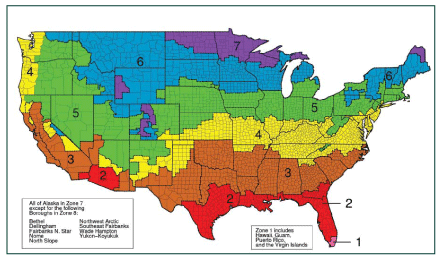
Envelope Requirements (Section 5) cover the thermal performance of the building envelope. Included are prescriptive requirements for the opaque areas (roofs, walls, floors, and doors) and for fenestration (windows and skylights). Envelope requirements are given for each of three space categories (nonresidential conditioned space, residential conditioned space, and semiheated space) and for each of eight different climate zones (Figure 1).

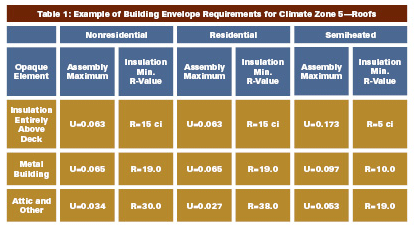
For opaque walls and roofs, the thermal requirements are given in terms of either the maximum allowable U-factor4 or the minimum insulation R-value5 for various classes of construction. As an example, Figure 2 gives the requirements for roofs in Climate Zone 5. This example was extracted from Table 5.5-5 of the ASHRAE Standard 90.1-2007. The same table contains similar requirements for walls above grade, walls below grade, floors, slab-on-grade floors, and opaque doors. The table also includes requirements for fenestration (vertical glazing and skylights) as a function of percentage of wall or roof area.

Given that Figure 2 represents only part of one of the eight tables (one for each climate zone) addressing the envelope requirements, it is easy to see why some view the standard as complex. However, keep in mind that a typical code official deals only with the single envelope table for his or her climate zone.

If designers have difficulty complying with the requirements in the tables, an alternative path is provided in the “Building Envelope Trade-Off Option.” This approach allows trade-offs between various elements (e.g., more wall insulation to offset poorer window performance) in complying with the envelope portion of the standard.

Likewise, if the envelope requirements cannot be met (either by the tabulated requirements or the Building Envelope Trade-Off Option), designers may use the “Energy Cost Budget Method” (described in Section 11). This method allows computer modeling of the proposed building to establish compliance. The modeling must document that the overall “design energy cost” of the proposed design will not exceed the “energy cost budget” for the building as calculated by approved energy simulation computer programs (such as DOE-2, BLAST, or EnergyPlus).

Requirements for Mechanical Insulation

Requirements for pipe and duct insulation are in Section 6, titled “Heating, Ventilating, and Air Conditioning” (HVAC). The majority of this section of the standard deals with design requirements for HVAC systems and minimum equipment efficiencies for HVAC equipment (fans, air conditioners, heat pumps, chillers, furnaces, boilers, and heat-rejection equipment). Subsection 6.4.4.1 addresses insulation. Duct insulation requirements are given (as minimum R values) in Tables 6.8.2A (Cooling and Heating Only Ducts) and Table 6.8.2B (Combined Heating and Cooling Ducts). Pipe insulation requirements are given in Table 6.8.3 as minimum thicknesses.

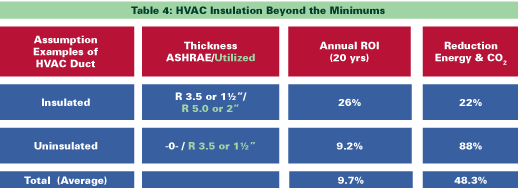
For duct insulation, requirements are given by climate zone (Figure 1) and by duct location. Figure 3 is extracted from the combined heating and cooling requirements table (Table 6.8.2B) from the standard.

Considering the two tables and the seven duct locations listed, there are a total of 161 individual “cells” in the duct tables. Again, this may seem overly complex, but recall that a typical code official deals only with the requirements for his or her climate zone.

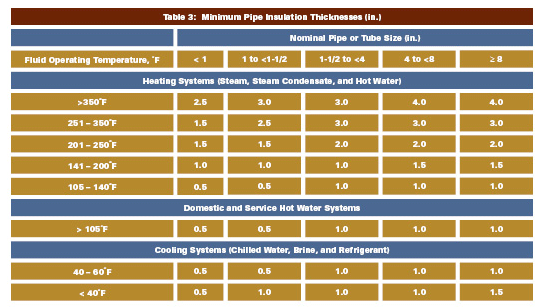
Requirements for pipe insulation are given in Table 6.8.3 of the standard and are summarized in Figure 4.

Note that the requirements for pipe insulation are independent of climate zone. The thickness requirement is determined by the operating temperature and pipe size.

It also should be noted that the pipe insulation requirements are based on an assumed thermal conductivity curve for the insulation material. For insulation materials that differ from the assumed conductivity, an adjustment equation is provided to alter the required thickness to account for the difference in conductivity.

How Is the Standard Developed and Maintained?

ASHRAE Standard 90.1 is developed and maintained by the ASHRAE Standing Standards Project Committee 90.1 (SSPC 90.1). This committee is appointed specifically for the purpose of writing and maintaining the standard and typically has about 50 voting members. The Chairman and Vice Chairman must be ASHRAE members (other committee members are not required to be ASHRAE members); all members must be technically qualified in the standard’s subject area. The SSPC is organized into several subcommittees responsible for various sections of the standard. For example, the Envelope Subcommittee has responsibility for Section 5 (Building Envelope) while the Mechanical Subcommittee has responsibility for Section 6 (Heating, Ventilating, and Air Conditioning) and Section 7 (Service Water Heating).

The standard is under “continuous maintenance,” which means it is continuously revised through a series of addenda. The SSPC subcommittees, which meet face-to-face four times a year, spend the majority of their time dealing with these addenda. The addenda may originate from individuals within the SSPC, or they may come from Continuous Maintenance Proposals (CMPs) from interested outside parties. Anyone can initiate a CMP (instructions and a submittal form are available at www.ashrae.org/technology/page/97). All proposed changes are analyzed, evaluated, discussed, revised, and may eventually result in a public review draft addendum. The public review draft is made available for review and comment by the public for a limited period (30 to 45 days).

Comments received during the public review period are evaluated and discussed with commenters, with the goal of resolving the comments (either by accepting, accepting with modifications, or rejecting). If modified, the draft goes out for additional public reviews until all comments are either resolved or overridden by vote of the committee. Eventually, the addendum is approved by the SSPC and subsequently by the ASHRAE Boards of Directors. Additional approval is required from the IESNA and ANSI before the addendum becomes official and is printed.

The various addenda are periodically published and then integrated into the full standard and republished on a 3-year cycle (to coincide with the 3-year model code cycle). The next full publication will occur in 2010 and will be titled ANSI/ASHRAE/IESNA Standard 90.1-2010 Energy Standard for Buildings Except Low-Rise Residential Buildings.

The SSPC 90.1’s goal is increasing the stringency of the 2010 standard by 30 percent compared to the 2004 standard. Increases, however, still must be judged to be cost effective based on financial guidelines adopted by the committee. These financial guidelines are generally based on national average conditions. For example, analyses of fuel cost savings currently use a national average fuel cost of $1.22/therm. Electrical energy savings are currently evaluated assuming a cost of $0.0939/kWh. Likewise, the installed cost of energy conservation opportunities is typically based on national average cost information.

How Can I Use ASHRAE 90.1?

Insulation manufacturers, distributors, laminators, and contractors are typically not members of the design team responsible for ensuring compliance with ASHRAE Standard 90.1. However, they often have access to bid packages for a variety of building construction projects in their markets. Familiarity with the insulation requirements in Standard 90.1 may help them identify opportunities for insulation overlooked by the design team.

Design teams make thousands of decisions while developing project drawings and specifications. Time and cost constraints often make detailed analysis of every decision impossible. In some cases, insulation specifications are simply marked-up versions of the design firm’s master specification. Perhaps it is not surprising that code-required insulation levels are sometimes inadvertently omitted from project drawings and specifications.

On projects where the insulation levels are addressed, the code-required minimum thickness is typically the level specified. As discussed earlier, these minimum levels are developed based on average conditions. Often, it makes financial sense to install more than the minimum insulation levels.

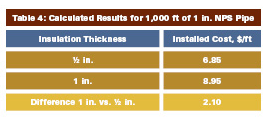
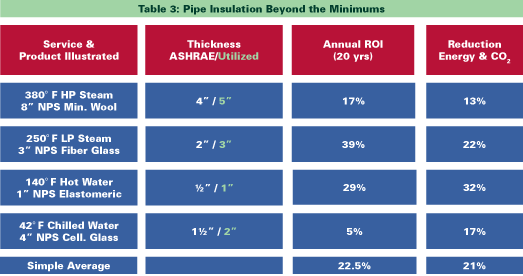
As an example, consider a hypothetical building with a natural gas–fired service hot water system using a recirculating piping system. The system operates year round at 140°F. Pipe size is 1 in. NPS, and there is a total of 1,000 linear feet of piping. ASHRAE Standard 90.1 requires ½ in. of insulation for this application. Would it make sense to go beyond the minimum and install additional insulation on this piping loop?

Using the 3E Plus® computer program6, one can easily calculate the savings that would result if 1 in. of insulation was installed instead. The results of these calculations are summarized in Figure 5 (which assumes elastomeric insulation and an average ambient air temperature of 75°F).

In this example, doubling the insulation thickness to 1 in. results in a 32 percent reduction in heat loss from the system. Annual savings in energy cost would be approximately $610 per year, and CO2 emissions would be reduced by about 6,100 lbs per year.

Estimates for the installed cost of the additional insulation will obviously vary depending on the specifics of the project. For illustration purposes, the following uses estimates taken from a publicly available estimating guide.7

For the 1,000 linear foot project, the incremental cost would be estimated at roughly $2,100. The simple payback period for this investment would be approximately 3.5 years. Considering that the service life of this insulation project would be 20 years or more, going beyond the ASHRAE 90.1 minimums would appear to make excellent economic sense. The return on investment for this opportunity over the 20-year life would be about 29 percent.

This example illustrates the possibility that “going beyond the minimums” can provide attractive financial returns to the owner while reducing greenhouse gas emissions.

Insulation professionals with knowledge of ASHRAE 90.1 may also find it useful for projects not strictly covered by the standard. As an example, consider an existing industrial process application with a 4 in. NPS medium-pressure steam line operating at 300°F originally insulated with 1 in. of insulation. This system falls outside the scope of ASHRAE 90.1 since it involves an industrial process. Depending on the cost of energy and the boiler efficiency, the economic thickness of insulation is probably significantly higher than the 1 in. originally specified. Familiarity with the requirements of ASHRAE 90.1 may help upgrade the line to 3 in. of insulation (the 90.1 minimum for this line) with a minimum of time and effort spent in analysis and documentation.

Summary

ASHRAE Standard 90.1-2007 forms the basis of, or at least influences, most commercial building energy codes in the United States. Knowledgeable insulation professionals should be familiar with the minimum insulation requirements in standard 90.1. They should also be aware that these requirements are minimums and in many cases it may make sense to go beyond the minimums. Going beyond the minimums saves energy, reduces energy costs, reduces greenhouse gas emissions, and increases job opportunities in the insulation industry.

Notes

  1. U.S. Department of Energy, Office of Energy Efficiency and Renewable Energy. Efficiency Trends in Residential and Commercial Buildings, Oct 2008.
  2. Available at www.ashrae.org/bookstore.
  3. www.ashrae.org.
  4. U-factor is the overall coefficient of heat transfer for the construction, Btu/(h•ft2•°F).
  5. R-value is the thermal resistance of the insulation material, h•ft2•°F/Btu.
  6. Developed by the North American Insulation Manufacturers Association (NAIMA) and available at www.pipeinsulation.org.
  7. Mechanical Cost Data 2008, RSMeans.
Figure 1
Figure 2
Figure 3
Figure 4
Figure 5
Figure 6

All the stars are aligned for our industry to alter, in significant ways, U.S. energy consumption. How exciting is that? The nation has a desire to reduce its dependence on foreign oil, reduce greenhouse gas emissions, and become more self sufficient regarding energy use. People all over the United States and Canada are beginning to see the need, and federal and state governments are insisting that the goals be accomplished. At the same time, the cost of energy and increased focus on emissions are motivating industries to reduce their use of fossil fuels. The light shining on the long-term cost of operating commercial buildings and industrial facilities is motivating owners and managers to think twice about accepting “value engineering” mechanical insulation out of their buildings, and they are actually increasing the use of mechanical insulation, including increasing thicknesses.

I would like to think that we in the mechanical insulation industry planned for this “perfect storm” heading for our segment of the construction industry, as viewed by architects, engineers, plant managers, owners, and government officials. We knew that significant changes were going to take place that would alter the way architects and engineers specify insulation materials for mechanical services. We did not know when and to what extent the changes would come. We went about the business of manufacturing and installing mechanical insulation the same way for decades. We saw specifications with the same materials, the same thicknesses, the same finishes, all using the same business model for determining what systems would receive insulation and how thick and what material would be used. True, we saw some new and exciting materials and insulation systems, but even with the newest materials available, we struggled to be heard. It was the old economic thickness business model. How things have changed.

This “perfect storm” is changing the way the nation looks at mechanical insulation. For decades those of us in the contracting sector of the insulation industry have been caught in the vise between low initial building costs and optimum life-cycle cost for a building or facility. This subject has been discussed in previous Insulation Outlook issues. We have been asked to “value engineer” our services, which usually meant reduce or eliminate mechanical insulation. In recent months, however, numerous articles written by industry professionals discuss the error of this thinking. In an article entitled “Trimming mechanical insulation from building budgets may lead to higher long-term operating costs,” published by Reed Construction Data, correspondent Don Procter eloquently makes the argument. Cutting or eliminating mechanical insulation is unwise from both building operation and environmental standpoints.

The National Insulation Association (NIA) embarked on a mission many years ago to increase awareness about the value of mechanical insulation in energy efficiency, emission reduction, and a host of other benefits. Recently, the International Association of Heat and Frost Insulators and Allied Workers (International) joined NIA in an alliance to educate members of Congress about the value of mechanical insulation as part of the NIA Foundation for Education, Training, and Industry Advancement’s Mechanical Insulation Marketing Initiative (MIMI). Representatives of NIA and the International have so far visited more than 50 members of Congress and six governors’ offices to educate them about the value of mechanical insulation as it pertains to the legislative branch’s desire to reduce our nation’s dependence on foreign oil, reduce greenhouse gas emissions, and create jobs to stimulate our economy. These visits are producing mechanical insulation awareness, as evidenced by Representative Deborah Halvorson (D-IL) speaking to this issue on the floor of the House of Representatives. Mechanical Insulation, “The Forgotten Technology,” has been mentioned in the Congressional Record. Members of Congress now actually know what mechanical insulation is and, more importantly, what it can do. Change is in the air. Money to help educate the nation about mechanical insulation is now a possibility. It is now a possibility that legislation may be enacted to give tax incentives to energy users to maintain and increase the use of mechanical insulation in new and existing facilities. Credit for increasing mechanical insulation in green building rating systems is also being discussed. It will be more and more difficult for some general or mechanical contractor to insist on “value engineering” the mechanical insulation when the state and local governments insist on greater insulation efficiency or if a facility owner is provided a tax incentive for increased efficiency.

For the first time in my recollection, we are discussing changing the business model under which mechanical insulation is specified. Since I began my career in this wonderful industry in 1964, I have seen the old economic thickness business model used for insulation specifications. The problem is that the cost of energy has escalated dramatically. Ron King, a Past President of NIA, began talking about this dynamic change many months ago. If we are going to get serious about energy efficiency and reducing greenhouse gas emissions, industry needs to adopt different financial models and think about insulation differently.

These new business paradigms will have an effect on the commercial and industrial sectors. The industrial markets are less likely to buy into the “value engineering” idea of thickness reduction, since they usually need minimum thermal values to operate the facility and directly benefit from increased insulation efficiency because it translates into energy cost and greenhouse gas emission reductions, which could translate into tax incentives, which translate into increasing their return on investment. Even in a retrofit situation where some insulation is already in place, increasing insulation thicknesses, maintaining existing insulation, and replacing missing and damaged insulation can save the facility money both on energy consumption and reducing greenhouse gas emissions.

The “Rebuilding America” program sponsored by the Center for American Progress and the Energy Future Coalition has called for a retrofit of 40 percent of the nation’s building stock by the year 2020. Many of those buildings are commercial and institutional, which will provide opportunities for the mechanical insulation industry. Deep building retrofits can reduce energy consumption by 20 to 40 percent.

NIA has embarked on strategic partnerships with dozens of other construction-related associations to educate all sectors of the industry. In addition to holding more than 100 seminars changing how the construction and design community views mechanical insulation, NIA has performed an analysis of the Department of Energy’s Save Energy Now data with Oak Ridge National Laboratory. This data was the basis for an NIA analysis showing that a moderate increase in the use of mechanical insulation could generate nearly $4.8 billion in energy savings and 89,000 jobs. It is all coming together. When people understand what mechanical insulation can do for the operation of a facility and for the environment, they will respond.

There is movement in all directions. The International is working with NIA to promote mechanical insulation on Capitol Hill. Owners and operators are changing the way they view mechanical insulation. Architects and engineers are changing the way they specify mechanical insulation. Contractors are saying no to the old “value engineering” requests. Labor, government, manufacturers, architects, engineers, owners, plant managers, and NIA all promoting the same message of reduced fuel consumption and greenhouse gas emissions? It looks like a “perfect storm.”

When we are successful on all these fronts, we need to be ready to meet the challenges created by all this growth. The manufacturing community needs to be ready with the adequate production capabilities. The distribution facilities need to be prepared to house the materials and have adequate transportation to move the materials to project sites. The banking community needs to be prepared to assist contractors with financing the business growth that will come from this increased interest in mechanical insulation. The contractors need to be prepared to grow their businesses from financial and manpower perspectives.

It isn’t here yet, but it is coming. Architects, facility owners, and mechanical engineers will need to adopt a new way of thinking about the entire building structure and design process to accommodate the insulation systems of tomorrow. Insulation contractors will need to ensure there is a sufficient trained labor force to perform the increased workload. Remember, we are not just talking about new construction with new specifications, but about retrofitting 40 percent of the nation’s building stock. Much of this work is “shovel ready.” Retrofitting existing buildings will show immediate results, putting thousands of people to work in all segments of the industry.

Who will be positioned to act in this “perfect storm”? Certainly, contractors, manufacturers, and distributors who are members of NIA will have an advantage. Many contractors and organizations, including the International, have conducted in-house training or sent their employees to NIA training courses to get ready to meet demand. All across the country, however, many small businesses are not ready to finance expansions. The government must be willing to assist small businesses with this growth.

Get your raincoats out and batten down the hatches. This is going to be a wild and wonderful storm.

The 104 operating nuclear power plants in the United States and the 20 operating nuclear units in Canada produce about 20 percent and 15 percent, respectively, of the electrical power generated in North America. That share is expected to grow in the coming decades, with more than 30 nuclear power plants proposed by 17 consortia in the United States and an additional four plants proposed by one utility in Canada, all to be completed by the year 2030.

Thermal Insulation in Existing Nuclear Power Plants

It is beyond the scope of this article to explain how nuclear power plants work—and which parts need to be insulated—but basically a nuclear power plant boils water to create steam and rotate a turbine generator.

When discussing a nuclear power plant, it is necessary to distinguish between inside containment and outside containment. The containment is the cylindrical or box-like structure that houses the nuclear reactor.

Inside Containment

Work inside containment is difficult, and generally has stringent quality assurance (QA) requirements for materials and labor. This is true for electrical, structural, hydraulic, and even insulating materials and systems. Work inside a nuclear containment, including the supply and installation of insulation materials, is “on a different planet” compared with work in a fossil fuel power plant, chemical plant, or petroleum refinery.

The containment is a large space containing the nuclear steam supply system (NSSS), which can consist of the reactor, pipe, pumps, valves, and other miscellaneous components and equipment. The NSSS has a very large net positive heat load. Insulation on hot service pipe and equipment inside containment has one purpose: to control containment cooling loads. Containment cooling must remove that heat, whether linked directly to a body of water (e.g., a river, lake, bay, or ocean) or vapor compression cooling (i.e., air conditioning). If the NSSS heat sources inside containment release heat at a greater rate than the cooling equipment can remove it, the containment air temperature will rise above what the nuclear plant’s technical specifications allow.

The 104 operating U.S. nuclear units were constructed from the early 1960s through 1994. The NSSS piping and equipment in plants constructed through 1972 sometimes included asbestos-containing insulation materials. Other than that, the hot service pipes and equipment were mostly insulated with mineral wool, calcium silicate, fiberglass, microporous, refractory, glass fiber felt, and reflective metallic insulation (RMI). The cold service piping, carrying cold water to fan coil units, was insulated with fiberglass, cellular glass, or various plastic foams.

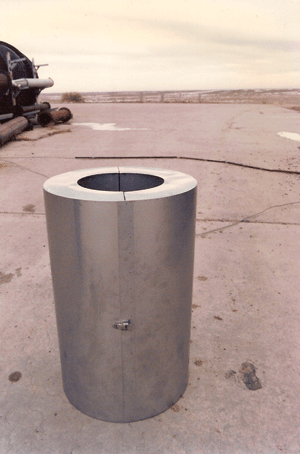
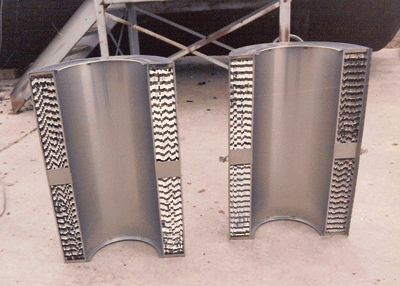
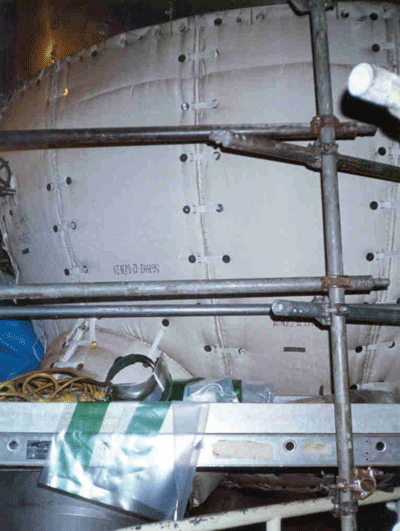
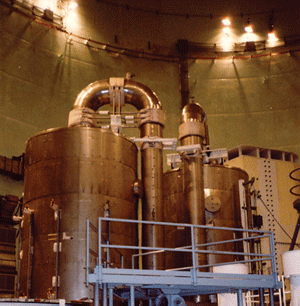
Some of these materials were installed as permanent insulation, not intended to be removed and reinstalled. However, after about the mid-1970s, new plants increasingly were insulated with pre-engineered, pre-fabricated systems designed for removability and reuse. The first of these were RMI cassettes (see Figures 1 and 2), soon followed by 100 percent removable/reusable fiberglass blankets with separate stainless steel jacketing (see Figures 3 and 4). In both systems, each insulation piece was uniquely tagged and its location shown on an assembly drawing. A new boiler water reactor (BWR) might have had some 6,000 insulation pieces and a pressurized water reactor (PWR) might have had 10,000 insulation pieces. The difference in insulation piece quantities is primarily due to the number of NSSS components and equipment associated with each type of reactor.

Quality Assurance

For both RMI and removable/reusable blanket systems, there were often requirements added by the nuclear plant architect/engineer (A/E) design firm to address thermal, seismic, and various other safety analyses to be included, all provided by the insulation supplier.

At some plants, QA called for insulation materials to be supplied as “Nuclear Safety Related,” which required production-lot specific control and documentation of all material components, including their source, design, fabrication, identification, packaging, and shipment. Sometimes even the insulation contractor’s installation labor was required to be “Nuclear Safety Related,” meaning the contractor had implemented a formal QA program, including hiring and training full-time quality control (QC) inspectors to verify that the insulation materials were correct and properly installed. Extensive documentation was required of what insulation materials, in what quantities, were installed where. Non-conforming materials had to be marked with “hold tags,” and resolved by formalized disposition procedures.

At some nuclear plants, however, there were no special QA requirements, and in some of those, there were no formal records of what type of insulation was installed where. There were always specifications, but not always documentation that the specifications were followed (and in some plants they were not).

After the plant’s commissioning, specifications were sometimes altered to allow different insulating materials to be added on a replacement basis, particularly for inside containment hot service pipe and equipment. For example, a number of plants developed high containment cooling load problems, as demonstrated by high containment air temperatures. At many of those plants, pre-engineered removable/reusable blankets replaced original RMI materials. Also, many of the PWR plants replaced their steam generators (i.e., huge heat exchangers) and many BWR plants replaced their primary piping systems, requiring new insulation that was either RMI or removable/reusable blankets with metal jacketing.

Outside Containment

Outside containment work at a nuclear plant is more similar to work at a fossil-fueled power plant.

Outside containment, calcium silicate was usually specified for pipe insulation because of both its high durability (due to its very high compressive strength and flexural strength) and its availability with chemical inhibitors, enabling its use on austenitic stainless steel pipes and equipment (to prevent stress corrosion cracking). Mineral wool and fiberglass were sometimes used, but I estimate that calcium silicate constituted approximately 90 percent of the outside containment pipe, component, and equipment insulation. The steam turbines were insulated with either calcium silicate block or removable/reusable blankets made with needled glass fiber felt insulation encased in woven glass fiber fabric.

Sump Blockage, Bulletin 96-03, and Generic Safety Issue (GSI) 191

BWR plants have a suppression pool, a large cylindrical volume of water contained around or underneath the containment to be used as a source of cooling in a large NSSS pipe break accident. In a large pipe break, a recirculation cooling system powered by large pumps starts up, drawing water from the suppression pool through strainers to the pumps, through heat exchangers, and back into the containment. Some of the water is injected onto the nuclear reactor to cool it down, and some is simply recirculated within the suppression pool to provide heat removal from the containment. The strainers on the pump intake pipes inside the suppression pool separate out debris that might damage the pump internals.

A PWR plant has a similar emergency cooling system, although there is no suppression pool. Rather, there is a sump pit in the lowest level of the containment with a screen over the top. In a large pipe break, large quantities of water are injected into the nuclear reactor as well as sprayed into the containment upper levels. Once the water level on the containment floor reaches several feet in depth, the emergency pumps turn on, drawing the accumulated water from the containment floor through the screens, into the pumps, through heat exchangers, and back into the containment. The screens separate out debris that might damage the emergency pump internals.

In both BWR and PWR plants, the emergency cooling system is designed to operate for at least 30 days following a pipe-break accident. Anything that could disrupt recirculation water flow could affect the cooling of the damaged NSSS.

In July 1992, an incident at a BWR in southern Sweden radically changed the rules for nuclear containment insulation. An NSSS steam relief valve accidentally opened, releasing a steam blast that blew off some pipe insulation sheet metal jacketing and destroyed a large quantity of mineral wool pipe insulation. The shredded mineral wool blew down into the suppression pool. The containment air temperature, which had suddenly increased due to the steam blast, triggered monitoring instrumentation that started the emergency pumps, which in turn circulated suppression pool water through coolers, and then pumped it back into the suppression pool. This incident has been well documented in nuclear power plant safety and regulation literature. For example, the United States Nuclear Regulatory Commission (NRC) Generic Letter 2004-02: Potential Impact of Debris Blockage on Emergency Recirculation During Design Basis Accidents at Pressurized-Water Reactors states:

On July 28, 1992, at Barsebäck Unit 2, a Swedish BWR, the spurious opening of a pilot-operated relief valve led to the plugging of two containment vessel spray system suction strainers with mineral wool and required operators to shut down the spray pumps and backflush the strainers.

At this plant, mineral wool debris became mixed into the suppression pool water by the steam blast agitation. When the emergency pumps started, the pressure drop across the emergency pump suppression pool strainers rapidly increased. In less than an hour, one pump started to cavitate and another was very close to cavitation. The plant operator shut off the pumps immediately so no damage was done.

Less than a year after the Swedish plant incident, there was another at the Perry Nuclear Plant near Cleveland, Ohio, also summarized in Generic Letter 2004-02:

In 1993, at Perry Unit 1, two events occurred during which ECCS strainers became plugged with debris. On January 16, ECCS strainers were plugged with suppression pool particulate matter, and on April 14, an ECCS strainer was plugged with glass fiber from ventilation filters that had fallen into the suppression pool. On both occasions, the affected ECCS strainers were deformed by excessive differential pressure created by the debris plugging.

These two incidents caught the attention of nuclear power plant operators around the world. In Sweden, the BWRs replaced their original small suction strainers with larger ones of considerably more surface area. The Swedish PWRs replaced their sump debris screens with larger strainer surface areas as well. They did this within a year of their plant incident.

Two years later there was a third incident, this time at one of the two Limerick Plants near Philadelphia, Pennsylvania (summary from Generic Letter 2004-02):

On September 11, 1995, at Limerick Unit 1, following a manual scram due to a stuck-open safety/relief valve, operators observed fluctuating flow and pump motor current on the A loop of suppression pool cooling. The licensee later attributed these indications to a thin mat of fiber and sludge which had accumulated on the suction strainer.

Both suction strainers in the “A” loop of suppression pool cooling were almost entirely covered with a thin “mat” of material, consisting mostly of fibers and sludge. The “B” loop suction strainers had a similar covering, but less of it. Analysis showed that the sludge was primarily iron oxides and the fibers were polymeric in nature. The source of the fibers was not identified, but the licensee determined that the fibers did not originate within the suppression pool and that no trace of either fiberglass or asbestos was in the fibers.

While all three were only nuclear incidents—not accidents—they did demonstrate that suppression pool emergency pump suction strainers were severely undersized. The Swedish plant incident demonstrated that fibrous pipe and equipment insulation could be shredded by a high-pressure steam or water blast. Both the Perry and Limerick incidents demonstrated that a small quantity of fibrous material, in combination with particulate, could collect on the safety strainers, resulting in pressure losses. All three of these incidents would have had greater safety implications in an actual NSSS pipe break loss-of-coolant accident (LOCA).

In the United States, the NRC in 1996 issued Bulletin 96-03, “Potential Plugging of Emergency Core Cooling Suction Strainers by Debris in Boiling-Water Reactors,” which incorporated lessons from the incidents at the Swedish plant, the Perry Plant, and the Limerick Plant. All U.S. BWR units were required to demonstrate by calculation that their plants’ emergency cooling systems could function after a large NSSS pipe break LOCA, taking into account all their containment insulation, all sources of particulate, and other sources of debris. As a consequence, by 1999, all 34 U.S. BWR units replaced their original suction strainers with larger surface area, high-capacity strainers. There were 4 to 10 new strainers added at each nuclear unit.

Most BWR plant owners who had containments with fibrous pipe insulation designed their new suction strainers to be large enough to operate even with lots of collected debris. However, the NRC also required all types of fibrous and granular insulation materials to be evaluated as possible sources of debris that could clog suction strainers. Fibrous and granular insulation had to be documented in terms of quantities, locations, and condition.

RMI, made with concentric layers of metal foils on the inside, was not found to be a source of debris that could clog strainers. Instead, the foils were merely blown into shreds that could collect on suction strainers but wouldn’t block water flow and wouldn’t filter out particles suspended in the water.

After the NRC’s issuance of Bulletin 96-03, BWR plant owners also instituted aggressive suppression pool cleaning programs, regularly vacuuming out the iron oxide “sludge” from pipe and suppression pool corrosion.

In the late 1990s, the NRC started a project known as “Generic Safety Issue-191: Technical Assessment: Parametric Evaluations for Pressurized Water Reactor Recirculation Sump Performance,” referred to as GSI-191. After several years of additional study, the NRC issued Revision 2 to existing Regulatory Guide 1.82: “Water Sources for Long-Term Recirculation Cooling Following a Loss-of-Coolant Accident.” This revised regulatory guide required the owners of PWRs to evaluate and correct any plant deficiencies, including installation of significantly larger surface area strainers, just as the BWRs had done. Today, all 69 U.S. PWR units, as well as all 20 operating heavy water nuclear plants in Canada, have replaced or are planning to replace their safety screens with high-capacity screens or strainers.

In the meantime, however, new questions arose about chemical reactions that could occur after a nuclear accident involving insulation debris, paint chips broken loose by the LOCA, and dissolved chemicals in the recirculation water designed to reduce nuclear radiation release following an accident. The chemical effects have made it difficult to show by testing and calculation that the new safety strainers or screens are large enough for the PWR plant in question. As of mid-June 2009, PWR plants are still conducting chemical effects tests, so the issue is not yet resolved.

Fibrous and granular insulation materials have been identified as sources of debris that could, in a LOCA, collect on emergency strainers and lead to high pressure losses. Regardless, the PWR plants with primarily fibrous or granular containment insulation are leaving most of it in place and designing their new screens or strainers to handle the debris. Because of this, U.S. plants with fibrous and granular insulation materials continue to operate within the guidelines of the NRC.

The U.S.-designed plants in Mexico, Spain, Belgium, Switzerland, Britain, South Korea, Japan, and other countries were also required by their nuclear regulators to replace safety strainers and screens with much larger surface area screens or strainers. Likewise, in countries with non-U.S.-designed plants, such as France, Germany, Japan, and Russia, the regulators also required that their plants address this issue.

Nuclear Plants Today

First, the good news: U.S. and Canadian nuclear plants are safer today than they were before adding the larger surface area strainers or screens. Many of these strainers/screens are approximately 100 times larger than the original ones—roughly 10,000 times safer for a given amount of debris. (See References for documentation supporting this section.)

Further, the nuclear plants have instituted programs to:

  1. control the quantity and types of paint used in containment to minimize paint chips in an accident
  2. improve containment cleanliness programs to remove sources of dirt and rust that could contribute to post-accident pressure losses across the safety strainers/screens
  3. identify their containment insulation types, quantities, and locations.

A post-accident, pipe break safety analysis for a nuclear plant, as far as thermal insulation debris sources goes, has four parts:

  1. debris generation
  2. debris transport
  3. chemical reaction
  4. head loss (pressure loss) across the strainer or screen.

The first step, debris generation, must be supported by sound testing and evaluation to make the rest of the analysis reasonable, accurate, and conservative. The questions of how much insulation is actually destroyed, how much debris is actually generated, and the form of that debris are extremely complicated. The questions could have been answered by tests that were well thought out and well executed, but, with a few exceptions, this was rarely done. As a consequence, the plant safety analyses to determine the size of the new suction strainers or screens and the role of insulation debris have been overly conservative due to assumptions of huge quantities of very fine insulation debris being generated by a large pipe break accident inside a nuclear plant containment building.

It was the responsibility of the nuclear industry to challenge the NRC’s assumptions by testing the insulation materials, the paint types used in containment, and other debris source materials, as well as the proposed new screens/strainers. The BWR Owners Group did conduct a series of high-pressure air jet tests in 1997, but these tests were dismissed by the NRC as being non-representative because they did not use a two-phase steam/water blast. One PWR utility conducted a test with stainless steel jacketing on calcium silicate. In the end, however, neither group conducted comprehensive debris-generation testing using high pressure steam/water.

Thermal Insulation in Future Nuclear Plants

This lack of debris-generation testing may have led to fibrous and granular insulation materials being seen as contributing debris to screen and strainer blockage. However, this issue is addressed by having adequate safety strainers or screens, which have already been installed in most of the 104 operating U.S. nuclear plants, typically without replacing existing fibrous and granular insulation materials.

RMI has been used in many nuclear power plants in the United States and overseas (although not in Canada). It has also been used on many replacement steam generators in PWR plants and recirculation piping projects in BWR plants. RMI cassettes are made of heavy gauge stainless steel sheet on the outside and light gauge stainless steel foils on the inside. The thermal performance depends primarily on maintaining the low emittance of the concentric foil layers. To a much lesser degree, the 1/4-inch to 1/2-inch wide air spaces between the foils provide some thermal performance. There is considerable opportunity for thermal bridging through the outer stainless steel shell from the hot surfaces to the outer jacket, as well as through gaps that can open up and at lap joints and butt joints. There is no effective way to make thermally effective expansion joints of the types frequently added with conventional mass insulation systems on high temperature applications, since fibrous materials generally are not allowed to be used with RMI systems.

When working with RMI, tremendous attention to detail must be paid during system design, fabrication, shipping, and installation. Steel has high thermal conductivity, and air spaces between concentric layers of foils can provide fairly high convective heat transfer. When the pipes expand upon heating, gaps open between adjacent sections of RMI, leading to additional heat transfer. RMI must be extremely well maintained, with damaged materials replaced as soon as possible, even more so than with conventional materials. Hence, if new nuclear plants use RMI in containment, plant owners must institute formal nuclear QA programs for the design, manufacture, transport, storage, installation, and maintenance of the materials.

Earlier this year, the ASTM Committee C16 on Thermal Insulation approved a revised version of Standard C667, “Standard Specification for Prefabricated Reflective Insulation Systems for Equipment and Pipe Operating at Temperatures above Ambient Air.” This revision requires RMI materials to meet maximum allowable values of thermal conductivity at particular mean temperatures, as in other ASTM insulation material standards. The revised standard should be a valuable asset to those writing insulation specifications for new nuclear plants, as well as for plant owners who purchase the materials.

With the history of screen and strainer blockage incidents, various NRC documents such as GSI-191, and 17 years of strainer redesigns since 1992, the author believes it is possible that only RMI thermal insulation will be specified for use in nuclear containments. It would be extremely unfortunate if fibrous and granular insulation materials were not considered for use in containment, because these materials have effectively insulated containment hot service piping and equipment for many years. Furthermore, this insulation can be provided in a pre-engineered, removable/reusable form that facilitates pipe and equipment inspections. Fibrous and granular insulation materials, such as mineral wool, fiberglass, and calcium silicate, continue to be used safely in nuclear plants around the world.

Chilled water systems within the nuclear containment, while representing only a small fraction of the total surfaces needing insulation, will likely be insulated with cellular materials such as cellular glass and polyisocyanurate. This raises a question: since cellular glass is rated in ASTM C552 for continuous use to 800°F, might it be considered as an insulation material for hot service piping and equipment in containment? It would probably have to be provided as a removable/reusable system in an encapsulated form, but it might be considered as a mass insulation free of fibers and particulate. Further, since its debris would float if destroyed by a pipe break LOCA, that debris wouldn’t transport to the emergency strainers or screens. To the best of the author’s knowledge, no one has ever promoted cellular glass for use on hot service piping and equipment at a nuclear plant, but there is always a first time.

The author believes outside containment will likely have calcium silicate specified for the same reasons as in the previous generation of plants: durability and its being chemically inhibited to prevent stress corrosion cracking of stainless steel. However, all types of insulation that can meet the maximum use temperature rating of 550°F can be considered for use on hot service piping and equipment outside containment.

Note: To learn more about the history of the sump clogging issue and GSI-191, read “A Short History of the Sump Clogging Issue and analysis of the problem” in the March 2004 issue of Nuclear News at www.ans.org/pubs/magazines/nn/docs/2004-3-2.pdf.

References

  • Nuclear Regulatory Commission. Generic Letter 2004-02 Potential Impact of Debris Blockage on Emergency Recirculation During Design Basis Accidents at Pressurized-Water Reactors. September 13, 2004.
  • Nuclear Regulatory Commission. NUREG/CR-6808: Knowledge Base for the Effect of Debris on Pressurized Water Reactor Emergency Core Cooling Sump Performance. February 2003.
  • Nuclear Regulatory Commission. Regulatory Guide 1.82, Revision 3: Water Sources for Long Term Recirculation Cooling following a Loss-of-Coolant Accident. November 2003.
  • Nuclear Regulatory Commission. Staff Review Guidance Regarding Generic Letter 2004-02 Closure in the Area of Coatings Evaluation. March 2008.
  • Nuclear Regulatory Commission. Staff Review Guidance Regarding Generic Letter 2004-02 Closure in the Area of Plant Specific Chemical Effect Evaluations. March 2008.
  • Nuclear Regulatory Commission. Staff Review Guidance Regarding Generic Letter 2004-02 Closure in the Area of Strainer Head Loss and Vortexing. March 2008.
Figure 1

A single Reflective Metal Insulation (RMI) cassette for pipe insulation. This cassette consists of two semi-cylindrical cylinders, as with other types of pre-formed pipe insulation, that are held together with several latches.

Figure 2

One of two halves of the RMI cassette shown in Figure 1. Note the concentric layers of stainless steel foil on the inside of the RMI insulation piece. This type of insulation is typically pre-engineered to fit in a particular location in the nuclear plant.

Figure 3

Pre-engineered, removable/reusable fiberglass blanket insulation inside a nuclear containment. These blankets are typically held in place with hook and loop fasteners. After complete installation, this type of insulation blanket is typically covered with removable/reusable stainless jacketing that uses latches for attachment.

Figure 4

An insulation system consisting of pre-engineered, removable/reusable fiberglass blanket insulation with stainless steel jacketing.

Figure 5

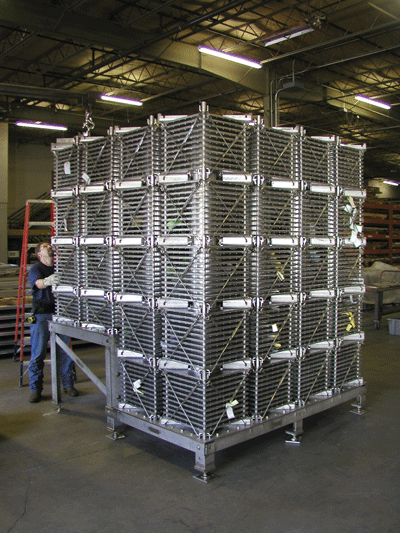
A new safety strainer, constructed for use at a Pressurized Water Reactor (PWR) nuclear plant, being inspected in the fabrication shop.

Figure 6

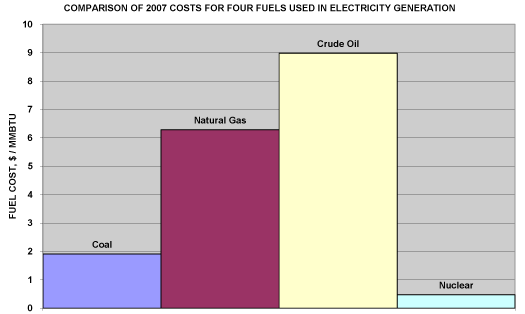
Sidebar Figure 1. A bar chart comparing the costs of four fuel sources for the generation of electric power (source: Nuclear Energy Institute).

Figure 7

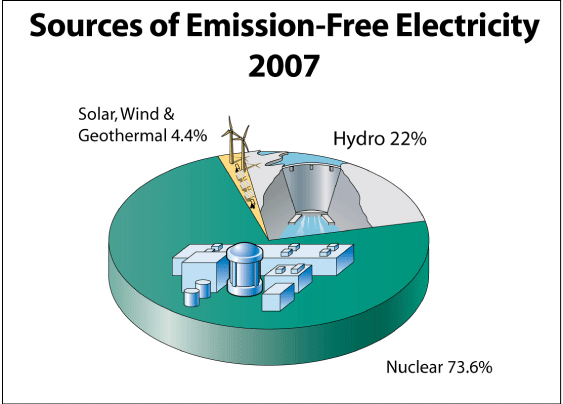
Sidebar Figure 2. A pie chart showing the contributions of different electrical energy sources to carbon-free generation.

During these tough economic times, facility owners and managers across the country are looking for ways to save money. There’s help available if you or any of your customers have a “small” business in a rural area: the U.S. Department of Agriculture (USDA) may give you money to become more energy efficient. The Rural Energy for America Program (REAP) provides funding to small businesses in rural communities to make energy efficiency improvements or to purchase and install renewable energy systems.

Most businesses find that energy costs are a significant percentage of total expenses, and one of the best ways to cut costs is to reduce energy consumption by increasing energy efficiency. The opportunities in this area are almost unlimited. In recent years, tremendous strides have been made in making lighting more energy efficient; if your lighting is more than 10 or 15 years old, it can almost certainly be improved. Better windows, as well as greatly improved boilers, chillers, water heaters, and other HVAC systems, are now available.

And of course, proper insulation—often overlooked but of supreme importance—is critical.

If you are an insulation or other professional who already understands the benefits of energy management, you know that one common obstacle to implementing energy-saving systems like mechanical insulation is the cost. Programs like REAP provide opportunities to market your services to clients with the added benefit of help funding the project.

If you are a building owner or manager, you are probably well aware of the effect energy costs have on your bottom line and are looking for ways to offset those costs. If you have already had a facility or plant energy assessment, REAP funds can help you implement the projects already identified. If you have not yet had an energy assessment, REAP can provide funding to identify areas that will save energy and money.

This year is the first time REAP funds were also made available for energy audits to identify ways to improve energy efficiency. The word “audit” may sound scary to a small business owner, but the intention behind funding these audits is to help small business owners and agricultural producers determine exactly where they need to make changes in their operations to save energy and, consequently, cut costs. Audits are required for energy efficiency projects funded through REAP that exceed $50,000.

There are both grant opportunities (up to 25 percent of eligible project cost) and guaranteed loan opportunities (up to 50 percent of project cost). You could also apply for a combination grant and guaranteed loan. Loan funds do not come directly from the government; “guaranteed loan” simply means the government will guarantee your loan to a local lender of your choice, who may offer a lower interest rate due to the federal guarantee.

Does your business qualify as a “small” business? As defined by the Small Business Administration (SBA), small businesses typically have fewer than 500 employees and revenue less than $6.5 million. Check the Small Business Administration website, www.sba.gov, to determine whether you qualify as a small business.

Farmers and ranchers who earn at least 50 percent of their gross income from agricultural operations are also eligible. USDA has set aside 20 percent of all REAP funds for small-scale agricultural project grants of $20,000 or less.

In a C-SPAN Washington Journal interview in May, Secretary of Agriculture Tom Vilsack said, “We’re trying to create strong rural communities.” To meet “rural” eligibility, the project must be located in an area with a population less than 50,000 residents.

The program is budgeted at $55 million for 2009. USDA will award funding up to the following levels:

  • Grants for renewable energy systems: 25 percent of eligible project costs up to $500,000
  • Grants for energy efficiency projects: 25 percent of eligible project costs up to $250,000
  • Loan guarantees: 75 percent of eligible project costs up to $25 million
  • Feasibility studies: 25 percent of eligible study costs up to $50,000.

For projects with total eligible costs exceeding $200,000, agricultural producers and rural small businesses must demonstrate financial need. For projects with total eligible costs of $200,000 or less, applicants must simply provide a statement certifying their financial need.

Majority ownership must be held by U.S. citizens or permanent residents, and the applicant must own and control the system, though a qualified third party may be engaged to operate it. Projects cannot be used for any residential purposes (visit www.dsireusa.org for information on residential energy incentive programs).

Examples of projects eligible for funding include:

  1. Any project that will save energy, such as insulation, new lighting, irrigation improvements, new furnaces and/or cooling systems, window replacements, and ground source heat pumps
  2. Projects that generate renewable energy: solar, wind, hydrogen, geothermal, and biomass.

Strong preference is given for technology that is commercially available, meaning that it has a proven operating history and has an established design, installation, and service industry. Pre-commercial technologies that have emerged through the research and development process and have commercial potential may qualify, but they require substantially more documentation.

Eligible project costs include: post-application construction or improvements, energy audits, post-application purchase and installation of equipment, professional service fees, feasibility studies and technical reports, retrofitting, permit or license fees, working capital, land acquisition, and construction of a new energy-efficient facility as long as it is used for the same purpose, is approximately the same size, and based on the energy audit will provide more energy savings than improving the existing facility.

As we travel around speaking to various groups about this program, we have often heard business owners state that they cannot afford the trouble to pursue this and other grants, as they do not have the time or money to learn about the grant application process. Our reply is always the same: “Can you afford not to?” As a business manager, it is just poor management to pass up free money that would allow you to undertake projects you need to undertake anyway.

If you are interested in applying for REAP funds, you can either hire a professional grant writer or do the work yourself. Using a professional can certainly strengthen the application and increase your odds of receiving the grant. It also can reduce your stress levels and free up your time to do other things, like run your business. Grant writers experienced with the program know the ins and outs of the process and what to pay special attention to. A good grant writer will be looking for any “problem areas” that may exist and will help you address those items before the application is mailed. However, the downside is the added cost of hiring a professional.

If you decide to do the work yourself, there are some steps you can take to simplify the process. Most importantly, have a thorough understanding of the program before you begin the process, and use the resources available to help you. Contact your state USDA Rural Development office; they will assist you through the application process.

If you are not sure if your project is eligible, ask ahead of time. Get a list of projects previously funded under the REAP and compare your idea to those projects. Make sure that the application reviewers will understand your business and how it works. If reviewers cannot clearly understand your business and how the proposed energy project(s) will fit, you will not score well.

Allow enough time to get all supporting evidence together and make all necessary decisions. Do you have the equipment and installer decided on? What will the entire cost of the project be? Do you know the local ordinances regarding permitting? Large projects over $200,000 may require information that can take a year to get, so find out early what will be required. Any money spent on equipment or installation before the application is mailed is ineligible for grant funds, but money may be spent on background items such as engineering or feasibility studies or permitting fees.

Make sure you have all the prep work done well before the grant deadlines, and don’t wait until the last minute. Avoid these common mistakes: sign the forms, number all pages, make sure your budget adds up, and keep an extra copy. Have another set of eyes review the application before submitting.

This is not an application where you can simply fill out and sign a few forms. The USDA wants to know that this is a good project that will be successful, and they need proof to make that judgment. These grant applications are scored by the government reviewers, with grant funds first going to the highest scoring applications and on down until the funds are gone.

The important thing to remember is that there is a record amount of money available for REAP this year, and USDA wants to spend the money funding eligible projects. If you carefully follow instructions for submitting the application, avoid mistakes, and present your information in a clear and concise fashion, you should have a good chance of receiving grant funds.

By the time you read this, it will be too late to meet the current application deadline of July 31. But now is the time to begin developing projects for the next round of grants. For more information on this grant opportunity, contact your state USDA Rural Development office or visit the USDA Rural Development website at www.rurdev.usda.gov.

The bottom line: there is potentially free money available for replacements and/or improvements in your (or your customers’) facilities. It is a win-win situation: you save money, you save energy, and you look good to your customers because they know your company is doing your part for the environment. If you’re an insulation professional who can use this program to help a customer fund a project, you help build your company image and improve client relations, in addition to selling more business.

Power plant insulation estimating is a lot like fishing: it looks deceptively easy, but there is a lot involved in the process.

Temptation

With fishing, you always want to go after the big fish, but they are not the easiest to catch. It is the same for power plant estimating. One of my personal temptations for the power industry is the challenge and complexity of the projects. Even though projects may appear to be similar at the surface, they are usually very different, whether in schedules, crew size, manufacturers, or project location.

A major part of the temptation for many is the opportunity to catch a lot of money. The contracts can be in the range of 20 to 30 million dollars or more, depending on the scope and schedule. The schedule can range between 12 and 18 months for a complete coal-fired unit. However, during the project there are many challenges, such as keeping the project on schedule and within the estimate to ensure you do not lose money. They can be so enormous you could lose sleep over them, or you could lose sleep because you might have left several million dollars on the table during the bidding. For the insulation contractor, other challenges may include managing large crews (perhaps more than 100) to execute the challenging and complex work of insulating a boiler and the possibility of having to deal with some workers inexperienced with power plant work.

Some contractors not experienced in power plant insulation might think, “We have our steady 60 man crew that can jump onto this project.” However, power plant insulation is far more complex than it seems at first glance. Even companies that have worked in refineries for years will find the experience entirely different than working on a power plant.

Preparation and Estimating

Just like preparing for a fishing trip, many things need to happen before you actually put together your estimate (go fishing). A complete power plant insulation estimate can take anywhere from 4 to 12 man weeks to put together. You will need to execute the following:

  • Assembling bid documents and drawings. I think technology has messed up this portion of bid packages. Everything comes electronically, possibly including civil and electrical drawings. Clients can say you have all the information and should know about interferences and other potential problems.
  • Understanding scope of work documents. You may need to lay out portions of the work that may not have detailed drawings but are required per the work scope documents.
  • Understanding the specifications. Do you understand the difference between a performance specification and an installation specification? What about the wind and snow loads referenced in the specification and how they will affect the estimate? Understanding the specifications also means understanding there could be multiple specifications and how they intertwine and mesh with each of the different manufacturers involved with a power plant estimate (e.g., overall project engineer, boiler manufacturer, AQCS (Air Quality Control System) manufacturer, steam turbine manufacturer).

Takeoff

This is the start of the fishing trip. You need to know where you are going and what you are fishing for. A full blown power plant takeoff will consist of multiple items, and you need to understand how each item is tied to specifications. The takeoff can consist of:

  • Boiler—HRA, finned and un-finned tube wall areas, the bull nose, wind box
  • Boiler penthouse
  • Boiler equipment
  • Boiler ductwork
  • SCR
  • AQCS
  • Ductwork
  • Fans—axial vs. centrifugal
  • Steam turbine
  • BOP equipment
  • BOP piping
  • Boiler proper piping

Piping can be broken down into:

  • System piping
  • Instrumentation
  • Vents and drains
  • Personnel protection
  • Equipment penetrations/skid piping
  • Field routed piping

There are several questions to ask yourself when performing your takeoff: Do you have the interface between isometric drawings and orthographic drawings? Is there piping duplicated among the different drawings? How do the P&ID drawings affect your piping scope? Also, you might want to ask, “Do I have the interface between two vendor suppliers correct?” (e.g., between the boiler and AQCS). Are there any holes in your takeoff in the interface between the two, and who has the design responsibility for the interface?

Materials

This is equivalent to bait for our fishing trip. You will use a variety of materials on a power plant estimate. Some of these materials will consist of:

  • Mineral wool
  • Calcium silicate
  • Fiberglass
  • Ceramic fiber
  • Pourable insulation
  • Sub-girts
  • Aluminum
  • Stainless steel
  • Galvanized lagging
  • Mesh

You might even see commercial materials for anti-sweat areas in water treatment equipment and/or in administration or other operation buildings. This depends on your scope of work.

You also need to be aware of materials required to be installed on flanged pairs and valves. Will they require oversized pipe insulation, hard cover boxes with suitcase latches, or removable blankets?

Putting Together the Estimate

While fishing, you may need to adjust for the specific situation, such as weather or water clarity. You must do the same when putting together an estimate. Typically when assembling the estimate, it is assumed the work will be performed in ideal conditions. From our baseline estimated productivities, you need to adjust for:

  • Local/jobsite practices (breaks, craft jurisdiction)
  • Weather in the project’s region—will there be snow, desert heat, rain?
  • Height
  • Work area congestion (stacking of trades)
  • Access to work area (scaffold or manlifts)
  • Crew size
  • Multiple shifts

Labor is the most important piece when assembling the estimate. Ensure that you have the correct:

  • Wage rates
  • Crew mix/profile (crafts, supervision, support crew)

What type of construction work schedule will you need to work? There are all kinds of different work schedules, especially during a tightening labor market. Make sure to allow for:

  • Outages
  • Multiple shifts
  • Additional mobilizations and de-mobilizations
  • Schedule requirements/reports: What are the schedule and report submittal requirements? Is a simple bar chart enough, or do you need to use Microsoft Project or P6?

Of course, safety is the first priority. Make sure safety costs are covered in the estimate, as these costs can affect both labor cost and equipment or consumable costs.

Review the bid documents to determine whether an on-site safety manager is required. This might be a requirement once you reach a specific crew size or for the entire project. Be aware of the site meeting requirements, whether all-craft weekly meetings, daily safety pre-task analysis with all site craft employees, or daily foreman safety meetings.

As for additional safety equipment, high visibility vests may be required, or there might even be special ANSI requirements for work boots. And what about fall protection requirements for the high work that may be included?

Also when assembling the estimate, review equipment requirements closely. Equipment can be a big cost for a power plant project, depending on the scope of work. Typical equipment can be:

  • Office trailers/change shacks
  • Material hoist
  • Gators
  • Pickup trucks
  • Man lifts
  • Fork lifts—variable reach
  • Welding machines
  • Construction elevator
  • Portable toilets
  • Dumpsters
  • Scaffolding

If you self-perform or subcontract your scaffolding, it could represent 15 to 35 percent of the total application cost.

Subcontracting can play a big part of assembling the estimate. You need to understand your subcontractor’s scope of work. Typical subcontracts are:

  • Scaffolding
  • Painting
  • Refractory
  • Heat tracing

The Proposal

In fishing, this would be preparing your catch of the day either to eat or for the taxidermist. In preparing a proposal for a power plant estimate, you will typically have to prepare:

  • Bid form. These can be simple (1-2 pages) or complex (150 pages), where every drawing will have its own pricing breakout.
  • Clarifications. These can also be complex, with contractual, pricing/commercial, and technical clarifications. The biggest question is deciding whether to clarify in the proposal. If the project goes smoothly, the clarifications may never be an item of discussion. But how many power projects go absolutely smoothly?
  • Safety questionnaire/information. If your safety numbers are not adequate, you could be disqualified.

Other items typically requested in a proposal are:

  • Organizational charts
  • Project staff resumes (could include project management, supervisory, safety, clerical, and scheduler staff)
  • Work plan
  • Past project experience
  • Submittals (Material Technical Data Sheets, Material Safety Data Sheets, detail drawings)

Estimating power plant insulation is complex, and the execution is even more complex. Discussion of the execution will have to be left for another issue. Meanwhile, I hope these analogies will be useful if you embark on an estimate for power plant insulation.

The National Insulation Association’s (NIA’s) 2008 Industry Measurement Survey results indicate that the industry in 2007 experienced a 39.1 percent growth over 2006, while in 2008 it grew 5.9 percent over 2007, putting the mechanical insulation market at $13.6 billion with a compounded growth of 47.3 percent over 2006.

The NIA Industry Measurement Survey began in 1997, with an estimated market size of $6.2 billion. The market has more than doubled in 12 years.
The overall survey methodology has been consistent from year to year. The ratio of labor to material and the percent of material flowing through the distribution channel have been adjusted from year to year to reflect current trends, but the overall methodology of calculating the results has not changed.

The survey does not include data related to metal building insulation (MBI); heating, ventilating, and air-conditioning (HVAC) duct liner; original equipment manufacturer (OEM) products; building insulation; refractory products; other specialty insulations; or insulation products or technologies not currently in the NIA World of mechanical insulation products. The value added by fabricators and laminators has not been accounted for, nor has the potential impact of imported products. The consistency of participation by larger manufacturers, combined with the consistency of tabulating the results, provide some comfort when examining the overall market size and growth rates. However, based on the items not accounted for in the summary, the annual totals can only be considered conservative.

Mechanical insulation is defined to encompass all thermal, acoustical, and personnel safety requirements in:

  • Mechanical piping and equipment for hot and cold applications
  • HVAC applications
  • Refrigeration and other low-temperature piping and equipment applications.

Mechanical insulation applications in the commercial sector include education, health care, institutional, retail and wholesale, office, food processing, light manufacturing, and similar facilities, while the industrial section includes power, petrochemical, chemical, pulp and paper, refining, gas processing, brewery, and heavy manufacturing facilities.

Surveys can be useful tools for all facets of the industry for benchmarking; providing meaningful information to shareholders, investors, or the financial community; informing current or recruiting potential employees; developing strategic or tactical business plans; reviewing historical trends and projecting future performance; and a host of other uses. This survey provides a 30,000-foot view of the mechanical insulation market, which is a portion of the overall NIA World of commercial and industrial insulation.

The information obtained from reviewing any survey is subject to individual interpretation; the NIA Industry Measurement Survey is no exception to that rule. That being said, there are a few general observations or interpretations worth noting from a national perspective. Regional or local trends may or may not be applicable to these national observations. These observations are also product and labor affiliation generic.

  • The market growth was driven more by demand than by price. The ratio between the two is not known, but it is generally felt that during 2007 and a portion of 2008, price did play a positive role. However, price potentially had a negative effect in the latter half of 2008.
  • The estimated ratio of labor to material and percentage of material flowing through the distribution channel did not substantially change from year to year, which supports the market growth observations.
  • Informal surveys indicated margins at the contractor and distributor level increased over the 2-year period; however, erosion begin in mid to late 2008. The informality of the margin survey did not yield an aggregate estimate, so margins were left unchanged for consistency of reporting.
  • As discussed in previous surveys, determining the mix of commercial and industrial applications was not within the survey’s scope. However, a general consensus was that both markets were strong in 2007. The commercial market began showing some signs of weakening in the second and third quarters of 2008, while the industrial market remained relatively strong.
  • Initial discussions related to the survey results were overshadowed by the current economic trends, especially in the commercial segment. The impact of the economic recession is being felt by all industry segments, and its extent will be determined in the next survey. It is important to remember that any decline is starting from a much higher base.
  • Industry has focused on the importance of energy conservation and efficiency and the reduction of greenhouse gas emissions for years. It is felt those initiatives did play a role in the growth over the 2-year period, but the extent could not be determined with the current survey methodology. The increased focus on energy independence, protecting the environment, and job creation in the economic recovery will elevate the importance of mechanical insulation’s contribution and support new growth opportunities.

Overall, 2007 and 2008 were good—some would say great—years for the industry. The industry grew significantly in a relatively short period. All segments (manufacturing, distribution, fabrication, and contracting) responded successfully to the challenges that growth spurts can bring. But there was little time, if any, for celebration, thanks to the economy. Before the ink was dry on 2007, the industry’s success was overshadowed by economic fears. It seemed 2008 was a year of caution and preparation for the expectations of 2009 and beyond. Welcome to the real world: Yesterday was great, but what does tomorrow bring?

The NIA World of commercial and industrial insulation has confronted many obstacles in its history. It has always responded, rebounded, and grown over time. The U.S. and global economies are presenting challenges, the scope of which may not have been seen in quite some time, but they are also presenting opportunities. Mechanical insulation is on the verge of finally being recognized for its value as a viable and meaningful energy conservation/efficiency and greenhouse gas reduction initiative, a contributor to the sustainability or green movement, and a “shovel ready” option to support the economic stimulus package. Now could be the time many of us “old timers” have always dreamed of.

Our industry is strong, prepared for tomorrow’s challenges and positioned to address opportunities. We should celebrate our success in 2007 and 2008, and although it may be difficult to believe today, we will eventually celebrate the opportunities created by the current economy.

To the NIA Associate members who participated in the survey, to all the individuals who contributed to the informal survey supporting data, and to all contributors to NIA’s Foundation for Education, Training, and Industry Advancement: thank you! The Foundation and your support are making a difference.

For those in the mechanical insulation industry, the information in this article will be the basis for the old cliche “I told you so.” For doubters, recent findings from the Department of Energy should certainly change your perspective as to the value of this proven, but often forgotten, technology.

This article will examine documented benefits of mechanical insulation in the industrial maintenance market and the difference a modest increase in mechanical insulation would make in the industrial and commercial building industries. The time is now to educate everyone about the benefits of properly specifying, installing, and maintaining mechanical insulation. Assess the opportunity in your facility or company and allocate the resources to make it happen.

Analyzing the Benefits of
Mechanical Insulation

Mechanical insulation systems are used for thermal, acoustical, and personnel safety reasons on piping, equipment, vessels, ducts, boilers, and similar mechanical equipment in industrial and commercial applications. Mechanical insulation intersects with a wide variety of industries, from power and process plants to small manufacturing to schools, hospitals, office buildings, etc. Mechanical insulation has never received the same governmental or business attention as the residential sector and more glamorous energy efficiency/emission reduction initiatives. Some reporters have made comments like “mechanical insulation is not an exciting subject” and “it is hard to get people interested,” although it is important to all industries and to our country’s overall goal of energy independence, climate change, and job creation.

The U.S. Department of Energy’s (DOE’s) Industrial Technologies Program’s (ITP’s) mission is to improve national energy security, environment, and economic competitiveness by transforming the way U.S. industry uses energy. Save Energy Now (SEN) is a national initiative of the ITP to drive a 25 percent reduction in industrial energy intensity in 10 years. Companies nationwide can participate in no-cost energy assessments and utilize ITP resources to reduce energy use while increasing profit. The ITP is a great example of how government and private industry can work together on common objectives.

The SEN program has conducted industrial energy assessments since 2006 on potential energy efficiency and conservation opportunities, including mechanical insulation, across many operational disciplines and applications. Based on the depth and breadth of those assessments (over 700 at the time of developing the data in this article), the National Insulation Association (NIA), a long-time partner with the ITP, asked to work with the ITP and Oak Ridge National Laboratory (ORNL) team to mine the findings related to mechanical insulation and to extrapolate that data across the universe of plants included in the ITP assessments.

The SEN mechanical insulation assessments were primarily focused on process heating and steam systems under existing conditions within the various facilities. Accordingly, the assessment results do not represent the total energy or emission reduction potential for those plants, and the findings can best be characterized as industrial insulation maintenance opportunities.

The analysis’ objective was to determine the potential of mechanical insulation-related energy savings, greenhouse gas emission reduction, and job creation within the plant universe focused on by the ITP.

  • The plants were segregated into three size categories:
    • Large Plants— >500 BBtu/yr. Assessments were conducted by independent assessors approved within the SEN program. The power/utility industry segment was not included.
    • Medium Plants—using 26?500 BBtu/yr. Assessments were conducted by the ITP’s Industrial Assessment Centers (IAC).
    • Small Plants—using
  • The numbers of plants by the size categories were determined from the 2002 Energy Information Administration (EIA) Manufacturing Energy Consumption Survey (MECS-2002). Those plants were then subdivided into those included in the focus of the ITP assessments and those that were not (apparel, leather and allied products, printing, and furniture).
  • Assessment results were then extrapolated over the total number of plants within the large and medium plant categories.
  • NIA estimated the annual return on investment (ROI) based on a simple calculation over a 20-year life with 3 percent annual energy cost escalation.
  • NIA estimated the value for the small plant category based on an assumption of value relative to the medium plant category.
  • The assessments included an estimated payback in months. NIA used that information for a series of calculations to estimate the number of jobs that could be created or preserved. Products for the mechanical insulation industry flow through the distribution channel; accordingly, NIA was also able to estimate the job impact on that channel.

These impressive numbers are supported by the findings of over 700 assessments in the large and medium plant category. And they illustrate only a portion of the opportunity in the industrial maintenance market. Similar opportunities in the commercial industry are not included in the analysis.

ORNL’s Dr. Anthony Wright, an expert on energy efficiency best practices, said, “Many of the large and medium plant energy assessments sponsored by the U.S. Industrial Technologies Program have identified mechanical insulation improvements as an important savings opportunity. Improvements in mechanical insulation in large and medium U.S. industrial plants are often a cost-effective opportunity for reducing energy use and energy costs and should be seriously considered.”

To put the $2.5 billion in energy savings in context, President Obama’s goal is to save $2 billion per year from increasing energy efficiency in government buildings using all technologies combined.

What would a similar analysis show for the public utility/power industry? NIA is still refining that estimate, but preliminary findings indicate the potential of an additional $1.1 billion per year in energy savings, 10 million metric tons in CO2 emission reduction, and creating or preserving an additional 12,568 jobs—with a payback in 17.2 months or 73 percent annual ROI.

The Challenges of Implementation

Mechanical insulation maintenance is an unprecedented opportunity for energy efficiency, improving carbon footprint, improving the bottom line, and stimulating our economy with the creation of “green jobs.” That is a winning combination that should not be overlooked at any level, either the board room or the operating floor.

The additional benefits of maintaining mechanical insulation systems in a proper and timely manner have not been considered in this analysis. Those benefits include personnel safety, helping prevent corrosion under insulation and the development of mold, increased plant productivity, and extending the life of equipment. If the energy and emission reduction benefits were not compelling enough, these benefits should make companies ask: why has mechanical insulation been overlooked or put on the back burner, and how can we immediately implement plans to take advantage of this technology?

As a general rule, mechanical insulation systems are not being maintained in a timely and proper manner. This is why 10 to 30 percent of installed mechanical insulation systems are estimated as being damaged or missing within a few years of initial installation. The ITP assessments to a certain extent validate those findings.

An investment in mechanical insulation maintenance, if avoided or delayed, could cost much more than the initial investment. In many companies, mechanical insulation maintenance is viewed as a short-term expense versus an investment, even though the return is in many cases less than a year.

To take full advantage of mechanical insulation, it is essential to begin thinking differently about mechanical insulation and the value it can provide. While mechanical insulation is not an exciting topic, it is a resource that, when all the benefits are considered, should prompt the question: “Why haven’t we thought of this before?”

Going Beyond the Minimums:
New Construction

The most widely accepted benefit of mechanical insulation is energy savings. In new construction, it would be logical to assume the specifications have taken into consideration “economic thickness” calculations. However, that assumption could be dangerous. The cost of energy has increased substantially over the last 10 to 20 years, but in many cases the insulation specification has not kept pace. But, for the sake of discussion, let us assume current specifications have taken energy cost increases into consideration.

No single mechanical insulation thickness standard or guideline is recognized across the U.S. commercial and industrial markets. There are many excellent publications; however, ASHRAE 90.1 2004 or 2007 is the most recognized standard or guideline for the commercial market. ASHRAE 90.1 2007 includes tables reflecting minimum values or thicknesses for mechanical insulation. Section 6-Subsection 6.4.4.1 addresses insulation. Tables 6.8.2A and B assign minimum R-values for duct and plenum insulation, while Table 6.8.3 provides minimum thicknesses for pipe insulation. Again, for the sake of discussion, assume all specifications are based on the minimum requirements established by these ASHRAE tables.

The question then becomes: If you went reasonably beyond those minimums, what would be the impact? What if your primary objective was energy efficiency and the environment, and the economical thickness methodology came second?

It is important to note that while many codes and standards reference the levels established in ASHRAE 90.1, those minimum levels are not necessarily installed. Often “value engineering” alternatives are accepted and/or the ASHRAE standards are interpreted or applied incorrectly. Also, the ASHRAE standards are not universally recognized in the industrial market segment; thus, the minimum level may not be observed in those applications.

Going beyond the minimums is a real and viable alternative that should be considered. However, when examining and determining the final thickness/thermal performance recommendation for the insulation system(s), code compliance and competitive impact on the overall industry should be considered in addition to the energy and environment benefits.

Going Beyond the Minimums: Pipe Insulation

Through an informal survey of several insulation manufacturers, it was determined 370 million linear feet of pipe insulation is sold annually (2009 estimate) into the commercial and industrial markets. Several assumptions needed to be made for this analysis:

  • The piping market is equally divided into four operating conditions.
  • Determine a representative pipe size within each of the operating conditions.
  • Determine an insulation product/system for each operating condition, although each has multiple excellent system options. The products selected do not indicate a preference or recommendation for those products in those applications. They were simply chosen for illustrative purposes. Alternative insulation systems could be used in these examples with differing results.

Based on these assumptions, the impact of increasing insulation thicknesses above the ASHRAE minimums exceeded expectations and should be considered.

This simple analysis yields the potential of more than $302 million annually in energy savings, the reduction of 1.5 million metric tons of CO2 emissions, and the creation of more than 2,000 jobs.

Going Beyond the Minimums: Heating, Ventilating, and Air Conditioning (HVAC) Insulation

Using the same approach with HVAC was not quite as easy. The ASHRAE HVAC insulation selection process includes considering seven climate zones (see Figure 4), four types of service, and seven different duct locations. The assumptions were:

  • Climate Zone 5 would be used for all examples.
  • The existing “insulated” duct would be “dual service” (heat/air conditioning) and be in an “unconditioned space.”
  • The “un-insulated” duct would be “dual service” (heat/air conditioning) and be in an “indirect conditioned space.”
  • Although several different products could be used, for simplifying purposes one insulation system was selected. The system selected does not indicate a preference or recommendation for that system in those applications. It was simply chosen for illustrative purposes. Alternative insulation systems could be used in these examples with differing results.

As with pipe insulation, an informal survey determined that 2.7 billion square feet of duct is installed annually (2009 numbers) and, of that, approximately 72 percent is not being insulated. Based on that information and the assumptions, the impact if insulation thicknesses were marginally increased over the ASHRAE minimums was determined. The results far exceeded expectations.

The HVAC insulation analysis yields annually more than $900 million in energy savings, the reduction of 4.3 million metric tons of CO2, and the creation of more than 60,000 jobs.

The Bottom Line

These examples illustrate the huge energy efficiency opportunity in the industrial and commercial sectors: $4.8 billion in energy savings, a reduction of 43 million metric tons of CO2 emissions, and 89,000 new jobs. The CO2 reduction would be the equivalent of shutting down nine coal plants.

Mechanical insulation maintenance does not require research or an extensive engineering process. The scope can be identified, an RFQ issued, and the work initiated in weeks. It is truly “shovel ready” and pays for itself over and over again.

If we are serious about long-term energy independence, climate change, and a recovering economy, we need to think about insulation differently when it comes to examining minimum guidelines or traditional approaches. Even a modest increase can have a significant impact. As our country continues to examine all forms of new energy and improving existing technologies, we should not forget proven energy efficiency/conservation and emissions reduction technologies. Mechanical insulation is one of those technologies, although it has long been forgotten or overlooked.

The findings discussed in this article should create a “red alert” in facilities and companies, at code and regulatory agencies, and at all levels of government to examine the mechanical insulation opportunities right in front of them.

Every day we hear about the energy efficiency and emissions reduction benefits of lighting, windows, envelope insulation, solar panels, wind turbines, etc. Those initiatives should be explored, but what about mechanical insulation? It has been around for centuries and is proven, ready now, and on a dollar-for-dollar basis a better value than many other initiatives that get all the press coverage and attention of federal, state, and local officials. The time is now to educate everyone about mechanical insulation, assess the opportunity, and allocate the resources to make it happen.

A special note of appreciation is extended to Bill Orthwein with the DOE’s ITP and Dr. Anthony Wright and Sachin Nimbalkar with ORNL for their commitment and support in helping mine the large and medium plant data from the ITP assessments, as well as to Chris Crall for his work helping develop the “Going Beyond the Minimum” estimates and to all the insulation manufacturers who assisted in the informal surveys.

Note: Some of this data was derived using ASHRAE tables and 3E Plus.

Figure 1

Number of Plants

Figure 2

Analysis Results

Figure 3

Pipe Insulation Beyond the Minimums

Figure 4

DOE U.S. Climate Zones

Figure 5

HVAC Insulation Beyond the Minimums