The Commercial and Industrial Mechanical Insulation Market is Growing
Survey Indicates 2013-2014 Growth and Predicts Modest Growth in 2015-2016
Every 2 years, the National Insulation Association (NIA) conducts a survey to gauge the size of the insulation industry. This survey began in 1997 and sought to gain data about the size of the insulation industry. Sponsored by NIA’s Foundation for Education, Training, and Industry Advancement, the survey aims to provide valuable data regarding market size and growth rates for the U.S. commercial and industrial mechanical insulation market. The NIA members who participated in the survey provided information to an independent, third-party company. The company took that information and applied a formula created by NIA to extrapolate the annual size of the insulation industry in the United States.
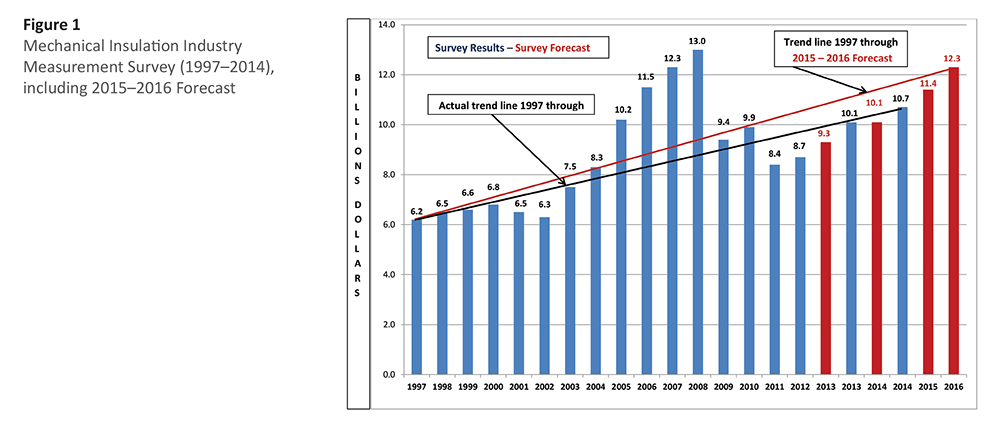
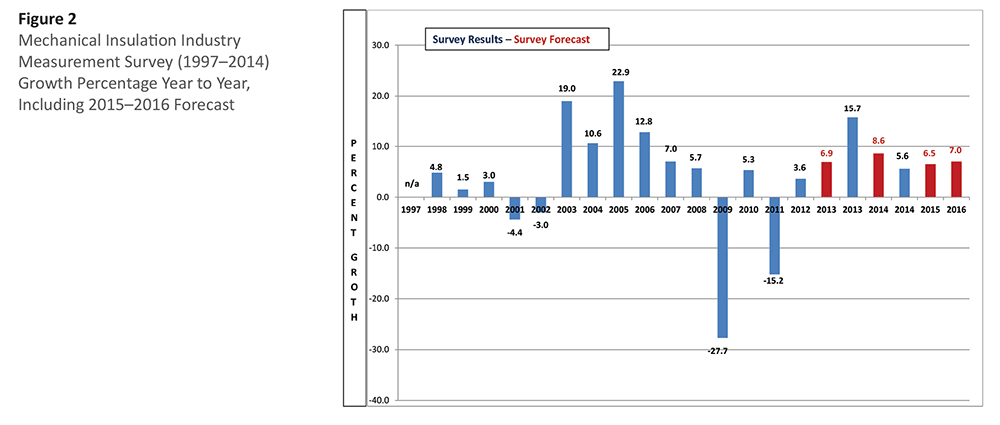
The latest mechanical insulation industry survey was conducted in the first quarter of 2015 to determine industry growth from 2012 through 2014 and to obtain an indication of growth for 2015 and 2016. The survey results indicated the market had grown from $9.3 billion in 2012 to $10.1 billion in 2013, a 15.7% growth over 2012; to $10.7 billion in 2014, a 5.6% increase over 2013; and $11.4 billion in 2015, a 5.6% increase over 2014. The industry is forecasted to reach $12.3 billion in 2016, an increase of 7.0% over 2015.
Findings
The mechanical insulation industry as a whole is continuing to rebound from the recent recession. The recovery is not uniform across market segments, the country, by region, state, or even within states. The good news is that the industry is recovering and the signs are there for continued moderate growth. Figure 1 on page 8 exhibits the industry growth trend over the last 18 years (1997 through 2014) and the forecasted growth for 2015 and 2016.

The survey indicated gross margin improvement in the distribution and contractor channels, which is welcome news after a decline over the previous 2 years. With margin increases in those channels, it is a good assumption that the manufacturing segment also experienced a margin increase. Overall, between 20–25% of the 2013 and 2014 growth is attributed to margin increases.
Figure 2, on page 10, illustrates the growth percentage in the industry year to year. 2005 marked a high, with a 22.9% growth rate, with 2009 marking a low of -27.7%. Annual
fluctuations are to be expected and are caused mainly by changes in the overall economy. It is important to note the compounded annual growth rate, which refers to industry growth over the entire 18-year period, is 6.6%.

The 2012 survey respondents indicated they expected a 6.9% increase in 2013 over 2012, and an 8.6% increase in 2014 over 2013. The actual results were 15.7% and 5.6%, respectively. In dollars, the projected market size was $9.3 billion and $10.1 billion. The latest survey indicated $10.1 billion in 2013 and $10.7 billion in 2014. For the 2-year period, actual results exceeded the forecast by 6%. If that same trend continues for 2015 and 2016, the market could reach the 2008 industry high of $13 billion.
The 2015 and 2016 forecasts varied greatly, ranging from zero growth to over 20%. Growth was expected in both units and dollars (price increases). On average, 75–80% of the growth forecast was derived from unit growth, which illustrates either core industry growth or simply an increased demand for products and services.
The survey also exhibited a higher ratio of accessory materials in comparison to primary core insulation materials. It is believed this indicates an increase in the use of laminate and other types of finishing systems versus traditional approaches. It may also indicate the growth in the industrial and/or below-ambient market segments was greater than the commercial building market.
Survey Methodology and Assumptions
Survey results are always subject to individual interpretation. Following is information about the survey and some potential takeaways that have been developed in conjunction with analysis both before and after the tabulation of the survey data.
- The survey is based upon dollars, not units, and a consistent approach has been utilized over the 18 years. Based on the survey methodology, the results should represent a conservative number.
- The survey does not include data related to metal building insulation; heating, ventilating, and air-conditioning (HVAC) duct liner; original equipment manufacturer products; building insulation; residential insulation; refractory products; other specialty insulations; or insulation products or technologies not currently encompassed in NIA’s scope of mechanical insulation products. The value added by fabricators and laminators has not been accounted for, nor has the potential impact of imported products outside North America been included. The survey excludes major project >scaffolding requirements and similar-type project requirements. Informal surveys were conducted to determine margins and labor-and-material
ratios. Variations in those results could affect the total insulation market estimate. - Insulation products include any/all accessory products when sold as an integral part of the manufacturer’s products (e.g., all-service jacket [ASJ] or other facing on blanket, board, or pipe covering). The survey is intended to show a “national” picture for the respective calendar year. Based upon observations, there are significant geographical and product variances to the survey results. This is not inconsistent with any survey of this broad nature.
- The 2015 and 2016 forecasts seem to be reasonably in line with overall commercial andindustrial construction market forecasts. The forecast does not break out growth
expectations between the commercial or industrial market segments, or between new construction, retrofits, and/or maintenance applications.
Historically, a forecast of this nature includes a blend of these applications, with new construction being the largest percentage. Regardless, the growth forecasts are welcome news given the tumultuous growth and decline experienced between 2005 and 2011.
- Unfortunately, the survey methodology does not allow for interpretation between the commercial and industrial market segments, or between types of applications or contracts. As stated in previous surveys, the unit increases or decreases were probably led by the commercial segment, while the dollar increase may have been somewhat equivalent.
Conclusion
It is much easier to report on and to respond to the challenges of growth versus a declining market, such as was experienced from 2009–2011. Overall, the future is looking bright, but will not be without its challenges.
We should not undervalue the impact that NIA’s efforts and other industry educational and awareness initiatives have had on the industry. Without those efforts, the bottom of the recent recession may have been deeper, the recovery slower, and the growth trends not as promising.
Copyright Statement
This article was published in the June 2015 issue of Insulation Outlook magazine. Copyright © 2015 National Insulation Association. All rights reserved. The contents of this website and Insulation Outlook magazine may not be reproduced in any means, in whole or in part, without the prior written permission of the publisher and NIA. Any unauthorized duplication is strictly prohibited and would violate NIA’s copyright and may violate other copyright agreements that NIA has with authors and partners. Contact publisher@insulation.org to reprint or reproduce this content.
