A Practical Guide to Industrial Sound Control
Sound can affect workers’ comfort, performance, and even health. Industrial noise poses a hearing threat to approximately 22 million workers in the United States each year.1 One in eight of those employees will experience hearing damage due to prolonged exposure to high sound level environments.2 Noise can also cause safety concerns, interfering with communication and masking notification sounds of hazards such as forklifts.
The most cost-effective time to address industrial noise is during design and construction. Understanding how sound is created and propagates, as well as evaluating the performance of different materials and assemblies, can help reduce noise at the source. Mitigating noise effectively requires a basic understanding of the science of sound and the tests that evaluate materials’ noise reduction performance.
The Science of Sound
Sound is created when a vibrating object excites the surrounding air. As air molecules collide and transfer energy away from the vibrating surface, a pressure wave travels throughout the surrounding space and reaches the ears. The wave then turns into an electrical signal within the middle ear, allowing your brain to recognize and process the sound. This basic interaction (vibration, wave, reception) is at the heart of everything acoustic.
Our ears can detect sounds across an enormous range. There is a difference in pressure of over 100,000 times between the softest hum and a loud industrial noise. Engineers rely on the decibel (dB) scale to quantify sound.
Introduced to measure signal loss over telephone lines, the decibel, named in honor of Alexander Graham Bell, is the standard for evaluating sound levels. Because the decibel is logarithmic, a seemingly small increase in decibels can represent a significant rise in sound energy and potential harm. To further quantify the relationship between what the ear hears and the measured sound level, a filter called A-weighting is applied to measured sound, resulting in measurements labeled dBA. This measure represents the sound that the ear senses, while considering the lack of sensitivity of the ear at lower frequencies.
A small change in decibels can represent a large change in actual sound energy. A 3 decibel reduction, just noticeable, requires cutting the emitted sound energy by half. To make the sound half as loud, you must reduce it by 10 decibels, which requires a 90% reduction in sound energy. Smart noise control should start early—it’s far easier to reduce sound at the source during the design stage.
Industrial Sound
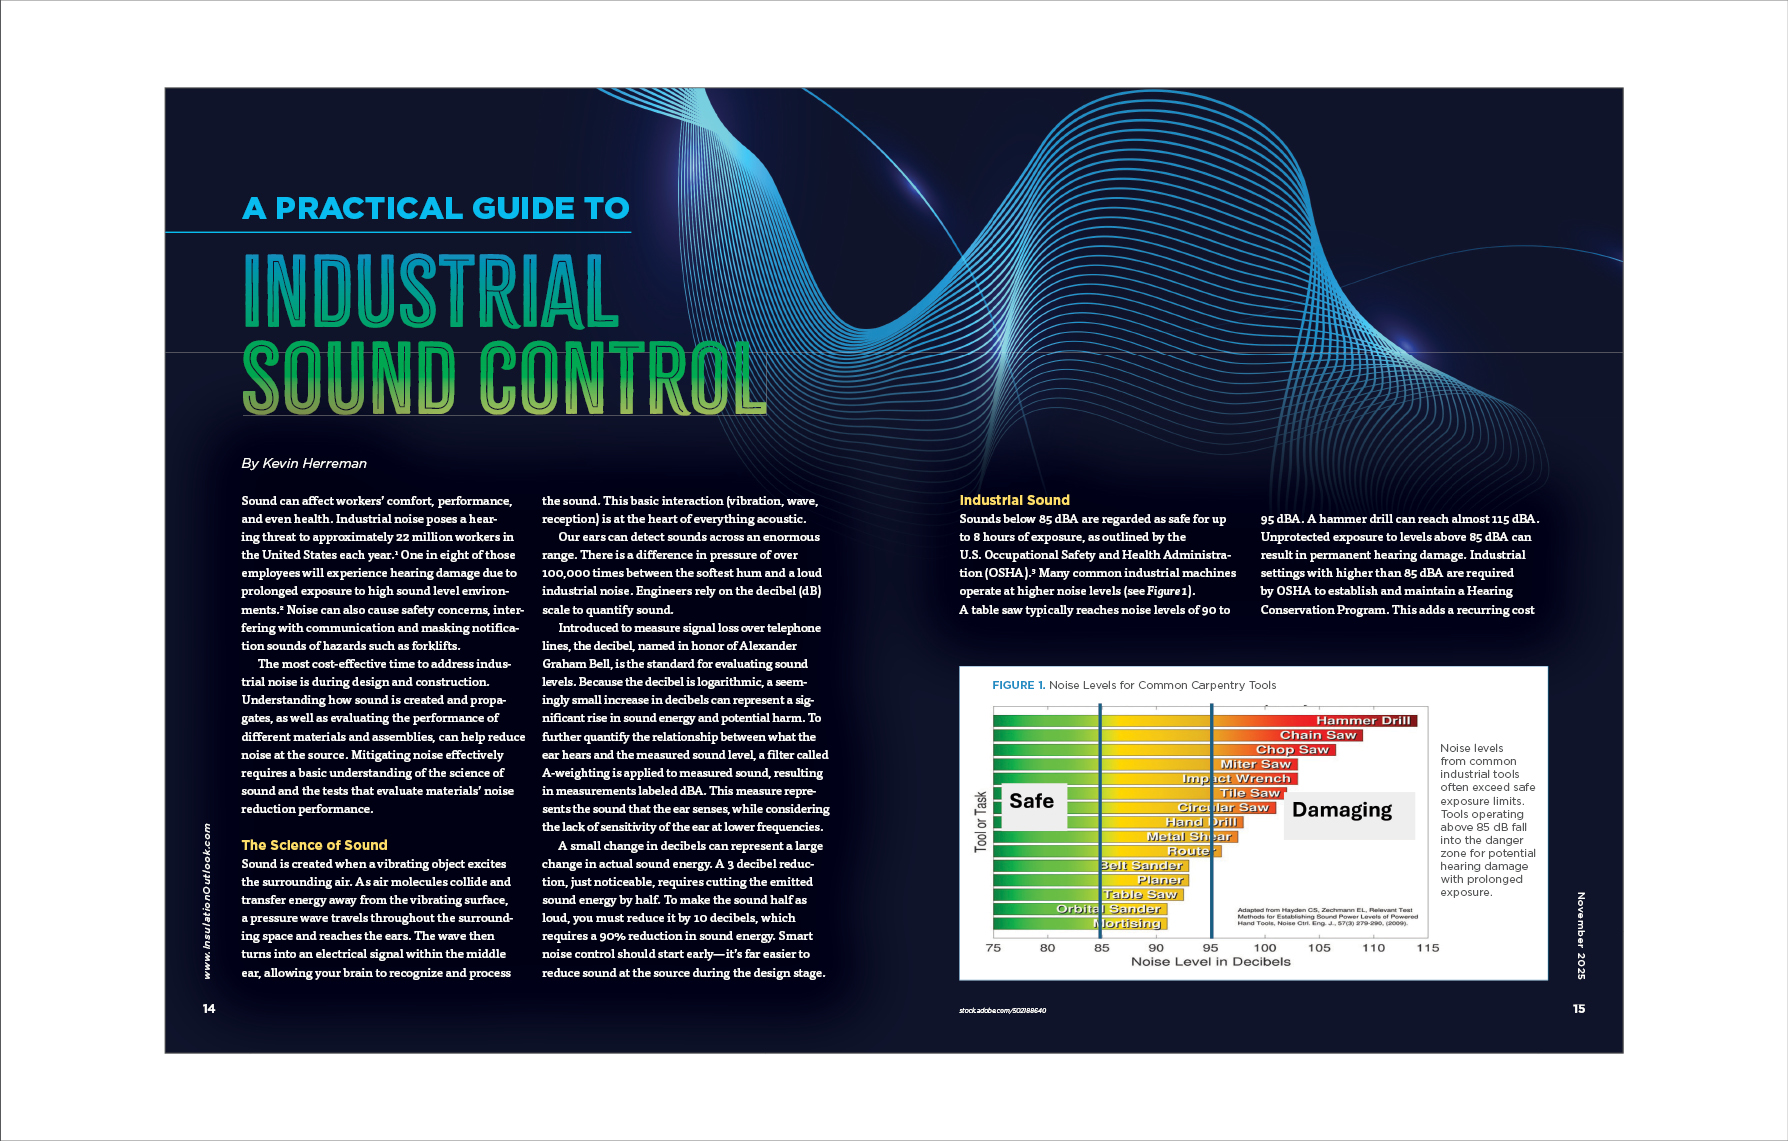
Sounds below 85 dBA are regarded as safe for up to 8 hours of exposure, as outlined by the U.S. Occupational Safety and Health Administration (OSHA).3 Many common industrial machines operate at higher noise levels (see Figure 1).
A table saw typically reaches noise levels of 90 to 95 dBA. A hammer drill can reach almost 115 dBA. Unprotected exposure to levels above 85 dBA can result in permanent hearing damage. Industrial settings with higher than 85 dBA are required by OSHA to establish and maintain a Hearing Conservation Program. This adds a recurring cost to employers, and if hearing impairment affects workers, costs can be higher. It’s estimated that average U.S. occupational hearing loss claims cost businesses between $49 to $67 million each year.4
Common Methods of Industrial Noise Control
Engineers use three methods to analyze sound performance:
- Sound absorption,
- Transmission loss, and
- Insertion loss.
Sound Absorption
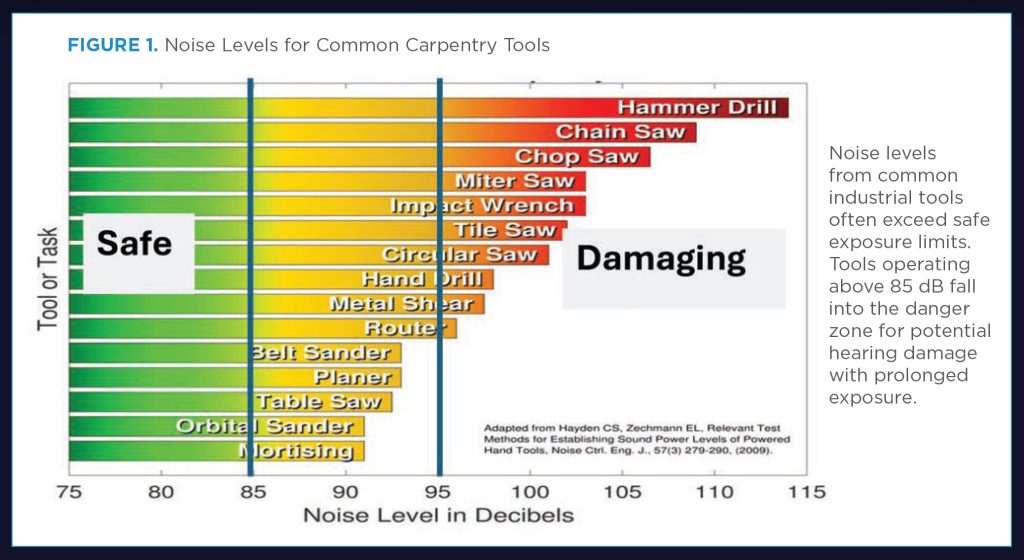
Sound absorption represents how well a material reduces sound energy (see Figure 2). It is a function of how resistive a porous material is to airflow through it. Absorption performance is typically evaluated using ASTM C423 Standard Test Method for Sound Absorption and Sound Absorption Coefficients by the Reverberation Room Method, which assesses the bulk absorption of an acoustic material in a reverberation room. The result is often summarized and reported using the noise reduction coefficient (NRC), a single-number rating that reflects average absorption across several frequency bands. NRC ratings for many materials/products are published by multiple trade associations and building material companies.
A common misconception is that an NRC of a decimal value directly correlates to percent of sound absorbed by a material. For example, it is commonly thought that an NRC of 70 means a material absorbs 70% of sound. The NRC is determined by measuring the area of sound absorption provided by the material/product and then dividing that by the surface area of the material/product. So, the NRC is the percentage of the material/product that is fully absorbing sound. This comes into play when comparing the NRC of materials. There is little noticeable difference between an NRC of 0.70 and 0.75 when treating a small space. Adding a little more surface area of a slightly lower NRC material can make up that difference.
Thicker materials generally absorb more sound energy than thinner ones. Thickness is the easiest and most efficient way to increase sound absorption. If thickness cannot be increased, then density can be leveraged to gain absorption at lower frequencies. Higher frequency sound absorption will typically decrease as the material density increases. An alternative to increasing density could be to add a facing or scrim, which can be tuned to optimize the sound absorption of the material at a specific thickness.
Transmission Loss
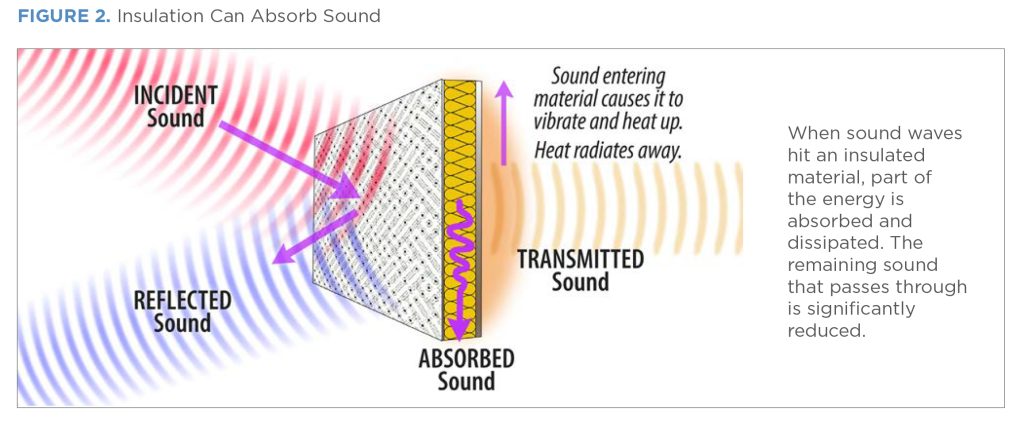
Transmission loss refers to a sound’s energy reduction as it passes through a barrier typically a wall, floor, or ceiling assembly. Wall transmission loss is measured according to ASTM E90 Standard Test Method for Laboratory Measurement of Airborne Sound Transmission Loss of Building Partitions and Elements (see Figure 3). Sound is played and measured on the source side of a partition wall (source room) and measured on the receiving side (receiving room) at the same time. The amount of energy absorbed by the receiving room is determined and added to the measured amount in the receiving room. The logarithmic ratio is determined between the two sides, and the result is the transmission loss of the partition wall. The transmission loss is a characteristic of the partition wall assembly because it is a result of all the materials in the wall. Transmission loss of the partition wall is compared to a reference curve, per ASTM E413 Classification for Rating Sound Insulation, to develop a single-number rating called the sound transmission class (STC). The STC ratings for wall constructions are published by multiple trade associations and building material companies. Transmission loss is commonly used in architectural applications to meet minimum STC rating requirements.
Insertion Loss
A sound level is recorded in a space; then, a barrier or treatment is applied, and the sound level is measured again. The difference in sound level before and after is the insertion loss. The value represents the amount of sound reduced by the treatment. This type of measurement works well to compare products in the same setup. However, the measurements are both dependent on the material/product and the measurement location/setup. Multiple standards determine the insertion loss of products and systems to provide data for comparison of performance. There are subtle differences in how standards measure the insertion loss; however, the formula for calculating the insertion loss remains the same:
Untreated Sound Pressure Level (SPL) (dB) – Treated SPL (dB) = Insertion Loss (dB)
Industrial Noise Control
Interventions to reduce industrial noise from piping typically involve applying acoustic treatments to limit sound radiated from the pipe. ISO 15665 Acoustics – Acoustic Insulation for Pipes, Valves and Flanges and ASTM E1222 Standard Test Method for Laboratory Measurement of the Insertion Loss of Pipe Lagging Systems are two standards for measuring the insertion loss of pipe treatments (see Photos 1 and 2).
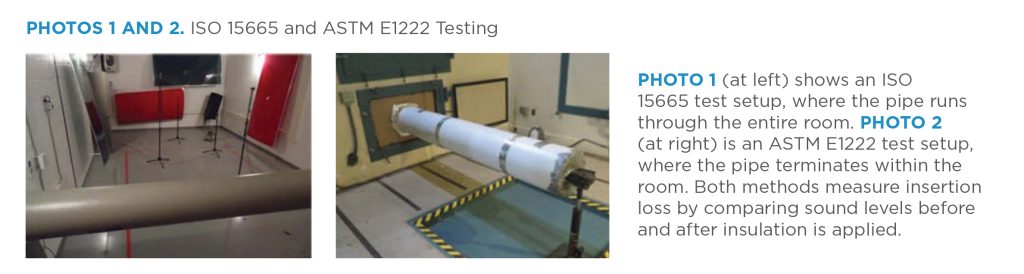
The ISO 15665 test mounts a pipe that runs through a test chamber where sound energy is applied to the interior of the pipe. It then runs from the test chamber through one wall, across the room, and out through the other wall. The sound radiated into the test chamber is measured before and after treatment, determining the insertion loss. The ISO 15665 standard provides a table to compare the results and identify a “class” rating. The rating is based on the pipe interior diameter and insertion loss at multiple frequency bands. These class ratings allow a design engineer to choose the amount of insertion loss for their application. The classification was recently expanded to include a Class D in an update to the ISO 15665 standard.5
Another option for determining insertion loss of pipe treatments, or lagging, is ASTM E1222. ASTM E1222 differs slightly from ISO 15665 in that the end of the pipe remains in the room. Theoretically, you should get the same result from each test, but in reality, the values can differ. ASTM E1222 insertion loss values are reported in a chart and/or table format by frequency band. There are no class ratings for this standard.
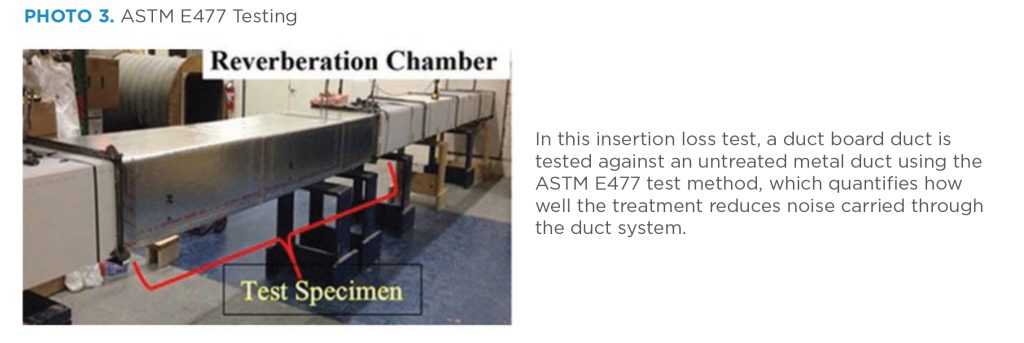
Insertion loss in air distribution systems is measured utilizing ASTM E477 Standard Test
Method for Laboratory Measurements of Acoustical and Airflow Performance of Duct Liner Materials and Prefabricated Silencers (see Photo 3). This test method measures the sound transmitted through a duct system with a 10-foot-long test section, first with an empty duct, and then with a treated duct or duct silencer with the same internal dimensions as the empty duct, providing values by frequency band for how much sound levels are reduced through the 10-foot-long test section. Results are presented as the overall insertion loss and the amount of reduction in dB/foot, giving information on the performance of the system as it will be operated. This test is especially relevant for treatment of HVAC system noise in spaces where quiet air delivery is crucial.
Some manufacturers only make available sound absorption data for their duct products following the ASTM C423 standard, providing only sound absorption coefficients. Unfortunately, the sound absorption results do not correlate to the material’s performance in use.6
Sound absorption following the ASTM C423 standard is useful for evaluation of duct wrap, though. Covering a duct with fiber glass duct wrap improves thermal efficiency of the duct and adds sound absorption to the space to which it is exposed. This is particularly useful for selecting insulation in areas where reducing background noise may help enhance focus and communication.
Together, data from these tests can help engineers design building spaces that reduce employee exposure to high sound levels.
Conclusion
The Centers for Disease Control and Prevention estimates that 22 million workers in the United States are exposed to hazardous noise.7 Industrial noise can affect safety, comfort, and long-term costs for any facility. Addressing noise early in the building process using sound absorption, transmission loss, and insertion loss measurement data can drive better noise control outcomes. Outsourcing this expertise is often a smart move. Bringing in the right help at the right time can make all the difference.
References
- OSHA.gov
- NIH.gov
- OSHA.gov
- Herreman, “Acoustic Measurements of Duct and Duct Liner Materials,” Proceedings Inter-Noise 2018, Chicago, IL, August 26–29, 2018
- Richard Pamley, “A Discussion of Changes to ISO15665:2023-12 Acoustics—Acoustic Insulation for Pipes, Valves, and Flanges,” Insulation Outlook, March 2025 www.insulation.org/io/articles/a-discussion-of-changes-to-iso156652023-12-acoustics-acoustic-insulation-for-pipes-valves-and-flanges)
- Herreman
- CDC.gov