Florida Citrus Processing Facility Takes Leadership Role in Conducting a Facility-Wide Insulation Energy Assessment
After attending a National Insulation Association (NIA) presentation on “Insulation: The Forgotten Technology” at the American Society of Mechanical Engineers’ (ASME’s) 2007 Annual Citrus Conference, staff at a major citrus processing facility in central Florida decided to examine the insulation systems and determine the potential energy savings from replacing or repairing the existing insulation.
Facility management had previously examined abbreviated energy assessments for above- and below-ambient systems but had not commissioned an extensive below-ambient assessment. Due to the age, complexity, and recent weather history (i.e., hurricanes) of the facility, management wanted to examine the thermal insulation systems and any effect their conditions might have on the refrigerant piping and overall system operating costs.
The facility covers about 50 acres and consists of production, warehousing, and shipping/receiving facilities. It is estimated that the facility processes roughly 1 billion pounds of oranges and grapefruits each year into juice and juice products. Refrigeration is provided by a large, complex ammonia refrigeration system. Installed capacity is roughly 3,000 tons of refrigeration, with an estimated energy cost of $2 million per year.
The scope of the assessment was limited to the below-ambient piping and equipment. The size and complexity of the refrigeration system in this facility limited the assessment to an “overview” level.
The approach to the insulation system energy assessment involved the following tasks:
- Discussions with facility personnel about the refrigeration systems and processes served
- Walk-through of the facility
- Review of the historical insulation standard for refrigerant piping
- Economic analysis of the piping and vessels
The Refrigeration System
The ammonia refrigeration system is large and complex, with numerous interconnected equipment rooms. Satellite equipment rooms send high-stage discharge gas to condensers at a central, large equipment room with multiple large evaporative condensers. The liquid ammonia for satisfying cooling loads is supplied from this large, central equipment room’s high-pressure receivers. Miles of insulated pipe run from loads to equipment rooms, with blast freezer suction, freezer suction, low-medium temperature suction, and high-medium temperature suction.
The low-temperature loads (air units, freezing tunnels, etc.) receive recirculated, low-temperature ammonia from a low-temperature recirculator. The vapor produced as a result of heat removal from loads is suctioned to either rotary vane boosters or screw boosters. The booster discharge is then pumped into an intercooler ammonia liquid bath, where the superheat is removed and the flash gas created with the booster discharge gas is suctioned to the high-stage compressors, which are either reciprocating compressors or high-stage screws. The high-stage compressors discharge to a large bank of elevated evaporative condensers.
Insulated suction lines vary in size from 4 to 12 inches, with temperature variations from -45°F to 23°F. Liquid ammonia lines are generally 1 ½ to 2 inches. All ammonia lines and vessels are steel. A number of stainless steel “juice” lines, generally 3 or 4 inches, are used throughout the site to transport finished product.
Piping and large vessels are generally outdoors and subject to weather. Some piping and equipment is in the various engine rooms throughout the site. These engine rooms are ventilated but unconditioned, and temperatures in these rooms are, on average, higher than outdoor air temperatures. A relatively small amount of piping is inside coolers and freezers.
Condition of Existing Insulation Systems
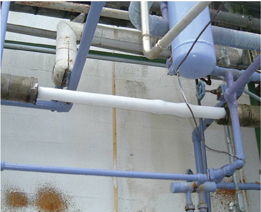
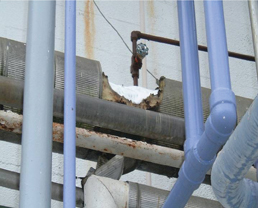
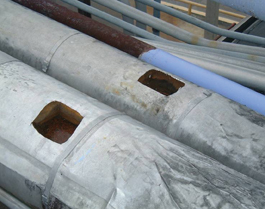
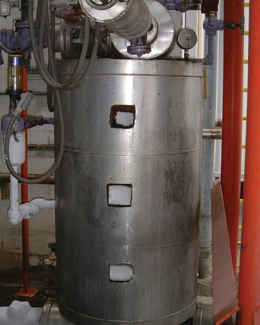
Based on visual inspection, it was estimated that 70 percent of the existing insulation system is in some stage of failure. The newer insulation systems (installed in the last 3 to 5 years) appear to be performing satisfactorily, while the older insulation systems (5 to 25-plus years in age) have failed for multiple reasons.
The failed insulation systems are problematic for a number of reasons, including the following:
- Corrosion of the substrate under the insulation could result in an ammonia release.
- The increased weight of the wet insulation and/or ice could cause the piping or equipment to exceed the structural design of their support systems.
- Continual dripping of water from the insulation and/or melting of the ice on the insulation system could create a personnel safety concern.
- The wet insulation has contributed to the development of mold.
- The failed insulation systems have resulted in increased energy consumption and greenhouse gas emissions.
- The reduced efficiency of the insulation system is not allowing the refrigeration and other equipment to function as designed, resulting in decreased plant productivity and/or increased cost of production.
- The failed insulation systems are increasing annual operating cost and life-cycle costs.
Why Has the Insulation System Failed?
Pinpointing the exact cause by location and approximate time a failure occurred is difficult, especially since even the slightest area of damage can easily lead to more extensive damage over a broader area. The following list does not rank items in order of importance; a combination of these occurrences has led to current conditions.
Non-destructive testing: Anytime an insulation system is penetrated, the integrity of the overall system is compromised, especially on services below ambient temperatures. The problem is compounded when the area penetrated is not properly repaired in a timely fashion. All areas tested showed extensive failure of the insulation system.
Weather damage: Damage created by weather (hail and wind) was noted in some areas.
Insulation system design: Old specifications were not available for review. However, areas were noted where the insulation thickness was not adequate, vapor barriers were not installed, an outer jacket was not installed, penetrations were not properly addressed and sealed, and outer jacket lap areas were not correctly located. Was the insulation design the problem, or was it improper application? The answer is probably that both contributed to the problem.
During the inspection process, the use of multiple insulation systems was noted. Given the diverse reasons for and the magnitude of the insulation system failures, it is impossible to point to a given insulation system as the problem.
Lack of maintenance: The importance of maintenance is dramatically increased on insulation systems operating below ambient temperature and exposed to weather. A proper and aggressive insulation system maintenance program would have substantially reduced the extent and severity of the problem at a net lower cost over time.
Economic Analysis
The economic analysis of the insulation systems comprised five tasks:
- Identifying the appropriate operating and ambient conditions for the analysis
- Estimating the cost to remove unwanted heat gains
- Estimating the heat gains through the existing insulation systems
- Determining the appropriate levels for insulation upgrades
- Estimating the savings attainable by upgrading to recommended levels
For purposes of analysis, the refrigeration system piping and vessels fell into one of the following three categories:
| Low Temperature | 9 in. Hg Vac. | -40°F |
|---|---|---|
| Low-Medium Temperature | 20 psig | 5°F |
| High-Medium Temperature | 35 psig | 22°F |
In addition, the stainless steel juice lines were assumed to operate at a temperature of 34°F.
While there are certainly variations from these levels based on special cases and normal process variation, these three levels were chosen to describe the operating temperatures found in the system. For outdoor conditions, annual energy calculations on the average annual temperature as reported in the National Climatic Data Center CLIM20 Report were used.
Temperatures in the ventilated engine rooms vary but, on average, are somewhat higher than the outdoor air due to the heat release from equipment. It was estimated an average 5°F differential for an average annual indoor temperature of 77°F with a wind speed of 1 mile per hour (mph).
Freezers are maintained at an average temperature of -5°F or 20°F (depending on the service), and coolers were assumed to be 35°F. Average wind speed of 1 mph was assumed for these indoor applications.
Cost of Removing Unwanted Heat Gains
A key part of an insulation energy appraisal is determining the cost of unwanted heat gains. This involves determining not only the cost of the electricity, but also how efficiently that electrical energy is used. For a refrigeration system, the utilization efficiency is expressed as the coefficient of performance (COP), the benefit of the cycle (amount of heat removed) divided by the required energy input to operate the cycle. The key variables for this complex system were the high-side (condensing) and low-side (evaporating) temperatures of the system.
High-side (condensing) temperatures are determined by the ambient weather conditions and condenser design. The facility uses evaporative condensers. The condensing temperature varies between 80°F and 100°F. For purposes of this analysis, an annual average of 90°F was assumed. (This translates to a condensing pressure of 165 psig.) Low-side (evaporating) temperatures are 40°F (Low Temp), 5°F (Low-Medium Temp), or 22°F (High-Medium Temp).
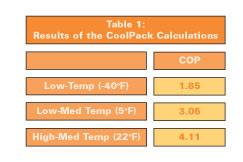
COP estimates were calculated for each of the three suction levels using a public domain refrigeration analysis package (CoolPack). For purposes of this calculation, it was assumed that the low-temperature loads use a two-stage system with flash intercooler, while the medium-temperature loads use single-stage systems. The CoolPack software uses a number of default assumptions (e.g., compressor efficiency, pressure drops in piping, liquid overfeed ratios, degree of subcooling of condensed liquid), so the results should be viewed as estimates based on similar systems. Results of the CoolPack calculations are in Figure 6.
Note that the estimate of the COP for the low-temperature system is roughly half the COP of the medium-temperature systems. Also, note that the temperature difference (ambient-operating) for the low-temperature systems will be roughly twice that of the medium-temperature systems. Therefore, the economic value of insulation on the low-temperature piping and vessels should be roughly four times that for the medium-temperature systems.
The facility purchases most of its electrical power from a local utility company and takes advantage of the time-of-day rates by shutting down some of the refrigeration equipment during peak periods and restarting during off-peak periods. For confidentiality reasons, the actual energy cost is not discussed in this article, but it is safe to assume the net cost is considerably lower than market rates. Thus, all savings estimated in the assessment would be substantially higher if market rates were applied.
Estimating Heat Gains
Estimating heat gains through the existing insulation system cannot be done with precision. It is possible, however, to make educated guesses about the condition of the existing insulation system and to estimate the overall performance of the system. These estimates can then be compared to estimates of the performance of upgraded systems.
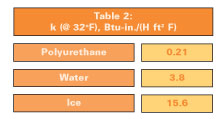
It is estimated that 70 percent of the existing system at the facility is in some stage of failure. Specifications and literature on the older insulation systems were not available, so it was assumed that the 30-percent undamaged portion of the system is performing at a level of 90 percent of the thermal resistance of commercially available polyisocyanurate insulation. (Note: Other insulation systems could also have been used for these calculations.) To estimate the performance of the 70-percent failed portions of the system, it is helpful to compare the thermal conductivity of the “de-rated” polyurethane insulation to liquid water and to ice.
If the existing insulation were completely saturated with water, the heat gain would be roughly 18 times (3.8 ÷ 0.21) the heat gain for a dry system. If it were completely saturated with ice, the heat gain would be roughly 74 times (15.6 ÷ 0.21) the heat gain for a dry system.
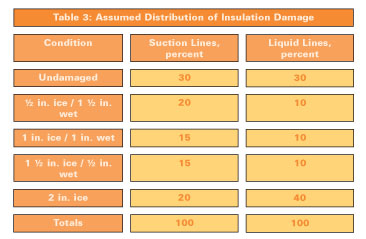
Considering that the operating temperatures of the piping and vessels are below freezing (with the exception of the juice lines), it is reasonable to assume that some portion of the liquid water will have frozen. Certainly, any missing or uninsulated portions will quickly become ice covered. Based on this reasoning, “weighted average” heat gains were developed based on the assumptions in Figure 8.
Juice lines are assumed to be 30 percent undamaged, 35 percent half wet, and 35 percent completely wet.
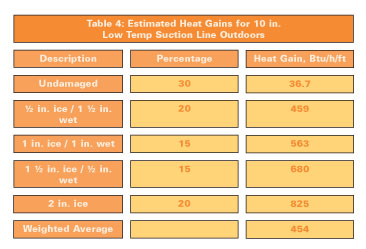
These assumptions were used, along with the 3E Plus® computer program developed by the North American Insulation Manufacturers Association (NAIMA), available at www.pipeinsulation.org, to develop estimates for heat gains for each of the operating temperatures, sizes, and locations throughout the facility. To illustrate, consider a 10-inch NPS (nominal pipe size) low-temperature suction line running outdoors (see Figure 9).
Based on this set of assumptions, it was estimated that a typical existing 10-inch NPS suction line outdoors will have, on average, a heat gain of 454 Btu/h/ft. This process was repeated for each of the line sizes, operating temperatures, and locations identified in the facility.
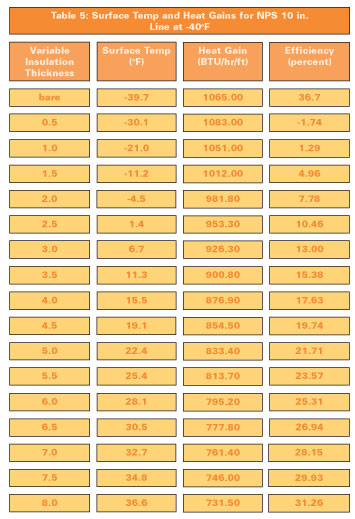
Note that the estimate assumes a 2-inch thickness of existing insulation with a weathered aluminum jacket throughout the site. Some lines, however, were uninsulated or had significant portions of insulation missing and significant buildup of ice. A logical question is whether the 2 inches of ice assumption is valid for the uninsulated portions of the lines. The 3E Plus software was used to explore this question by customizing the program to include ice as an insulating material. Results for a 10-inch NPS low-temperature (-40°F) outdoor suction line are summarized in Figure 10.
Focusing on the Surface Temperature column, note that at a thickness of 2 inches of ice, the predicted surface temperature is -4.5°F. In central Florida, the dew-point temperature rarely drops below 20°F. So at a thickness of 2 inches of ice, condensation on the outer surface would be expected, and this condensed water would also be expected to freeze, causing the ice layer to grow. Again referring to the Surface Temperature column, note that the surface temperature does not get above the freezing point of water until a thickness of 7 inches is reached. However, the 3E Plus calculation does not account for a number of factors in this situation, namely solar incidence, the latent heat of the condensing water, and the effects of gravity. In addition, outdoor temperatures and wind speeds will not be constant, so some melting will occur, limiting ice buildup to thicknesses less than the 7 inches suggested by the 3E Plus calculations.
Referring to the heat gain column in Figure 10, note that for a 7-inch-thick layer of ice, 3E Plus calculates a heat gain of 761 Btu/h/ft. For a 5-inch thickness, the heat gain is 833 Btu/h/ft. Referring to Figure 6, the estimated heat gain for 2 inches of insulation saturated with ice was 825 Btu/h/ft. Thus, it seems reasonable to use the 825 Btu/h/ft value to represent the heat gain for either the 2 inches frozen case or the uninsulated, ice-covered condition. This result is due to the fact that the heat gains are not very sensitive to the thickness of ice present—ice is a very poor insulator.
To explore this point further, compare the heat gain in Figure 10 for a ½-inch thickness of ice to that for a bare surface. The presence of ice on the surface is predicted to increase the heat gain to the pipe. The estimated heat gain for a bare pipe is 1,065 Btu/h/ft, while the heat gain for a pipe with ½ inch of ice buildup on the surface is 1,083 Btu/h/ft. This is an increase of 1.7 percent over the bare case, because the thin layer of ice adds very little thermal resistance to the system, yet the presence of the ice increases the radiant heat transfer to the outer surface. Ice has a very high emittance (0.97), so radiant heat transfer at the surface is increased over that for bare steel (0.8). The net result is an increase in heat gains for thin layers of ice.
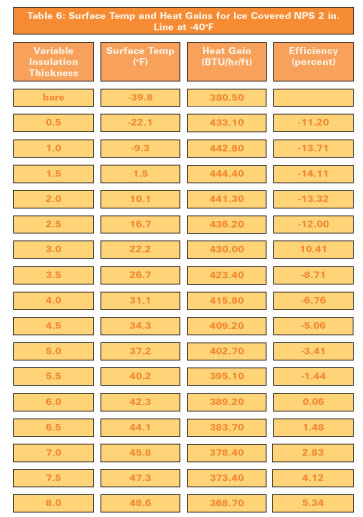
It is interesting to repeat the calculation for the smaller liquid line sizes. Consider the results shown in Figure 11 for a 2-inch NPS low-temperature liquid (-40°F) line exposed to outdoor conditions.
In this case, the heat gain increases from the bare case to a maximum at a thickness of about 1.5 inches and then decreases slowly with additional ice buildup. Note that a thickness over 4 inches would not be expected since the surface temperature would be above the melting point of ice. At 4 inches, the heat gain is roughly 7 percent higher than for a bare pipe.
This interesting result is due not only to the increase in the surface emittance of the ice-covered surface, but also due to a phenomenon known as the critical radius. Although the resistance to conduction increases with the additional thickness of ice, the surface resistance decreases due to increased outer surface area. The maximum heat flow occurs at a thickness corresponding to a critical radius. Further increases in thickness of the ice layer reduce the heat gain.
The bottom line relative to the insulation appraisal is that ice adds little resistance to heat transfer and, in some cases, may actually increase the heat gain to the refrigeration system.
Determining Appropriate Levels for Insulation Upgrades
Insulation on refrigerant piping serves multiple design objectives, including the following:
- Process control
- Condensation control
- Energy conservation (cost and greenhouse gas emissions savings)
For refrigerant piping systems, condensation control usually dictates the appropriate insulation thickness. Process control in refrigeration systems is important, particularly for liquid feed lines where excessive heat gains can result in flash gas and possible pump cavitation.
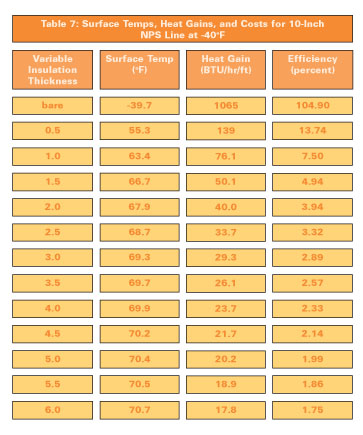
The low-temperature piping system will have both the highest heat gains (due to the high temperature differences between ambient and operating temperature) and the lowest COP. This “high-value” system was therefore selected for initial economic analysis. Results of 3E Plus calculations on low-temperature 10-inch NPS outdoor piping insulated with polystyrene insulation (other types of insulation could have been used for this calculation) with an aluminum jacket are summarized in Figure 12.
The results associated with the “bare” case should be disregarded. As discussed earlier, a bare steel surface at a temperature of nearly -40°F in central Florida would quickly be covered with several inches of ice, so this case is not very meaningful. The point is that a relatively small amount of insulation (½ inch) reduces the heat gain significantly and raises the surface temperature to about 55°F. The cost of removing that heat gain drops to $13.74/ft/yr. Adding thickness reduces heat gains and associated operating costs further, but at a decreasing rate. The problem becomes one of determining the optimum thickness from a life-cycle cost (LCC) basis. This optimum thickness (sometimes called the economic thickness) is the thickness that minimizes the total costs (initial installed cost plus operating costs) over the life of the insulation system.
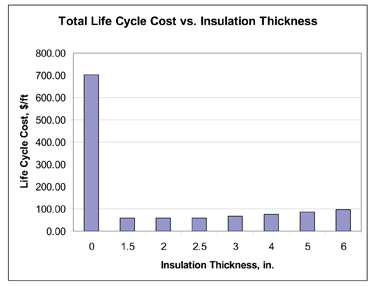
Determining the economic thickness is not easy since it depends on a number of factors that are unknown or unknowable. However, it is possible to make estimates based on a set of assumptions. An example calculation is summarized in Figure 14. For the purposes of this analysis, an economic life of 10 years and an annual discount rate (cost of money) of 8 percent was assumed. This set of economic assumptions translates into a multiplier (the Uniform Present Worth Factor, or UPWF) of 6.71 on the annual operating costs.
For the purposes of this analysis, installed costs were estimated using the FEA Method built into the 3E Plus program. Material cost factors of $6/ft for 2 x 2 pipe insulation and $2/ft2 for 2-inch board insulation were used, along with a labor rate of $60/hr. These cost estimates do not include an allowance for removal and disposal of existing insulation or the inspection, repair, and preparation of the substrate. Also note that these costs may vary based on a number of factors.
In this case, a thickness of 2 inches of insulation yields the lowest life-cycle cost of $58.77/ft/yr, so this is the economic thickness. Note that the estimated operating costs at a 2-inch thickness are $3.94/ft/yr. Increasing the thickness to 2 ½ inches is estimated to save an additional $0.62/ft/yr, or $4.16/ft over the life cycle. The installed cost of the additional ½ inch is estimated at $4.49/ft, so the additional ½-inch increment is not economically justified. However, the optimum is broad. Life-cycle costs do not vary more than 10 percent from 1 ½ to 3 inches. Also, simple payback (relative to the bare case) is less than a year for all the cases examined.
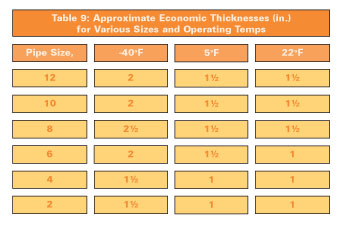
The process was repeated for other sizes and operating temperatures; results are shown in Figure 15.
The conclusion is that the economic thicknesses are lower than the condensation control thicknesses and, accordingly, condensation control will determine the appropriate levels for upgrades.
Selecting the insulation thickness based on condensation control does not mean that the system is somehow “uneconomic.” It simply means that the economic return is less than the maximum possible. Referring to Figure 14, note that the condensation control thickness is 6 inches, while the economic thickness is 2 inches. At 6 inches, the simple payback is 0.8 years (10 months) relative to the uninsulated case. At this thickness, the present value of the savings over the life of the investment is $692/ft. This compares to an initial installed cost of $87, so the net present value is $605/foot. This does not include the economic value of controlling condensation. If a dollar value could be assigned to this benefit, the net present value would be higher.
Estimating Savings From Upgrades
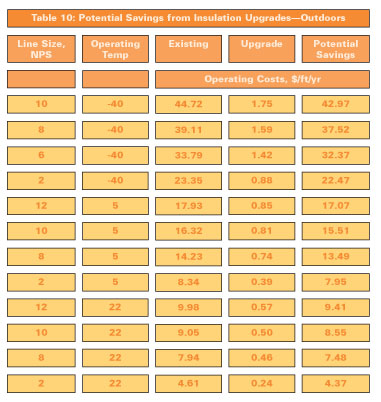
The final step in the assessment consists of calculating the expected performance of upgrades to the insulation system. As discussed above, the calculations assume upgrades to the thicknesses and materials recommended by the facility. The thermal conductivity curve appropriate for this insulation material was utilized in the 3E Plus program. Results on a per-foot basis for outdoor piping are summarized in Figure 16.
As expected, the greatest potential savings are for the low-temperature lines, due to the combined effects of greater temperature differences and the lower COP for these systems. Savings estimates for vessels range from $1.57/ft2/yr for the 22°F vessels to $8.50/ft2/yr for the low-temperature (-40°F) vessels outdoors.
These savings estimates depend strongly on the assumptions made about the performance of the existing insulation system. Recall that the existing performance was based on the “weighted average” of a mix of conditions. Savings for upgrading uninsulated lines will be greater than these values.
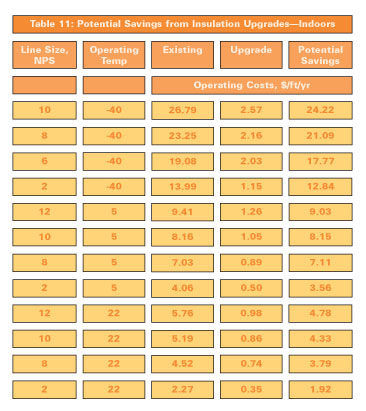
Estimates for the indoor lines are summarized in Figure 17. Savings from upgrading indoor lines are generally lower due to the lower heat gains expected for existing indoor lines and the lower insulation thicknesses assumed for upgrades.
Insulating lines and vessels inside coolers and freezers will not generally translate into energy savings since these heat gains are beneficial (removal of thermal energy from the cooler or freezer). However, insulation in these locations is important from a process control, safety, and housekeeping standpoint.
Based on rough estimates of the quantities of piping and vessels judged to need upgrading (approximately 10,000 linear feet), it was estimated that the potential aggregate annual savings are $110,000. The associated reduction of CO2 emissions is estimated to be about 1,010 metric tons per year.
The simple payback periods associated with upgrades will vary depending on the cost and the scope of the upgrades. Upgrading damaged or missing sections of low-temperature lines and vessels outdoors will pay back in 1 to 2 years. Payback periods for the medium-temperature surfaces will be longer. Payback periods for specific surfaces are summarized for piping in Figure 18.
The higher temperature surfaces have longer payback periods due to the combined effects of smaller temperature differences between the ambient and operating fluids, and the higher coefficient of performance associated with these lines. Also, these payback periods take into account the thermal benefit of the existing insulation system, including wet and frozen insulation. Payback periods for uninsulated lines or lines with missing insulation will be shorter.
The Bottom Line
Properly designing, installing, and maintaining any mechanical insulation system—especially systems operating below ambient conditions—can provide a significant return on investment beyond that of a simple payback calculation. Management at this citrus facility chose to examine its existing insulation systems, and the assessment results yielded a roadmap for continuous improvement.
The authors offer congratulations to the management at this facility on their foresight and extend our appreciation to them for allowing us to share their story. Does your facility have a similar story? If so, please e-mail editor@insulation.org.

