Montana Mechanical Insulation Energy Appraisal
In 2010, a mechanical insulation energy appraisal was conducted on a variety of State of Montana facilities in and around Helena. The objective of the Montana Mechanical Insulation Assessment Pilot Program was to determine the energy, cost, and emission reduction opportunities available via the repair, replacement, and/or maintenance of mechanical insulation systems in Montana’s state facilities. The assessment addressed mechanical rooms in 25 facilities pre-selected by State of Montana personnel based on the potential for energy savings.
The Pilot Program was part of the data gathering objective of the Mechanical Insulation Education and Awareness Campaign (MIC). In May 2009, the National Insulation Association (NIA) and the International Association of Heat and Frost Insulators and Allied Workers (International) created an alliance to educate industry on and promote the benefits of mechanical insulation. The MIC, one of the major initiatives of the alliance, is being executed under the U.S. Department of Energy’s Industrial Technologies Program. Project Performance Corporation (PPC) and NIA, in conjunction with its alliance with the International, are working together to design, implement, and execute the MIC.
The MIC’s goal is to increase awareness of the energy efficiency, emission reduction, economic stimulus, and other benefits of mechanical insulation in the industrial and commercial markets. The potential of mechanical insulation to play a significant role in reducing energy intensity is immense; however, the lack of sufficient data to support its energy efficiency potential, combined with a deficient understanding of what mechanical insulation is and how it can be utilized, impedes policy makers and actors in industrial and commercial sectors in making a supportable case for increased use and maintenance of mechanical insulation.
Approach
The overall approach for this Pilot Program was to assemble a team of insulation professionals to conduct a mechanical insulation appraisal of State of Montana facilities in the Helena area. The assessment team, with assistance from State of Montana personnel, performed the following tasks:
- Identified opportunities to improve insulation in the mechanical rooms visited
- Estimated costs to improve or upgrade the insulation systems
- Estimated the savings (in dekatherms, dollars, and CO2 emissions) associated with the insulation upgrades, and calculated the resulting payback period and return on investment.
The list of candidate buildings in the Helena area was developed and prioritized by State of Montana personnel based on the potential for energy savings from mechanical insulation. Buildings with steam and/or hydronic heating systems were therefore included, while buildings with forced air furnaces were excluded. The 25 facilities visited included a variety of building types (office buildings, assembly facilities, dormitories, maintenance facilities, and museums) and represented roughly 1.3 million square feet.
The scope of this study was limited to the assessment of the mechanical insulation on piping and equipment in the mechanical rooms of the selected facilities. Opportunities for repair and replacement of insulation on piping and ductwork within the building proper were not considered. This effort should not be considered an energy audit of the buildings visited. Energy conservation opportunities related to building envelope insulation or sealing, lighting, controls, ventilation, and equipment maintenance were also considered outside the scope of this study.
For each mechanical room, an insulation summary that identified items where insulation was missing or had sustained significant damage was developed. The team also identified the thicknesses that would bring the insulation level up to the level of the existing insulation. No attempt was made to “optimize” the level of insulation or to identify whether the existing insulation levels would meet or exceed levels required by local building codes or other requirements. Also, no assessment was made of the efficiency of existing insulation. Additional savings may be possible by upgrading the existing insulation level, but these savings would be small compared to insulating the uninsulated or damaged items identified in the appraisal.
During the field visits, additional information was collected about the energy systems in each mechanical room to enable the estimation of energy savings, including: the location of the mechanical room within the building, operating temperatures, estimated hours of operation, estimated efficiency of the equipment, and general control strategies. Budget-type cost estimates were also developed based on the summary information on a by-facility basis.
Assessment Results
Each of the facilities chosen for analysis had at least a few items that needed insulation. The smallest number of individual items identified in a building was 14 (1 12-ft length of 2-in. copper tube; 1 3-ft length of ¾-in. copper tube; 6 2-in. 90s; 5 2-in. ball valves; and 1 ¾-in. ball valve). The largest concentration of items was in the Boiler Plant that provides central steam and domestic hot water to four buildings in the Capitol Complex. Approximately 400 individual items were identified in this facility (including the tunnels), and savings due to insulation provided an estimated payback of 4.0 years.
Overall, approximately 3,500 items were identified. Estimated total savings were approximately 6 billion Btus per year, with an estimated payback of 4.1 years and an annualized rate of return of 24 percent. These projected savings are primarily savings in natural gas usage and represent roughly 8 percent of the total natural gas consumption of the facilities analyzed.
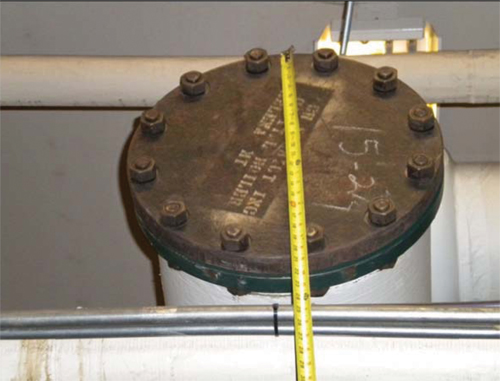
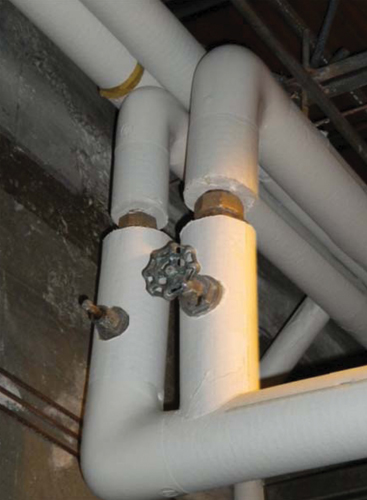
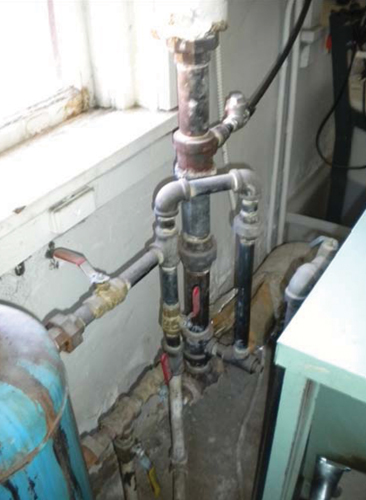
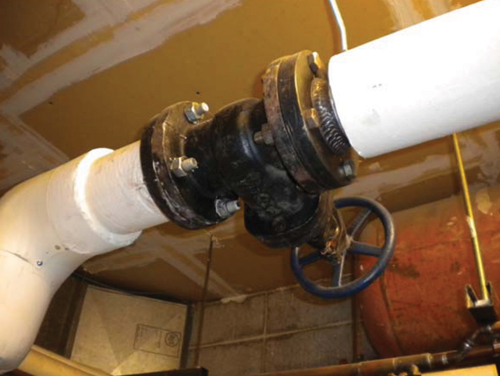
As expected, some of the items identified were large (for example, the uninsulated flanged end cap on a large, low-pressure steam header shown in Figure 1). The majority, however, were relatively small (like the uninsulated unions and valve bonnets on the hot water heating lines shown in Figure 2). While the savings from any single item is small, the aggregated total savings from thousands of small items is significant.
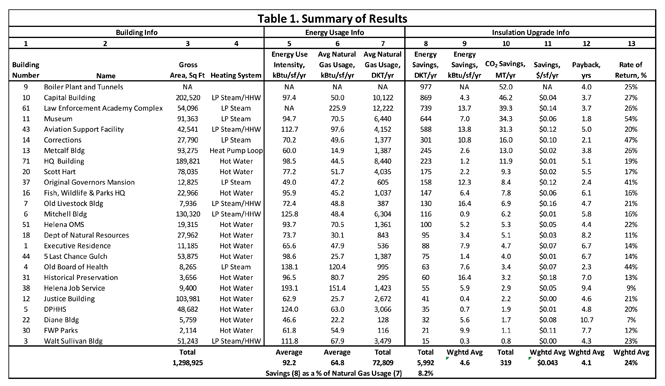
Figure 2 summarizes the overall results of the appraisal, sorted in order of decreasing energy savings. Building energy usage information (columns 5-7) was derived from data provided by State of Montana personnel and, in most cases, is the average usage over a 4-year period (FY 2007–FY 2010).1
Energy Use Intensity2 (EUI, column 5) is the annual building site energy consumption (electrical and natural gas) per square foot of gross building area. Units are kBtu/sf/yr. Available EUIs3 for the Helena buildings range from a high of 193 to a low of 47. The unweighted average EUI for the Helena buildings is roughly 92 kBtu/sf/yr. For reference, the U.S. Energy Information Agency’s Commercial Building Energy Consumption Survey4 for this climate zone lists average EUI values for offices at 92 and assembly buildings at 102.
Average natural gas usage is given on an absolute basis in column 7. Note that no natural gas usage is shown for Building 9, the Boiler Plant. Natural gas-fired boilers in the Boiler Plant generate low pressure (5 psig) steam for distribution to four other buildings. Natural gas usage in the Boiler Plant has been allocated to those buildings.
Estimated energy savings due to identified insulation opportunities are given in column 8. Column 9 gives those energy savings normalized to building area. A number of key assumptions were required to develop the energy savings estimates, including the operating hours of the mechanical systems involved (heating systems are assumed to operate for 8 months during the winter or 5,840 hours per year). Additional assumptions include the operating temperatures and the ambient conditions inside the mechanical rooms (assumed to be 80°F with 1 mph wind speed).
The total estimated savings are approximately 6 billion Btu/yr. The weighted average savings are 4.6 kBtu/sf/yr. This represents 8.2 percent of the natural gas usage in the facilities studied. Note that in most cases, the insulation opportunities identified will reduce natural gas consumption. However, a few of the buildings have electrically heated domestic hot water systems, so in those buildings, a small portion of the energy savings due to mechanical insulation will show up as electrical energy savings. These electrical energy savings have been expressed as dekatherms and included in the estimates in columns 8 and 9.
The savings estimates in column 8 are converted to the associated reductions in CO2 emissions in column 10 (metric tonnes per year) and to financial savings ($/sf/yr) in column 11.
Insulation cost estimates were prepared on a by-facility basis using the summaries developed during the site visits. The estimates assume a variety of insulation systems depending on the application. The primary insulation system used in the estimates was fiberglass pipe insulation with all service jacket and removable/replaceable flexible insulation covers.
Column 12 shows the estimated payback period of the insulation project in years, while column 13 gives the annualized rate of return (assuming a 20-year life and no fuel cost escalation5). The estimated payback periods range from 1.8 years to 10.7 years. Corresponding annualized returns range from around 54 to 7 percent.
As might be expected, the steam-heated facilities generally show shorter payback periods. Steam supply piping operates at roughly 230°F during the heating season, while hot water supply temperatures are normally reset in a range from 120°F to 180°F based on outdoor temperatures. Insulating steam systems will therefore exhibit not only greater energy savings but also faster payback periods.
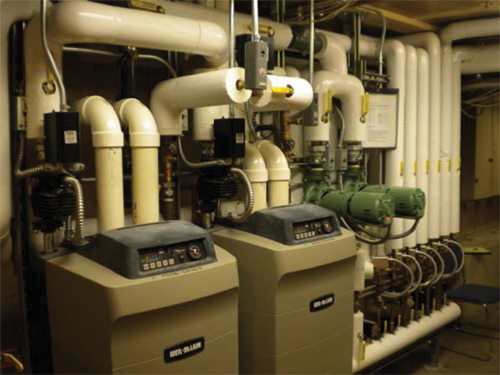
The variation in financial returns is not unexpected. All the buildings inspected had mechanical insulation on their steam and hot water lines, although some systems were in better shape than others. Several had been recently upgraded to high-efficiency condensing boilers with well-insulated piping (Figure 4). While several small items were identified in each of these facilities, the “low-hanging fruit” had been gathered.
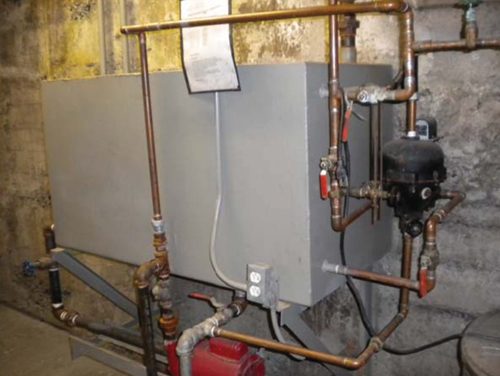
On the other end of the spectrum, several buildings have insulation opportunities that will yield more immediate returns (see Figures 5 through 7).
Results
The results of this study demonstrate that there are numerous opportunities for improving the mechanical insulation application in steam and hydronic heated buildings in Montana. One question prompted by the appraisal is, “Why are there so many pieces of missing insulation?” In many locations, it was obvious that some maintenance task had required removal of the insulation, which was simply not replaced after the maintenance was completed. This was observed in several locations where a domestic hot water (DHW) storage tank had been removed and replaced with a newer tank, and piping connections to the tank were left uninsulated. It is likely that the personnel performing this work did not have either the materials or the proper training to complete the job.
In some areas, either mechanical damage or leaks had occurred and the damaged insulation had not been replaced. More common, however, were items that had never been insulated. For buildings and systems designed and built when energy was cheap, the “extent of insulation” was not nearly as complete as it is today. Items like pipe unions, strainers, steam traps, condensate tanks, expansion joints, valves, flanged joints, pumps, and tanks were routinely left uninsulated.
The DHW systems in the buildings visited illustrated the interactions often present in energy conservation projects. A number of the buildings contained newer high-efficiency DHW storage tanks. Some buildings, however, used older conventional-style gas-fired water heaters. For the older DHW tanks, we analyzed the addition of a 1½-in.-thick tank blanket to minimize heat loss. These DHW tanks typically operate year round (8,760 hours per year). For a typical 24 in. diameter by 60 in. tall tank, energy savings can be on the order of $30 per year. These savings were included in the analysis where applicable. Depending on the age of the DHW tank, it may be more reasonable to consider replacing these tanks with high-efficiency units. This alternative (and mutually exclusive) option was not investigated in this study.
A related interaction issue concerns the DHW circulating systems. Most of the buildings in the study use circulating pumps in the DHW loops. These pumps minimize city water consumption since occupants have hot water at fixtures on demand (rather than having to wait for hot water). Some of the facilities have been fitted with timers to limit the hours of operation of the circulating pumps (and the associated heat loss from DHW piping) to occupied hours. In other buildings, the circulating pumps run continuously. For these buildings, the insulation replacement items look very attractive (since savings are directly proportional to operating hours). The alternative option of installing a timer to limit hours of operation would reduce the savings from insulation. The two options, however, are not mutually exclusive, and installation of timers should be considered in addition to replacing any missing insulation in the DHW loop.
Extrapolating the Results Statewide
One of the Pilot Program’s objectives was to use the results to estimate the savings possible if the program were expanded to cover all the similar state-owned buildings in Montana. The State of Montana has a statewide inventory of approximately 2,000 buildings of all types, such as roadside rest facilities, historical village gift shops, prisons, and university football stadiums. Many of these facilities are small, seasonal, and with specialized usage and/or limited occupancy. The results of this study will obviously not apply to many of these facilities, so extrapolation to all state buildings in Montana is not meaningful. Projections to similar state-owned facilities are possible and may be useful.
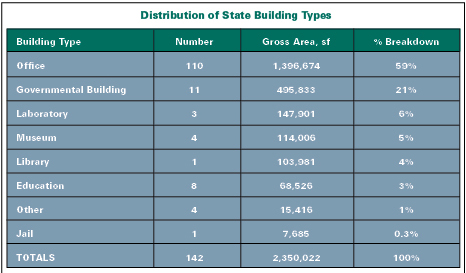
The initial step toward that objective was to review a list of state buildings provided by State of Montana personnel. The facilities on the list were considered potential candidates for inclusion in mechanical insulation upgrade projects. The information provided included building designation and location, year built, occupancy code, gross area (in square feet), number of stories, and number of full-time employees. The list contained a total of 142 buildings with a total gross area of 2.35 million square feet. The distribution of those 142 buildings by type is shown in Figure 8.
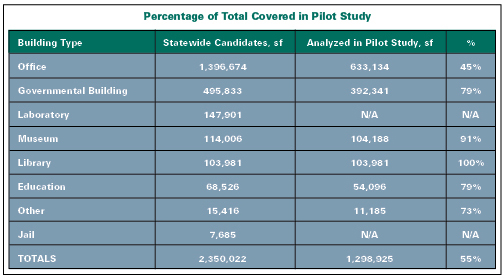
The pilot study of Helena buildings covered several of the larger state buildings on the list, representing a significant percentage of the total. Overall, approximately 55 percent of the square footage identified on the candidate list was included in the study. Figure 9 breaks this percentage down based on building type. As a first-order estimate, the energy savings from the Helena study can be prorated based on building area. Annual energy savings from the 25 facilities analyzed in Helena averaged about 4.6 kBtu/sf/yr, about $0.043/sf/yr. If these savings were prorated to the statewide candidate list (2.35 million square feet), they would total 10,800 DKT/yr, or $101,000/yr.
Additional analysis could refine this estimate. We know, for example, that steam-heated and hydronic heating systems will have more opportunities for mechanical insulation than forced-air heating systems. In addition, we know that some of the candidate buildings have already been addressed. More information about the building inventory statewide would allow a more precise estimate, but an order-of-magnitude savings of 10 billion Btus (8 percent savings per year) statewide is not unreasonable. We would expect installation costs to be similar, so annualized returns of 24 percent could be achieved.
Little Things Matter
Approximately 3,500 items were identified in 25 buildings (56 mechanical rooms) in the Pilot Program, with estimated energy savings of approximately 6 billion Btu per year, a resulting overall payback period of 4.1 years, and an annualized rate of return of 24 percent. Associated reductions in CO2 emissions are estimated at 300 metric tonnes per year. On a square foot of gross building area basis, the energy savings averaged 4.6 kBtu/sf/yr, while energy cost savings averaged $0.043/sf. Similar results, 8 percent savings of natural gas consumption, could reasonably be expected in similar Montana facilities.
While the savings from any single item is small, the aggregated total savings from thousands of small items is significant. The appraisal results confirm the value of addressing missing, damaged, or uninsulated areas. The payback period and internal rate of return are based on actual operating conditions, 80°F ambient temperature, service temperature, and hours of operation (in many cases, less than 6 months per year).
The results tell an impressive story for the maintenance of mechanical insulation in commercial building applications. The findings confirm the energy savings, emission reduction, and financial benefits of looking at mechanical insulation differently. What is the energy-saving potential in your facility?
Notes
1. Annual Heating Degree Days over this 4-year period averaged 7,751, or about 0.9 percent higher than the long-term average for Helena.
2. For site EUI calculations, 1 kWh of electrical energy is 3,412 Btu and 1 dekatherm is 1,000,000 Btu.
3. Electrical consumption at the Montana Law Enforcement Academy Complex is billed from a master meter, so EUI could not be broken out for the portion of that campus analyzed.
4. U.S. EIA, 2003 Commercial Building Energy Consumption Survey (average for climate zones with HDD>7,000).
5. Energy costs are volatile and notoriously difficult to predict. While long-term energy costs are expected to increase, recent natural gas costs have been falling. A fuel cost escalation rate of 0 percent seems reasonable for this analysis. If a 3 percent annual fuel cost escalation rate was assumed, annualized returns would increase by about 3 percent. For example, the 27 percent return estimated for the Capitol Building would increase to 30 percent if a 3 percent/yr fuel cost escalation rate was used.

