Category Archives: Global

Below-ambient systems create unique environments that have the potential for a multitude of issues, one of which is mold growth. Mold growth can occur either on or in
mechanical insulation on
pipes and tanks if the right conditions are present. When mold grows inside duct work, it can be a very significant issue, and cause for concern. The conditions in ducts
can be conducive for mold growth and the potential for health issues is high, particularly in schools, public buildings, and health-care facilities. Selecting the correct
insulation type and installing it
properly according to industry specifications and the manufacturer’s instructions can significantly decrease the probability of mold becoming an issue.

The Risks of Mold Growth

In the past 15 years, the concern over mold has increased in large part due to lawsuits. Many observers wondered if mold would become the next big industry issue and be
the subject of an
increasing number of lawsuits and other litigation. It is important to remain vigilant about the risks of mold growth. When mold problems arise in the field, the issues
relating to them generally
become the responsibility of the Design Engineer or the Installation Contractor. Correcting a mold problem can cost thousands, if not millions, of dollars. When mold is
found in the walls of a
multi-story condo complex because the insulation on the cold water lines did not perform properly, the cost to repair the damage can be particularly high. If mold is found
in the duct system of a
new elementary school, the cost of remediation can also be very high, but can reduce health risks to the occupants. These real world examples should make every Design
Engineer,
Mechanical Contractor, and Insulation Contractor take the issue of mold very seriously.

Environmental Elements Needed for Mold Growth

To eliminate mold, it is crucial to understand the key environmental elements required for it to form. For mold to form and thrive, 3 conditions must be present: an
environment with an
air temperature within a range typically found in building interiors, the presence of a food source, and the presence of either sustained high humidity or water. The best
way to
attack mold is to eliminate 1 or more of the 3 conditions necessary for its growth. Elimination of the air temperature conditions is usually not an option. Eliminating the
food source can
be difficult, but should be considered. The food source does not have to be the insulation itself, which is often blamed. Rather, it can be the dirt or dust attached to the
insulation, which
is almost always present. One option for reducing the propensity of the insulation to attract or capture dirt or dust is to use a jacket or select an insulation material
that resists dirt
accumulation. However, use of a jacket in a duct liner application is usually not a viable option, so it can be difficult to completely eliminate the dust or dirt that
serves as a food
source in those applications. Another option is the installation of UV lights inside ducts to eliminate mold—though this merely treats the mold rather than
eliminating the source.

Reducing Moisture to Prevent Mold Growth

The most common and tenable option for eliminating mold growth is to reduce moisture. Moisture can exist as either high humidity conditions or as water. Systems that
operate at below-ambient
temperatures have the potential for surface condensation, making them susceptible to mold growth. The use of biocides can be used as a secondary deterrent, but eliminating
the moisture
required for mold growth is the best option. There are several steps that can be taken to eliminate the presence of moisture, which can prevent mold from becoming an issue.
Three key steps are
1) specifying an adequate insulation thickness to prevent surface condensation; 2) selecting insulation materials that do not provide a food source for mold; and 3)
installing the
insulation correctly and maintaining the insulation system.

Step 1: Specifying Proper Insulation Thickness

In a below-ambient system, the first step in preventing mold is specifying a thickness of insulation that will prevent surface condensation most of the time. When
determining this, it is
important to remember that codes or other minimal specified levels of insulation—even for below-ambient lines—are generally developed for thermal efficiency,
not condensation control.
Preventing surface condensation sometimes requires greater thicknesses than those specified just for energy conservation (i.e., usually based on an economic thickness). To
determine design
conditions for unconditioned spaces (i.e., those spaces that are not continuously controlled for air temperature and percent relative humidity), it is recommended that the
designer follows the guidelines given in industry resources such as the ASHRAE 2013 Handbook of Fundamentals, Chapter 23, and the Mechanical Insulation Design Guide.

Step 2: Selecting Mold-Resistant Insulation

Unfortunately, surface condensation cannot be totally eliminated from ever occurring for most systems. Some condensation will probably occur in the rare situations when
the environmental
conditions exceed the design conditions for which the insulation thickness was specified, particularly in unconditioned spaces. Selecting a jacket for the insulation and
specifying an insulation
that inherently resists moisture penetration will reduce the probability of condensation. Using a jacket that incorporates a metal foil in its construction, does not have
exposed
paper on its outer surface, and is sealed tightly at the joints is a good first step.

Selecting an insulation that is resistant to mold growth is the second step in preventing mold and reducing the issues casual condensation creates. Insulations with a
closed-cell structure—such as elastomeric, polyethylene, polystyrene, or cellular glass—are resistant to moisture penetration and have a history of resisting
moisture without the need for an additional jacket. Other insulation materials work well with the proper design, vapor barriers, or jacketing. The best insulation to use in
a specific application (i.e. cold water, chilled
water, refrigeration, duct liner, etc.) depends on the temperature, configuration/shape, and specific requirements of the application. Some insulation materials have a
biocide incorporated in them for added mold resistance. The biocide should be approved by the U.S. Environmental Protection Agency (EPA) for use in ducts (air stream).

There are several test methods used to determine if an insulation or jacket material is “mold resistant.” In all cases, the test methods use clean, dry insulation or
jacket samples, which is
usually not comparable to real world conditions where dirt/dust is nearly always present as a food source. An insulation material’s testing and certification that it is
“mold resistant,” even when tested in accordance with a specific ASTM mold-resistant method, does not guarantee a mold-free installation if other factors are ignored. These
various tests and mold-resistant certifications may be useful, however, when comparing different insulation materials—while insulation cannot be guaranteed to be mold
free, some materials may fare better than others. When comparing
insulation materials, the same exact test method should be used for the basis of comparison. There are several third-party laboratories that certify products as being mold
resistant and are often
cited on insulation material product data sheets.

Step 3: Properly Installing and Maintaining the Insulation

Installing the insulation and establishing a proper maintenance plan is the third step in preventing mold in a below-ambient system. The insulation materials being
installed should be dry,
and should have never been exposed to water. The building should be enclosed (i.e., not exposed to the elements), which limits the potential for the insulation being
exposed to water once
it is installed. In addition, when installing insulation on an HVAC system, the system should not be running and the piping and ducts should be dry. While installing the
insulation, it is
mandatory for the installer to maintain the integrity of the insulation system for proper performance. Sealing all seams (butt, longitudinal, and termination points) is
mandatory for
below-ambient applications. Some insulation materials, such as flexible elastomeric and polyolefin, may use a contact adhesive rather than a tape to seal the seams. If the
insulation
becomes damaged (tears, holes, cuts, etc.), it must be repaired in a timely manner. Damaged insulation can lead to the degradation of the insulation on the whole system. It
is ideal, and less
costly, to both design the application properly and install it according to the manufacturer’s instructions than it is to make the repairs after it is installed.

Following the aforementioned steps and making everyone working on the project aware of mold as a potential problem can often prevent it from occurring. The key to
preventing mold
growth is simple: keep it clean and dry. Effective condensation control to eliminate the presence of water is not a matter of chance, compromise, or cost minimization. From
the beginning of the
project, it requires clear communication among all parties involved and clear instructions on what is expected of them. While some condensation may occur when environmental
conditions exceed the
design conditions for which the insulation is specified, it is possible—with proper planning, materials, and maintenance—to materially lessen the chance of
condensation and the
conditions that may lead to mold growth.

Although there is no specific legal standard for addressing hot-work environments, the Occupational Safety and Health Administration (OSHA) is currently focusing its efforts on the prevention of heat-related illnesses. OSHA has launched its annual Campaign to Prevent Heat Illness in Outdoor Workers, and is focusing many of their efforts on ensuring employers are addressing the threat of heat illness. A recent Washington memo to OSHA’s Regional Administrators emphasized the importance of this issue, and stated that “this memo directs the Field to expedite heat-related inspections and to issue Citations . . . as soon as possible.” Employers should take action now to ensure their workplaces are free of heat hazards, or they could potentially face costly citations and litigation.

Working in a hot environment puts stress on a body’s cooling system; too much heat can result in dehydration, cramps, heat exhaustion, or even a fatal heat stroke. The risk of heat stress depends upon many factors—some of which relate to individual employees—and
can make it difficult to establish safe working processes. These risk factors include the employee’s physical condition, the temperature and humidity, clothing worn, the pace of work and how strenuous it may be, exposure to sun, and environmental conditions such as air movement.

OSHA is utilizing its General Duty Clause, Section 5(a)(1), in an attempt to make new standards that will further regulate employers’ activities when they have projects in hot environments. A violation of the General Duty Clause may exist when workers have been working in a hot environment and the employer is aware of the heat-related dangers, but has not taken adequate protective action for the workers—such as water, rest, and shade. However, OSHA expects that employers will take steps beyond these basic measures to ensure worker safety, which is why employers must plan for additional safety measures. To be compliant with OSHA’s expectations for heat-illness prevention, employers should implement an acclimatization program for new employees, and also for those returning from extended time away, such as vacations or leaves of absence. OSHA also suggests that employers implement a work/rest schedule and provide a climate-controlled area for cool down. Temporary workers have a greater risk of experiencing heat-related illnesses, and
OSHA is urging greater care in adopting an acclimatization program for them. Simply telling your employees that it is a hot day and they should take breaks when they need to and drink as much water as necessary will not meet OSHA’s expectations, and could very easily result in a citation. OSHA believes that employers should actively encourage the consumption of at least 5 to 7 ounces of fluids every 15 to 20 minutes.

OSHA is also urging that each employer establish a heat-stress program, but by doing so, the employer is acknowledging heat stress as a hazard on their job site. Once a hazard is recognized and a safety program is established, an OSHA Compliance Officer may
investigate, and may potentially find an employer’s safety program inadequate. This is a dilemma for employers that is yet unresolved
by the courts.

A heat stress program can have many components, including, but not limited to:

Training

  • Hazards of heat stress
  • Responsibility to avoid heat
    stress
  • Recognition of danger
    signs/symptoms because employees may not
    recognize their own
  • First aid procedure
  • Effects of certain
    medications in hot environments

Personal Protective
Clothing/Equipment

  • Light-colored summer
    clothing allowing free movement and
    sweat evaporation
  • Loosely worn reflective
    clothing to deflect heat
  • Cooling vest and wetted
    clothing for special circumstances

Administrative/Engineering
Controls

  • Assess the demands of all
    jobs and have monitoring and control
    strategies in place for hot days and hot
    workplaces
  • Schedule hot jobs for cooler
    parts of the day
  • Reduce physical demands
  • Permit employees to take
    intermittent rest breaks with water
    breaks and use relief workers
  • Have air conditioning and
    shaded areas available for breaks/rest
    periods with ice available
  • Increase air movement
  • Exhaust hot air and
    steam

Health
Screening/Acclimatization

  • Let employees get used to
    hot working conditions by using a
    staggered approach over several days,
    such as beginning work with 50% of the
    normal workload and time spent in the
    hot environment, and then generally
    increase it over 5 days.
  • Make employees aware that
    certain medications—such as
    diuretics; anti-hypertensives (blood
    pressure); anti-cholinergics (pulmonary
    disease, chronic obstructive pulmonary
    disease [COPD]); and alcohol
    abuse—can
    exacerbate problems.

OSHA is also inclined to cite an
employer if prompt remedial action is
not taken when an employee falls victim
to heat stress.
Employers should establish specific
procedures for heat-related emergencies
and provision that first aid be
administered immediately to employees
who display symptoms of heat-related
illness. Those suffering from heat
illness may be resistant to first aid
because of the confusion caused by heat
stress. Therefore, training on the signs
and symptoms of heat illness is also
encouraged.

Heat illness is always a risk with
the arrival of summer, and it is crucial
to be prepared. Failing to create a
proper heat-illness
prevention program can put your
employees at risk and lead to a visit
from OSHA.

SIDEBAR

OSHA Launches Annual Summer Campaign to Prevent Heat-Related Illnesses

The Occupational Safety and Health Administration (OSHA) has announced the launch of its annual Campaign to Prevent
Heat Illness in Outdoor Workers. For the fourth consecutive year, OSHA’s campaign aims to raise awareness and educate workers
and employers about the dangers of working in hot weather and provide resources and guidance to address these hazards. Workers at
particular risk are those in outdoor industries, such as agriculture, construction, landscaping, and transportation.

Heat-related illnesses can be fatal, and employers are responsible for keeping workers safe, said U.S. Secretary of Labor Thomas
E. Perez. Employers can take a few easy steps to save lives, including scheduling frequent water breaks, providing shade, and allowing
ample time to rest.

Thousands of employees become sick each year and many die from working in the heat. In 2012, there were 31 heat-related worker deaths and 4,120 heat-related worker
illnesses. Labor-intensive activities in hot weather can raise body temperatures beyond the level that normally can be cooled by sweating. Heat illness initially may
manifest as
heat rash or heat cramps, but can quickly escalate to heat exhaustion and then heat stroke if simple preventative measures are not followed. Heat illness
disproportionately affects those
who have not built up a tolerance to heat (acclimatization), and it is especially dangerous for new and temporary workers.

Acclimatization is a physical change that the body undergoes to build tolerance to heat, and it is a critical part of preventing heat illnesses and fatalities,”
said Dr.
David Michaels, Assistant Secretary of Labor for OSHA. Over the past 3 years, lack of acclimatization was the cause in 74% of heat-related citations issued. Employers
have a responsibility to provide workplaces that are safe from recognized hazards, including outdoor heat. Last year, OSHA issued 11 heat-related citations. In some
of these
cases, the employer and staffing agency were cited because they involved temporary workers.

In preparation for the summer season, OSHA has developed heat-illness educational materials in English and Spanish, as well as a curriculum to be used for
workplace training—also available in both English and Spanish. Additionally, a Web page provides information and resources on heat illness—including how
to prevent
it and what to
do in case of an emergency—for
workers and employers. The page is
available at: www.osha.gov/SLTC/heatillness/index.html or http://tinyurl.com/3bqo442.

OSHA has also released a free application for mobile devices that enables workers and supervisors to monitor the heat index at their work sites. The app displays a
risk level for workers based on the heat index, as well as reminders about protective measures that should be taken at that risk level. Since its 2011 launch, more
than 130,000 users have downloaded the app. Available
for Android-based platforms and the iPhone, the app can be downloaded in English and Spanish by visiting: www.osha.gov/SLTC/heatillness/heat_index/heat_app.html or http://tinyurl.com/mffmqyb.

In developing its inaugural national campaign in 2011, federal OSHA worked closely with the California Occupational Safety and Health Administration and adapted
materials from that state’s successful campaign. Additionally, OSHA is partnering with the National Oceanic and Atmospheric Administration (NOAA) to incorporate
worker safety precautions when heat alerts are issued across the nation. NOAA also will include pertinent worker safety information on its heat watch website at
www.noaawatch.gov/themes/heat.php
or http://tinyurl.com/4mk6yf.

Figure 1

Adhesives

A variety of adhesive types are
available for many different
applications, including insulation attachment, insulation-fitting fabrication, and facing. Adhesives are available in water-based, solvent-based, hot
melts,
reactive-cure, pressure-sensitive, and aerosol formulations. These adhesives can be applied through
numerous methods, including brush, spray, trowel, and roll coater. When selecting an adhesive, the insulation
type, service-temperature limits, application method, and required adhesive strength should all be considered. Refer to the adhesive manufacturer’s
product
selection guides for assistance in choosing adhesives for specific uses. In all cases, regardless
of the type of adhesive used to secure the insulation, it is important to prepare the surface being adhered to. It
must be free of dirt, rust, loose particles, and oil. Wiping the surface with denatured alcohol is often
recommended. Ambient and surface temperature are also important considerations when selecting an
adhesive. When considering ambient temperatures, it is essential to factor in the temperature over the entire curing time. The surface being bonded to
must also
be considered. Steel (coated or painted), plastic (such as polypropylene), or others, may require
special preparation work or adhesives.

For attachment and fabrication, rigid insulations will usually require thicker, high-bodied adhesives capable
of filling small gaps, while flexible insulations such as fiberglass, mineral wool, or elastomeric use thinner
adhesives with a higher coverage rate. Attachment or fabrication of impermeable insulations will require contact,
pressure-sensitive, or reactive-cure adhesives to avoid trapping vapors. Water-based adhesives are not recommended. When using contact adhesives, it is
important
to coat both surfaces with a thin coat of adhesive (a thin coat is better than a thick coat),
and to allow the solvents to evaporate before combining the 2 surfaces. This may vary with installation conditions (temperature and humidity). When
using pressure-sensitive adhesives, it is important to apply pressure to ensure the adhesive is wetted out between the 2 surfaces being adhered. As the
installation
temperature gets colder, the amount of pressure to wet out the adhesive increases.

Other specialty adhesives include cryogenic adhesives for very cold operating systems (down to -320°F), and high-temperature inorganic adhesives for
hot work (up to 800°F). When used for attachment, most adhesives are used in conjunction with mechanical fasteners.

Duct-Liner Adhesives

Duct-liner adhesives include water
and solvent types as well as pressure-sensitive adhesive and hot melts. They
can be applied in a sheet metal shop
either as part of a coil line or on
fabrication tables. Typical duct-liner
specifications require 2 forms of
attachment; generally, weld or stick
pins and an adhesive are used. On coil
lines, the adhesive is often water based
to allow for immediate weld-pin
placement without concern for flash
fire. Water-based adhesives do not work
well with closed cell foam duct-liner
materials because the water cannot
evaporate. Hot melt, spray adhesives, or
pressure-sensitive adhesives are often
used on these products.

Reinforcements for Cements and Mastics

Reinforcing fabrics for cements and mastics are critical to prevent cracking over seams or areas of movement, and to improve the overall strength of the finish. They come in a variety of types
and sizes. The reinforcement chosen must be of the correct type and size, and be compatible with the mastic or cement to ensure proper function. Refer to the mastic or cement manufacturers’ product
data sheets for compatible reinforcements. Fiber fabrics include open-weave fiberglass, synthetic fiber meshes, woven canvas, and fiberglass cloth. Mastics are typically reinforced
with 10″ x 10″ open-weave cloths for most applications. Heavier duty 5″ x 5″ mesh cloths are sometimes used with heavier coats of mastics. Reinforcements should always be embedded within the wet
mastic or cement and be fully covered. All seams in the fabric should be overlapped by a minimum of 2 inches to avoid the potential for cracking.

Sealants

Sealants can be broken up into the following general categories:

  • Duct sealants
    • Sheet-metal sealants
    • Duct-board sealants
  • Flashing sealants
  • Joint sealants

Duct Sealants

Duct sealants come in a variety of formulations. Typically the sealant is a high-bodied water or solvent-based formulation applied by brush or cartridge gun. UL-181 A-M for duct board
and UL-181 B-M for flexible and rigid metal duct give standard requirements for duct sealants that may be used to specify them. Metal ducts should also
meet the Sheet Metal and Air conditioning Contractors National Association (SMACNA) pressure standards for the duct system being sealed. Refer to the duct sealant manufacturer’s
product data sheets and material selection guides for more information.

Flashing Sealants

Flashing sealants are used to seal insulation terminations, penetrations, and protrusions that occur around valves, gauges, and other areas where the insulation is broken. They may also
be used to seal metal-jacketing seams. Flashing sealants protect the exterior of the insulation system from the ingress of liquids or vapors. The flashing sealant must be compatible with
all the surfaces it comes in contact with, including the insulations and insulation finishes. It should be applied per the manufacturer’s instruction in order to create a
watertight seal.

Joint Sealants

Joint sealants are used to seal the longitudinal and circumferential butt joints of rigid insulation against moisture penetration. Joint sealants are
of
particular importance in cold-temperature systems to lock out water
vapor penetration between blocks of insulation. Joint sealants are made using high solids and are available in a
variety of types. The joint sealant should remain flexible after application to allow for movement in the insulation
system without cracking or splitting. Selection of the proper joint sealant will depend upon the operating
temperature at the point where the sealant is applied, the insulation type being sealed, and the finishes being
applied over the top of the insulation. Refer to the manufacturers’ product data
sheets and product selection guides for more information on the selection and application of joint sealants.

Other Accessory Products

There are a wide variety of additional accessory products required for successful installations of
mechanical insulation, including:

  • Securements
    • Studs and pins
    • Staples, rivets, and screws
    • Clips
    • Wire or straps
    • Self-adhering laps
    • Tape
  • Flashing
  • Stiffening
  • Supports
    • Heavy-density insulation inserts
    • Pipe-support saddles and shoes
    • Wood blocks and dowels
    • Pre-insulated pipe supports
  • Caulking
  • Expansion/contraction devices

These accessory products are readily available from a number of vendors.

The insulation market has seen steady growth in demand over the past decade, increasing on
average
by just under 3% annually between 2000 and 2010. The global
market for thermal insulation materials totalled 37.1 million tons in 2012, worth an estimated
$84.4
billion, including materials used in wall, floor, and roof
applications. This is expected to pick up further in the coming years.
In this article, the 5 main trends and drivers in the global sustainable insulation market are
discussed.

In this article, the 5 main trends and drivers in the global sustainable insulation market
are
discussed.

1) Building Codes
and Regulations

The main influences on demand for insulation materials are various international building
codes
and regulations. While these regulations act as a catalyst for
growth, they also impose limitations by restricting the use of certain materials in specific
applications. The introduction of new codes can have a marked effect on
the insulation market, which is expected to be seen particularly in Russia and Mexico in the
near
future—quantifying this effect, however, is difficult and highly
speculative.

2) Construction of New buildings

The effects of the global recession on new building construction are also evident,
especially in
the United States and Spain. Construction did enjoy a boost from
the recovery shown in many countries in recent years, especially during 2011 and 2012—with
the exceptions of France, Spain, and the United Kingdom in 2012. While no
reliable predictions are available, the general opinion in the insulation industry is that a
recovery
is underway in most regions, with the exception of Spain, whose
construction industry remains stagnant.

3) Population Growth and Urbanization

According to the latest predictions, the worldwide population is growing at a rate of 1.2%
annually from 2000 to 2018, and is set to reach over 7.5 billion by 2018.
Although the Asia-Pacific region accounts for the majority (55%) of the 2012 population, the
highest
growth rates will be seen in Africa and the Middle East.

Most importantly in terms of sustainable insulation, however, is that the global
population is
not only growing, but is moving from the countryside to the
towns and cities, stimulating demand for both commercial and residential buildings as well
as
associated infrastructure and services. Just over half of the
global population can now be said to be urbanized and this is expected to grow on average
by
almost 2% annually over the medium term, based on the latest
statistics available from the Central Intelligence Agency’s (CIA’s) almanac-style
reference guide
The World Fact Book.

4) Energy Costs

Energy costs are another significant driver of the consumption of insulation materials.
Energy
costs are widely accepted as the prime motivator driving growth in insulation—both in
commercial and residential applications—though other costs come into it as well,
particularly
in tightly managed projects or budgets. This is also true of production costs, of which energy
often
constitutes a large proportion, especially in the glass and mineral wool market, which uses
considerable amounts of energy in furnaces and ovens.

In this regard, the development of shale gas as a feedstock for many monomers and polymers
is seen
as a significant opportunity for the insulation market as it will help to hold down production
costs
and may offer new projects. However, it may also have a negative effect on insulation demand
since it
will likely decrease heating costs, reducing the obvious incentive for Facility Owners to
insulate.

The volatility of oil prices serves as an encouragement for Plant and Facility Managers to
improve
insulation, partly as a result of uncertainty over future fuel
price rises, and partly due to the perceived (if not real) belief that oil price reductions
seldom
find their way through to consumers’ heating bills.

5) Sustainability

Sustainability is the major force behind the development of new technologies, but there is
no easy
answer to the complex issue of sustainability of insulation
materials. Even the oil-based materials offer a degree of sustainability when measured against
competing materials in cradle to grave life-cycle analyses. It is not
correct to assume that natural fibers such as wool will automatically be more sustainable
than, say,
expanded polystyrene rigid boards. Regardless of the material
used, insulation is expected to save up to 12 times as much energy in its first year of
insulation,
making it an attractive option for both commercial and residential
projects.

The National Insulation Association (NIA) recently interviewed Bernie Markstein, U.S. Chief Economist for Reed Construction. Dr. Markstein has extensive experience in analyzing and forecasting commercial construction activity. He has a Bachelor of the Arts in Economics from Brown University and a Doctorate in Economics from Yale University. The following interview covers his thoughts on where the construction industry is headed and the factors that will affect the economic recovery.

As we move deeper into the second quarter of 2014, questions remain about the economic recovery in general and how the construction industry will fare. Most indicators predict  that the economy will continue to recover and the construction industry will also improve, though at a measured pace. Part of the slow pace of the recovery has to do with uncertainty about where government spending and taxes were headed in 2013. This uncertainty was a drag on investment and, consequently, on nonresidential construction—despite historically low interest rates. Simple government appropriations did not occur, and there were a series of continuing resolutions until the appropriations bill for the current fiscal year—which runs from October 1, 2013 through September 30, 2014—was passed and signed into law in January 2014.

Looking Back

The government shutdown in October 2013 also had a direct impact on a number of government construction projects, delaying the start of many projects and in some cases stopping them altogether. Following the government shutdown and the eventual passage of an appropriations bill, there was also the threat of hitting the government debt ceiling. If the debt ceiling was reached—which, at the time, was expected to occur in spring of this year—there would have been a wider shutdown of government. The Treasury would have been forced to delay paying various federal obligations, such as Social Security, Medicare, federal payrolls, payments to contractors, tax refunds, and debt payments (a technical default of U.S. government debt). Fortunately, Congress passed legislation suspending the debt ceiling until March of next year. Although the debt ceiling issue was ultimately avoided, this created great uncertainty at the time and increased the reluctance of businesses to invest in an already uncertain economic environment with relatively weak demand. More directly, the weak economic recovery was hit with sequestration—across-the-board cuts in federal funding for most of the federal government, which had a significant effect on construction projects.

The Recovery

Thankfully, we are now recovering from these events; some funding has been restored, and no new cuts are anticipated at this time. It is still necessary for Congress to act on legislation dealing with funding for construction projects. Without such multi-year funding, long-term planning, and contracts, the construction recovery will continue at a slower pace. Essentially, however, we are in a quiet period with government funding in place for this fiscal year and no immediate threat from the debt ceiling. This has removed some of the uncertainty for business planning and investment.

Other factors affecting construction include a long and difficult winter—even now, parts of the country are just beginning to see the signs of spring. March total construction spending was only up 0.2% from February, though it looks like many of the projects that were delayed in the first quarter will take place in the second quarter.

Employment

The forecasted overall employment numbers for May look positive, and growth is expected to continue in the coming month. This year, we are on track to move past the pre-recession peak in employment, which we are currently 100,000 jobs below. Ideally, we would be moving far beyond a peak from several years ago, but the fact that we are on track to reach the pre-recession peak is a good sign. Unemployment numbers are also decreasing—though this may be skewed by the fact that some people have given up on their search for employment. In the short term, it would be a good sign to see the unemployment rate temporarily go up—this would mean confidence in the economy was growing and people would rejoin the ranks of the unemployed (hopefully temporarily) while looking for work. A full and robust economy should see the addition of between 400,000–500,000 jobs a month, but even the addition of 200,000–300,000 jobs a month would be a good start. U.S. Census data measuring the past 12 months found that, on average, approximately 190,000 jobs were added per month, with 288,000 jobs added in April.

Construction employment has been on the rise, and we saw the addition of 32,000 construction workers in April, which is a positive step towards recovery. For the entire year, we have added close to 190,000 workers. The construction unemployment rate, which was at 13.2% last year, is now down to 9.4%, and projections predict the number will continue to decrease. Parts of the construction recovery have been by sector, with a large portion of additional jobs being added to the single-family and multifamily residential building sector, with overall residential construction spending expected to be 16% higher than in 2013. Robert Murray, McGraw Hill Construction’s Vice President of Economic Affairs sees “2014 as another year of measured expansion for the construction industry,” with construction starts rising 9% to $555.3 billion.1

Nonresidential Building

The nonresidential building sector has had a more difficult recovery, with nonresidential construction spending falling for the past 5 months. While overall spending is 3.5% higher than the same period a year ago, the recent drop in spending is still a concern. Part of the decrease may have to do with the weather, but it is more likely tied to other aspects of the economic recovery. There has been an absence of funding for buildings such as hospitals and schools, which depend largely on appropriations from the government. Education construction fell for the fifth month this year, and is 5.5% lower than it was this time last year. Health-care construction is also down 6.5% from last year. Other commercial (mainly retail) nonresidential building has improved, up 8.7% from this period last year, with office construction up 12%, and lodging up 33.7%. While these latter projects can be funded privately, there has been a hesitancy on the part of government to fund the types of institutional projects that would have further aided the construction recovery by spurring institutional construction such as educational and health-care facilities. Overall, however, the forecast is positive, with U.S. nonresidential building construction spending in 2014 predicted to increase 4.3% over 2013, and 2015 spending expected to increase 8.6% over 2014. To see the construction forecast for each sector, reference the graphs on pages 24–25. The breakdown of projects by state is available in the charts to the left.

Factors Influencing the Recovery

Infrastructure repairs are a huge category that has the potential to spur many construction projects and add construction jobs. Sewer and water treatment facilities desperately need updates, and although the forecast does have spending going up for water and sewer projects in 2014–2015, this increase will not be sufficient to offset all the repairs that are needed. The power sector will also be in need of updates, and we see spending going up for this in 2014, and then more significantly in 2015. Overall, the main issue that holds back spending is the conflict in government over federal spending. With different political parties in disagreement over proper taxation, and the associated appropriations for construction projects like these, the outcome for these projects remains to be seen.

Another development that holds opportunity for the construction industry is the “reshoring” of manufacturing into the United States. Due to a variety of factors including
reliable infrastructure, high worker productivity, shorter distance between manufacturer and selling market, and high availability of energy, we are seeing some American companies coming back to the United States, as well as other foreign companies showing interest in building their factories here. This could bode well for a variety of construction industries as demand for manufacturing buildings increases.

Although the outlook for the construction industry as a whole is positive, it is likely that power, water and sewer, and education will continue to struggle. Funding for educational
facilities in particular has been in reverse for a number of years and is expected to bottom out next year, with the potential for improvement in 2016. Overall, however, the forecasted growth for both residential and nonresidential building is looking up, which will increase demand for insulation and for the services of mechanical engineers.
SIDEBARS

Manpower Issues

The shortage of skilled workers is going to be one of the most significant issues as the industry recovers and demand for skilled workers increases across various construction sectors. During the recession, many workers left the construction industry, which is now facing a deficit of workers with the skills the industry needs. Brian Turmail, Executive Director of Public Affairs for the Associated General Contractors (AGC) of America, said in regard to this issue: “Somewhere in recent decades, our country made a collective decision that everyone should attend college. The robust workforce and technical education programs that once existed in our high schools disappeared in favor of college-track programs. When we lost this opportunity to show students what working in construction is really like and the opportunities out there, we lost our pool of skilled workers, as well.”2

This issue is also complicated by the fact that certain companies may be reluctant to hire workers who have been out of work for a significant period of time—even if they are qualified. There may also be an unwillingness to hire older workers, though they likely have the skill sets and knowledge that companies need. In response to this shortage, there have been some efforts to create the education needed to generate more skilled workers, particularly at community colleges. Labor unions can also be a potential source of education. It may prove worthwhile for companies to join together and create consortiums to train workers. Joining together has the benefit of diluting the cost, and could provide the infusion of skilled workers that the sector desperately needs. Of course, any consortium must be sure to avoid violating any anti-trust laws, which is easily accomplished with proper planning. Though there will be difficulties and growth may at times be slow, the construction industry is forecasted to recover in the coming years—it is crucial that we develop the workforce to ensure the industry’s growth is not hindered.

Developing a New Skilled Workforce

There have been some efforts to create the education needed to develop the skilled workers that the construction industry needs. San Antonio, Texas in particular has responded to this need by establishing the Construction Careers Academy (CCA) which offers 4 “strands” that aim to give students the education they need for careers in architecture, construction management, engineering, and the trades. Students may specialize in carpentry, HVAC, pipefitting, plumbing, welding, or electrical work. It has become a very popular program, and 505 eighth-grade students have applied for the 159 available spots in the upcoming freshman class. In total, the program has 475 students. 3 Educational programs like the CCA can play a tremendous role in creating the workforce that will be needed as the construction industry continues to recover and demand continues to grow.

Other groups have also been investing in educational programs. The Associated General Contractors (AGC) of St. Louis created the Construction Careers Charter High School, which was the first publicly funded high school for construction in the United States. Another organization, the Associated Builders and Contractors (ABC), Central Ohio chapter, created a public charter high school for construction. This 4-year program uses a combination of online courses, classroom learning, and on-the-job training.

Other states should use these programs as models to start their own educational programs. By proactively creating these programs, we can prevent future worker shortages down the road.4

1. Andrea Wells, “Construction Obstruction” Insurance Journal 92, no. 1 (2014).
http://tinyurl.com/pn3nvh8

2. Kelly Davidson, “Industry Seeks Answers to Increasing Labor Shortages” ENR.com (2014).
http://tinyurl.com/l2kc7t7

3. Kelly Davidson, “Industry Seeks Answers to Increasing Labor Shortages”
ENR.com (2014).
http://tinyurl.com/l2kc7t7

4. Kelly Davidson, “Industry Seeks Answers to
Increasing Labor Shortages” ENR.com (2014).
http://tinyurl.com/l2kc7t7


Copyright statement

This article was published in the June 2014 issue of Insulation Outlook magazine. Copyright © 2017 National Insulation Association. All rights reserved. The contents of this website and Insulation Outlook magazine may not be reproduced in any means, in whole or in part, without the prior written permission of the publisher and NIA. Any unauthorized  duplication is strictly prohibited and would violate NIA’s copyright and may violate other copyright agreements that NIA has with authors and partners. Contact publisher@insulation.org to reprint or reproduce this content.

Figure 1
Figure 2
Figure 3
Figure 4
Figure 5
Figure 6
Figure 7

Mentoring is a powerful tool that can
work wonders in any
organization. It can become even more
powerful if you
“reverse” it and ask younger
employees to serve as mentors
to more seasoned workers—or even
Managers.

What Is Reverse
Mentoring?

Traditionally, a person with more
experience will mentor a colleague
with less experience. This method has
been proven through
master/apprentice relationships that
have allowed knowledge to be handed
down over hundreds of years. In reverse
mentoring, a more experienced
employee—ideally, a Manager or
Supervisor—actively seeks the
counsel of an employee with less overall
experience. This modern twist
has older employees turning to younger
staff for fresh perspectives,
trend spotting, and technology guidance.
As Alan Webber, Cofounder of
Fast Company, put it, “Reverse
mentoring is when the old fogies in
the organization realize that by the
time you’re in your forties
and fifties, you’re not in touch
with the future in the same way
as the young twenty-somethings. They
come with fresh eyes, open minds,
and instant links to the technology of
our future.”

Reverse mentoring refreshes learning for
veteran employees and Managers,
while helping to build the leadership
skills and experience of newer
employees—who are, of course, also
learning new insights from the
relationship. When you pair a Manager
with a Millennial employee
(someone born between 1977 and 1998),
the Millennial mentor gets a
glimpse into the world of leadership and
top-level
leaders—something that generation
particularly values, which is
one benefit of reverse mentoring.
Another is that it acknowledges that
everyone brings something to the
table—even those who have just
started their careers. Millennials have
skills, knowledge, and
experience that is valuable to tenured
employees.

Why Reverse Your
Mentoring? One Word:
Millennials

Reverse mentoring has some unique
benefits that have to do with attracting
and retaining employees in the
Millennial generation—an essential
demographic for any
forward-thinking organization.
Millennials tend to prefer high-touch
relationships, have high exploratory
drives, and appreciate frequent
feedback. In other words, Millennials
and mentoring are a perfect match.

Here are 6 Millennial-specific
benefits to reverse mentoring,
which are just the tip of the iceberg:

1. Reverse
mentoring helps to retain and promote
younger talent. It creates a 2-way
conversation, allowing Supervisors to
learn what workplace conditions
younger employees seek in order to
advance themselves along with the
interests of the company.

2.
Reverse mentoring engages younger
and newer employees, promoting their
loyalty and generating trust.

3. It empowers emerging and
established leaders.

4. Reverse
mentoring “shrinks” big
organizations by crossing boundaries
that employees would not normally cross.

5. It begins to close
the knowledge gap between long-time
employees and newer hires.

6. Reverse mentoring infuses an
organization’s leadership with
different, fresh, and younger
perspectives.

Who Else
Benefits? Everyone!

Reverse mentoring is
ideal in situations where you want
established employees and Managers to
gain technical expertise, whether
it is in business applications or
smartphone apps. The same is true of
learning about new and emerging trends
in marketing, or areas of work
and society that might impact your
business.

It can also
strengthen the team even as it grows the
skills and strengths of the
individuals involved. For example, when
you pair a people-savvy
Associate with a Manager working on
winning over a prospective client,
everyone can benefit.

The
5 Ps of Successful Reverse
Mentoring

Before
you send a seasoned Executive and an
Intern into a conference room and
say “go,” there are a few
high-level guidelines that you may
want to consider. No matter how simple
you intend the structure of your
mentoring program to be, take time to
make a plan. Follow these 5 Ps for
a successful implementation:

1. Purpose

2.
Partners

3. Plan

4.
Progress

5. Performance

1.
Purpose:
Keep it Real

Many companies that implement
reverse mentoring programs have
straightforward objectives that range
from simply creating positive work
relationships between older and
younger workers, to more ambitious
outcomes such as transferring
technology savvy, new industry
expertise, trends, or cross- training.
The 3 most frequently cited reasons for
initiating mentoring programs
are retention, professional development,
and knowledge transfer.

Before you begin your program,
consider its purpose. That purpose
should be tailored to meet specific
(though perhaps broad) needs within
your organization. To determine those
needs, interview a mix of leaders
who are knowledgeable about your
organization’s challenges and
future. What needs do you hear?


Maintaining technical relevance


Keeping current with subject matter
advances


Protecting and sharing
“tribal” knowledge


Connecting with consumer culture and
clients


Growing future leaders

• Creating a
productive work climate


Keeping and growing talent

• Driving
multigenerational engagement

Your purpose is tied
to the results you wish to
see—your Mentoring Return on
Investment (MROI). You will need to
measure your MROI (see
#5—Performance), so set measurable
goals.
What kinds of actions or behaviors would
be evidence that the mentoring
program is working? Set out to seek
evidence versus proof, with
measurable results in areas such as:


Retention

• Professional
development


Transfer of scarce knowledge or skill

• Skill development

• Engagement

• Customer impact

• Succession planning

In addition to goals,
you should allow space for individual
innovation. List what the reverse
mentoring program is to achieve in
general, for all participants. Of
course, each partnership is unique, so
partners may also enjoy and
benefit from helping each other in ways
not defined by the program. A
young mentor might help a C-suite
Executive choose a new smartphone, or
a CEO might share tips on how a new
entrant can advance his or her
career. Factor in the need for informal
goals to be met as well.

Also consider whether you need the
support of your senior leadership
to help your program succeed. If so,
identify the key stakeholders and
describe what their involvement will
look like.

2. Partners:
Selecting and
Pairing

To
a large extent, how you
determine who will participate, and how
you pair off participants,
depends on your specific goals and the
needs of the individuals and the
company. When pairing, consider that
personal chemistry is often
overrated. The best matches are often
mismatches, which broaden the
opportunities for growth in both
participants. Mentoring relationships
should not be restricted to people of
the same gender, or to those who
have similar backgrounds, because we can
learn so much more from people
who are different from ourselves.

As you match mentors to
partners, consider development and
learning goals, geography, diversity,
and (of course) generational
differences. Are your Managers willing
to
be mentored by a younger colleague?

People who are naturally
inclined to make the most of a reverse
mentoring opportunity have these
characteristics:

• Demonstrate positive job
performance

• Build
effective relationships easily

• Continually develop job
knowledge


Appreciate diverse ideas

• Are willing to try new
approaches

3. Plan the
Launch

To kick off your program, host a 2- to
4-hour orientation meeting with
all participants. This meeting should be
a comfortable, informal forum
for everyone to get grounded and
organized. The program’s
Coordinator can define reverse
mentoring, answer the whys about reverse
mentoring, and discuss the benefits.
Partners are introduced to each
other, and the pairs can begin to
discuss their own goals and
expectations.

If possible, give
each pair some brief training
on learning and teaching styles, and
provide a general plan or guide for
the partnership. At a minimum, describe
a typical first meeting or
activity that partners can use to get
started (see “The First
Meeting” on page 24). As the
mentoring relationship progresses,
ask the following questions to each
partner to check the development of
the mentoring program:

1. Did your partner commit
to making this a relevant and productive
relationship—for example,
did your partner show a genuine
interest—and did you do the same?

2. Did your partner honor time
commitments—and did you?

Your kick-off
meeting should include tips
regarding generational differences. For
example: share insights into
generational differences; discuss
differences from perceptions to
attitudes among the various generations
in the workplace; and let
participants know how their generation
and others are perceived. At the
same time, caution everyone about
stereotypes and perpetuating stale
messages. Comments like “They
don’t want to pay their
dues” from tenured employees, and
“They’re stuck in
the past” from newer employees
will shut down reverse mentoring
efforts before they get off the ground.

Close the meeting by
outlining any logistics and details
involved in checking the progress of
the partnerships.


4.
Progress: Prioritize and Persist

Follow-up
and tracking is crucial to ensure that
the program is effective. For the
first 2 months of a mentoring
initiative, the program’s
Coordinator or Sponsor should plan a
pulse-check every 2 to 3 weeks to
confirm that your guidelines and ground
rules are still in place.
Encourage partners to evaluate their
mentoring relationship.

After the first 2 months, scale back to
a monthly check. Ask for
participants’ feedback, focus on
catching any problems early, and
ask about successes. Remind each
participant that you are available for
support and troubleshooting.

How can you tell that the
mentoring relationship is working? Look
for the following success
indicators:

• People are taking the time to
meet and work together


Partners are satisfied with the
progress

• Partners are
benefiting from and enjoying the
partnership


Participants have ideas to improve the
program

Research
shows that the biggest dangers
to successful mentoring relationship are
neglect (from lack of
commitment, time, and energy), breaches
of confidence, and the failure
to understand culture and generational
differences. As you implement
your reverse mentoring program, be on
the lookout for these pitfalls.
Asking partners questions about the
structure of the mentoring program
can help you calibrate and adjust:

• How
would you rate the time commitment? (Too
much, too little, just right?)

• To what degree did the
program provide the orientation,
tools, and ongoing support that you
needed?

Many participants report that the most
valuable part of a mentoring
partnership is the opportunity to learn
and stretch personally and
professionally. Publish, share, and
celebrate these successes! Check in
with partners and get their reactions to
the program with the following
questions:


What do you like best about the
mentoring program?

• What
do you like least about the
mentoring program?

• What
was your goal for
participating, and to what degree did
you accomplish your goal?

• How valuable has the mentoring
program been to your professional
career?

5. Performance:
How Will We Know We Are
Succeeding?

Part of your
plan should include evaluating the
success of your program, including
measuring and quantifying outcomes. The
Coordinator of the program
should perform all monitoring of
participating pairs, though he or she
may need some help with evaluation.

Your evaluation might
include questionnaires or surveys of
participants, individual
interviews, or observation of their
meetings. You are seeking to measure
some difficult-to-quantify outcomes,
including individual attitude and
behavior, as well as accomplishments.
Here are 4 ways you can gain
information to gauge success:

• Anecdotal
information related to the program goal

• Participant
survey (satisfaction/climate) results

• Feedback on
effectiveness

• Self-reported feedback from the mentors
and their partners

If evaluations indicate that
the program is not meeting its goals, be
prepared to make some changes,
re-train participants, or otherwise
support the program to ensure it is
successful.

Final
Thoughts

Reverse mentoring can be a winning
situation for everyone involved. You can
cement the loyalty, interest,
and talents of your Millennial team
members; and more experienced
employees will realize that access to
new and different ideas can make
them more effective at serving clients
and driving earnings. In other
words, when you mix fresh, unbiased
perspectives with detailed knowledge
and strategic skills, the results are
innovation and increased employee
engagement across the board.

SIDEBARS


Reverse Mentoring
Examples

Sue, the Vice President of Human
Resources, asks Alan, a new 20-something
Sales Support Representative, to meet
with her monthly to share ideas on how
their company can create
opportunities that are exciting for
Millennials. In return, Alan gains a
rare inside view of how the organization
operates.

Rick is a young delivery driver who
lives and breathes social media. Once
his company’s Director of
Marketing discovers this interest, she
asks him
to add a regular meeting to his
schedule. He visits her office to
provide her with his personal feedback
and his generation’s perspective
on the
company’s social media
presence.


Mentoring Glue

To ensure that your reverse
mentoring program is effective, you need
to put some thought behind it. Take some
time to consider the “hard
glue”
and “soft glue” that can
hold a successful program together.


Hard Glue:

1. Clear boundaries and well-defined
expectations. Both partners need to be
clear on what they want to accomplish.

2. Agreed-upon rules. Each partner
must be fully committed to the mentoring
relationship, with

regular—at least
monthly—meetings and activities.
Partners should agree to be cooperative
and

respectful.


Soft Glue:

1. Willingness to learn. In a
reverse mentoring relationship, both
parties must genuinely want to learn
from and share with the other.

2. Mutual trust. The goal is to push
each other outside of comfort zones and
try new ways of thinking, working, and
being. Ideally, the partners will
create a safe, professional, yet
risk-taking environment, and maintain
confidentiality.

3. Transparency. Both partners must
be open with their feelings and with
what they are thinking. They must be
able to overcome differences in
communication
style and be open to seeing
situations from different angles.


Your Launch Agenda

During the launch, provide guidance
and support for participants. Include
these topics:

• Why reverse mentoring, and
why now? (Make the business case).

• Set a level playing field.
(Use a tool such as an experience
timeline.)

• Set guidelines and personal
goals.

• Address differences in
learning styles.


“How Will We Know?


Quantitative Success Measures

• Number of people seeking
mentors

• Number of mentors who
volunteer

• Number of people who have
mentors

• Number of development plans
that are implemented with mentor support
or influenced by mentors

• Employee or climate survey
results (questions related to career-
friendly climate)

• Number of meetings held with
mentors and their partners

• Number of personal and
professional goals achieved that are
attributed to mentor support

• Number of key employees
retained who have mentors versus
retention rates for those without
mentors


Qualitative Success Measures

• Self-reported feedback from
participants regarding the value of the
experience and the personal and business
impact

• Feedback on increased
participant job effectiveness from
participants’ Managers

• Anecdotal information about
idea and best practice transfer across
departments, functions, or business
units

• Critical business projects
or initiatives that are positively
impacted because key participants
benefited from mentor involvement,
support, and/or
knowledge transfer


The First Meeting

The first meeting between the mentor
and his or her partner is like sitting
down to write a book and staring at a
blank piece of paper. How do you get
started? The answer in this case is
by getting to know each other.

The mentor—that is, the
younger employee—takes the role of
teacher. Regardless of who leads the
conversation or sets the agenda, it is
essential that both partners
remember the goal is for the Manager or
tenured employee to learn from a younger
counterpart and not take over the

mentor’s role.

The mentor can start the
conversation by telling stories and
encouraging his or her partner to tell
stories, giving specific examples
related to his or her
personal and professional
experiences. Both should share lessons
they have learned from
experience—whether on the job or
outside of work. This will
increase their credibility and
breathe real life into their
recommendations.

Here are some conversation starters
to kick off meaningful
discussions—conversations that
count:

• What is something that most
people do not know about you?

• Discuss strategies to
balance work and personal life. What
have you learned that you could share?
What compromises have you made? How do
you feel
about them?

• Talk about your work and
life experiences. What have you done
that was unusual or controversial? What
experiences do you hope to have in the
future?

• What mistakes have you made
that you thought would have a negative
impact on your career? How did you learn
from them? What would you do
differently?

• What is the smartest
decision you ever made, and why? What
did you learn that you would like to
apply to the future?

• What legacy are you creating
or building? What kinds of things are
you doing to pass along your expertise?

• What is some of the best
career advice you have received? Why?
How have you put it into practice?

What makes a conversation
comfortable and candid? The formula is
simple and the results can be
extraordinary. A great conversation just
takes curiosity and
a willingness to be changed or
stretched by another person’s
experience.

It can be somewhat difficult to keep
abreast of the developments regarding
the Affordable Care Act (ACA). Following
is some additional information in
simple outline form to assist you as
you prepare for these new regulations.

Individual Mandate
Postponed

The individual mandate originally
required legal residents to obtain
healthcare insurance beginning in 2014
or face a tax penalty. The tax escalates
from
$95 per person in 2014 to $695 per
person in 2016. But on December 19,
2013, President Obama changed the rules
for people whose health plans were
canceled;
the compliance obligation in 2014 is
now vacated. This means that individuals
who lost their insurance plans do not
have to get coverage and do not have to
pay any penalty. They are also
eligible to buy what is known as
“catastrophic insurance.”

Employer Mandate Delayed
Until 2015

One of the biggest news items in
healthcare reform is that the employer
mandate, or
“play-or-pay”
rules, has been delayed a year. The
employer
mandate requires large employers
(i.e., those with at least 50 employees)
to offer full-time employees (i.e.,
those working at least 30 hours per
week)
quality, affordable coverage or pay
a penalty.

Another uncertainty is exactly when
the rules will kick in for employers
that sponsor non-calendar year group
health plans. For example, assume the
employer sponsors a group health
plan on a July 1 through June 30 plan
year. It is unclear whether the rules
for this employer become effective
January 1,
2015 or July 1, 2015.

For more information, see Tower
Watson’s “Employer
Play-or-Pay Mandate Penalties
and
Certain
Employer Reporting Requirements Delayed
Until
2015.”


www.towerswatson.com/en-
US/Insights/Newsletters/Americas/health-
care-reform-bulletin/2013/Employer-Play-
or-Pay-Mandate-Penalties-Delayed-Until-
2015

Electronic Small Business
Health Options Program (SHOP)
Application Delayed a Year

One of the centerpieces of health-care reform is the health-care
exchange or
marketplace. This is where
individuals and small employers (i.e.,
those with fewer than 50 employees) can
go to buy health insurance. The
government envisioned
that the exchanges or marketplace would
be
automated and that individuals and small
businesses could enroll for coverage
electronically. However, that has not
been the
case. In fact, the government announced
that the
electronic enrollment system for
small employers will not be operational
until November 2014. More information is
available in the following article:
“U.S. Delays Online Health
Insurance Enrollment for Small
Businesses” by David Morgan,
Reuters.


www.reuters.com/a
rticle/2013/11/27/us-usa-healthcare-
shop-idUSBRE9AQ12I20131127

There has been a series of
difficulties and issues with the health-care exchange rollout, but it is widely
believed that these issues will be fixed
and the
program will improve over time.

Small Employer Tax Credit

One of the benefits of health-care
reform is a tax credit available to
certain small employers that offer group
health coverage to their employees. In
an
effort to encourage certain small
employers (i.e., those with fewer than
25 employees) to offer their employees
health coverage, the government is
providing a tax credit to help
employers pay for the cost of the
coverage.

The tax credit can be up to 50% of
the amount the employer pays in
premiums, which can provide significant
savings. You can claim the credit by
completing
IRS Form 8941. Ask your tax
professional if you qualify for this
credit.

You can also get more information
from the Internal Revenue
Service’s (IRS’)
website—see “Small Business
Health Care Tax Credit for
Small Employers—What You Need
to Know about the Small Business Health
Care Tax Credit.”


www.irs.gov/uac/Small-
Business-Health-Care-Tax-Credit-for-
Small-Employers

Start Preparing for New
Reporting Requirements

Although the employer mandate has
been postponed, employers need to
prepare for a host of new reporting
requirements. In addition to the
employer mandate, healthcare reform
imposes a penalty on most individuals
who do not have health coverage. The
government needs employers to provide
certain information to
implement the penalty. Therefore,
employers need to start gathering that
data now.

There are 2 sets of reporting
requirements: 1 set of rules applies to
all employers, and the other set only
applies to larger employers. The rules
are
fairly complex. If you use an
outside payroll service, check with them
to see if they can help gather the
information needed to comply with the
rules.

You can read details in the
following resources:

• Buck Consultants’
“IRS Holds Hearings on Employer
Reporting Requirements under Health Care
Reform”


www.buckconsultants.com/portals/0/public
ations/fyi/2013/FYI-2013-1217-IRS-holds-
hearings-em-report-reqs-under-
HCR.pdf

• Alston & Bird
LLP’s “Employee Benefits
& Executive Compensation
Advisory”


www.alston.com/Files/Publication/7fcf
5e0c-4704-454d-907b-
accf7954958e/Presentation/PublicationAtt
achment/253b695e-c04e-4ad1-ad70-
1cc7b1ae7b43/13-882 Health Care Reform
Update.pdf

Year-End Notices

With 2013 having come to a close, it
is a good time to ensure that all the
required notices have been distributed.
The following is a list of those
year-end notices.

• Children’s Health
Insurance Program Reauthorization Act

• HIPAA Notice of Privacy
Practices

• Medicare Part D Notice of
Creditable or Non-Creditable Coverage

• Notice Regarding
Grandfathered Plan Status

• Summary of Benefits and
Coverage

• Women’s Health and
Cancer Rights Act

Many of the notices are distributed
by the insurance company—if you
maintain a fully insured plan—or
by the third-party administrator (TPA)
if you are self-funded. In either case,
it is prudent to make sure that the
notices were distributed. For details,
see Miller Johnson’s “Annual
Notice Requirements for Employer
Group Health Plans for 2014.”

www.millerjohns
on.com/pubs/xprPubDetail.aspx?
xpST=PubDetail&pub=2077

Helpful Checklist

There are so many requirements
associated with sponsoring employee
benefit plans that it can be easy to
miss or forget something. A
comprehensive checklist
of all the requirements associated
with offering both retirement and
welfare benefit plans can be found on
Sibson Consulting’s website. This
material
was prepared by one of the largest
consulting houses in the country and
provides a good overview.


www.sibson.com/publications-
and-resources/rd-calendar/

As a practical matter, you should
look to your agent, insurance company,
or TPA to help in your compliance
efforts.

Medicare Part D Creditable
Coverage Notices Due

Medicare Part D is the prescription
drug benefit under Medicare. The
Medicare Part D program was established
under President George W. Bush to help
seniors
pay for prescription drugs under
Medicare. The rules impose a penalty for
those who are eligible for the program
but do not enroll UNLESS the person is
covered under a plan that already
provides prescription drug benefits.
From the employer’s prospective,
there are 2 notice requirements: 1
notice is
distributed to the employees, the
other notice is submitted to the
government electronically. The notice to
government is due within 60 days after
the
close of the plan year. This means
the information had to be submitted to
the government by March 1, 2014 if you
maintain your group health plan on a
calendar-year basis. Hub
International provides some useful
information on these notices.


www.connects.hubinternational.com
/employee-benefits/medicare-part-d-
reminder-cms-reporting-duty/

Increased Medicare
Withholdings

One of the ways the government is
paying for healthcare reform is through
increased Medicare taxes on certain high
earners. The increased tax started in
2013, but the IRS issued some more
guidance recently.

This is a payroll function, but you
should check to make sure your payroll
department is up to speed on the rules.
For more information, see McDermott Will
& Emory’s “Employer
Obligations for Additional Medicare
Tax.”


www.mwe.com/Employer-
Obligations-for-Additional-Medicare-Tax-
12-09-2013

Health Flexible Spending
Account (FSA) “Use it or Lose
it” Rule Modified

Health FSAs have been around for
decades, and the “use it or lose
it” rule has been part of the
health FSAs from the beginning.
Basically, the
rule stipulates that if there is any
money left over in the FSA after the
close of the year, the money has to be
forfeited. Several years ago, the IRS
modified the rules to give
participants a 2½-month grace
period. This allowed people to incur
claims up to 2½ months after the
close of the plan
year to use the money. Healthcare
reform limited the amount an employee
can contribute to his or her health FSA
on a pre-tax basis to $2,500 per year.
The
IRS has gone a step further, and
participants can now carry over $500
from 1 year to the next.

It is up to the employer whether
they want to amend the plan to allow for
this limited carry over. The decision is
not as simple as it may seem. For
example, the employer cannot have
both a 2½-month grace period and
the carry over; they must choose 1 of
the options. Note that there is no limit
on
the amount that can be used during
the 2½-month grace period if the
employer adopts this option. On the
other hand, the maximum carry over is
limited
to $500. For more information on the
pros and cons of adopting the carry over
feature, see the following articles:

“Implementing the
Health FSA Carryover: Tips and
Traps”
by Christine P.
Roberts


www.eforerisa.wordpress.com/2013/
11/22/implementing-the-health-fsa-
carryover-tips-and-traps

“Use It or Lose
It: New IRS Guidance Permits Carryover
for Health FSAs”
by Heather
B. Abrigo and Dawn E. Sellstrom


www.drinkerbiddle.
com/resources/publications/2013/Use-It-
or-Lose-It-New-IRS-Guidance-Permits-
Carryover-for-Health-FSAs?
Section=Publications

Government Revises
Children’s Health Insurance
Program Reauthorization Act of 2009
(CHIPRA) Notices

Employers are required to distribute
a notice each year telling people about
the option certain states offer to help
pay the premiums for a child’s
coverage under the employer’s
group health plan. The government has
just updated that notice. Technically
speaking, employers only have to hand
out
the notice to those people who live
in states that have adopted this option.
Ohio, for example, does not currently
participate in the program, but the
conservative approach is for
employers to include the notice in the
annual enrollment materials. The current
notice will expire in 2016. Marsh &
McLennan Agency’s provides a
useful summary.

www
.rjfagencies.com/Blog/UpdatedCHIPNoticef
orUseUntil2016.aspx

Strategies for Offering
Employee Benefits After ACA

Colonial Life’s white paper
“Beyond Health Insurance: Creating
a competitive benefits program in the
health care reform world” provides
general information about offering
various employee benefits.


www.coloniallife.com/Newsroom/~/media/ac
robat/newsroom/white%20papers/ns-
13284.ashx

While this guide was written by a
carrier who certainly has a vested
interest in the topic, it does outline
some useful things to consider when
developing
a total benefit package for
employees.

For further information on health-care compliance, contact health care or
legal experts. Keep in mind that by time
of publication, some of this
article’s information already
may have changed, due to
Washington’s rapid developments.

SIDEBAR

Health
Insurance Mandates Delayed for Medium
and Large Companies

On February 10, the Obama
Administration announced that employers
with 50 to 99 workers would be given an
extension of 2 years—until
2016—before they are required
to provide health insurance to most of
their full-time workers. After this
delay, employers with 50 to 99 workers
risk federal penalties if they
fail to offer health insurance to
the majority of their full-time workers.
Larger companies with 100 workers or
more are also getting a reprieve, and
they
can avoid a fine by offering
insurance to 70% of their full-time
workers in 2015, and will not be
required to offer health care to 95% of
their workers
until 2016. The administration is
offering this extra time to ease the
transition for companies who have not
offered health insurance in the past.


Construction Market
Forecast: Slow and Steady 2014


By Tim Grogan and Tom
Ichniowski

It has been a long time coming, but
the construction recovery seems to be
almost here. The housing market has been
keeping up construction growth, which is
rebounding from record lows, but now
many of the nonresidential building
markets are starting to turn the corner,
making for many optimistic forecasts for
2014. The remaining drag on construction
growth for next year is the public
sector, which continues to be squeezed
by the battle over the federal deficit.

Some economists, however, see a
silver lining even there. “The
recession pushed millions of workers out
of the industry, and it is not going to
be easy to get them back, so a slow but
steady recovery might be the best thing
for helping to control inflation,”
says Randy Giggard, Chief Economist for
the Fails Management Institute (FMI),
Raleigh, North Carolina. “You
could make a similar argument for some
of the materials markets.”

Construction market fundamentals are
there for even stronger growth, but
markets are hobbled by political
uncertainty generated by chronic budget
battles between Democrats and
Republicans. All the forecasts collected
by the Engineering News-Record (ENR)
take into consideration this political
uncertainty, but if politics spins out
of control again, the rather optimistic
consensus among economists for 2014
could suddenly turn less sunny. For now,
all the forecasts suggest the industry
can look, as the Monty Python song says,
“on the bright side of
life.”

The McGraw Hill Construction (MHC)
forecast for 2014 is certainly on the
bright side, calling for a 9% increase
in construction starts next year. It
also predicts strong double-digit growth
in the dollar value of single-family
housing, multifamily housing, and
commercial buildings. MHC also is
forecasting that a 3-year decline in
institutional buildings will be checked
in 2014 with a modest 2% gain next year.
Manufacturing work is forecast to
increase 8% next year, following a 6%
increase this year. MHC expects public
works to fall another 5% next year,
while the power market drops 33%.

“Our outlook is positive, with
a few caveats,” says Robert Murray, MHC
Chief Economist. “This is another
step on the way to a more full-fledged
expansion,” he adds.
“Because this is a measured
expansion, there is a very good chance
this forecast will play out.”

Murray cautions the industry not to
get too excited about percent changes.
While MHC is seeing good growth in the
residential and commercial markets, and
many nonresidential building markets are
starting to turn the corner, most are
still below peak levels, Murray says.

Murray puts himself in the
“slow-and-steady is not a bad
thing” camp. &#8220The way the
recovery is unfolding is beneficial for
2 reasons: It lessens the chance of
another boom-then-bust cycle, and it
allows for labor constraints to be less
severe,” he says.

Robert Denk of the National
Association of Home Builders (NAHB),
Washington, D.C., agrees that slower is
better-do not get too excited about
percent changes. “We are seeing
some great percent increases, but we are
still short of where we would like to
be,” he says. For Denk, a
“normal” market would be
about 1.3 million housing starts a year.
NAHB estimates that total housing starts
will increase a healthy 18%, to 924,000,
this year. NAHB predicts the market will
approach ”normal” next year,
with 1.15 million starts.

While double-digit increases in
housing are driving overall construction
growth, economists are just as excited
about some broad swings in the
nonresidential markets that they see
coming next year. Murray predicts that
Dodge starts for educational buildings
will swing from a negative 3.4% this
year to a positive 3.0% in 2014. He also
sees health care going from a minus 2.8%
this year to a plus 2.0% next year.
“The key for 2014 is institutional
buildings. Can [that market] stabilize,
or is there room for further declines?
” he asks. Murray’s forecast calls
for the institutional building market to
bounce back 2% next year, after falling
4.4% in 2013.

Similar Swings

FMI’s Randy Giggard predicts similar
swings. FMI’s forecast calls for the
office market to go from a minus 2% to a
plus 4%, for school building to go from
a 4% decline to a 4% increase, and
health-care work from down 1% to up 6%.
“Health care follows a natural
cycle, and it is just time to start
building more hospitals,” Giggard
says. “And people keep voting for
school building bonds, so that market is
looking good, too,” he adds.

The Portland Cement Association
(PCA), Skokie, Illinois, is predicting
an 8% increase in construction put-in-place next year, compared to an
estimated increase of just 1.3% this
year. The PCA forecast is a little more
bullish on public construction than
other forecasts. PCA predicts growth in
the overall public market will swing
from a negative 5.2% this year to a
positive 3.4% in 2014.

The Associated Builders and
Contractors (ABC), Washington, D.C., is
forecasting a 6% increase in
construction next year. “Our model
shows next year’s growth of 5% for
commercial construction, 7% for health
care, 8% for lodging, and 6% for
communications,” says Anirban
Basu, ABC’s chief economist.

The forecast for highway paving and
bridge work by the American Road &
Transportation Builders Association
(ARTBA), Washington, D.C., is mixed,
with tepid growth for paving work but
relatively strong growth for bridge
construction. “The 1.9% increase in
paving work we are forecasting for next
year barely even qualifies as a
rebound,” says Alison Black, ARTBA’s
chief economist. She estimates the
paving market fell 11.4% this year,
following a 3.3% decline in 2012.
“The pavement market looks pretty
sluggish over the next few years,”
she adds.

Bridge work, on the other hand, is
growing at a steady pace. ARTBA predicts
the dollar value for bridge work in 2014
will increase another 5.6%, after
increasing 7.1% this year and 5.1% in
2012.

“We have seen a big divergence
between the highway and bridge
markets,” says Black. “On
the pavement side, we have seen a
significant pullback in state and local
spending. But what is really holding
down our forecast is the questions over
the Highway Trust Fund,” she adds.
“There is very little money going
into new construction.”

Indeed, federal government funding
is a key issue for many construction
markets next year because of its
uncertainty. A congressional budget
standoff caused a 16-day shutdown of
much of the federal government in
October, further unsettling the
companies that pursue federal
construction projects.

During the shutdown, many agencies
did not award new contracts, and there
also was a temporary halt in the Corps
of Engineers’ processing of permits to
build in and around wetlands.

Finally, on October 16,
congressional leaders reached an
agreement to extend funding through
January 15 and brought federal workers
back on the job. The measure also
averted a government default by raising
the debt ceiling through February 7.

In addition, the deal called for
members of the House and Senate budget
committees to begin negotiations toward
a budget blueprint for fiscal year 2014.
If enacted, it would be the first budget
resolution to become law since 2009. The
joint House-Senate budget conference
committee held its first meeting on
October 30 and met again on November 13
but did not reach an agreement.

The conferees, led by House Budget
Committee Chairman Paul Ryan (R-WI) and
Senate Budget Panel Chairman Patty
Murray (D-WA), face a December 13
deadline to produce a deal. (Note: Since
printing, this deadline passed and was
not met. Budget negotiations are still
in progress).

Murray said the minimum goal would
be to set an overall discretionary-spending cap for 2014. While the House
approved a $966-billion limit, and the
Senate passed a $1.058-trillion cap.

If the budget conferees can agree on
a compromise “top line”
spending figure, the House and Senate
appropriations committees would set to
work to determine 2014 funding levels
for each line-item account, including
construction programs. Another open
question is whether the budget conferees
will replace the mandatory budget
sequester’s wide-ranging spending
reductions with some alternate formula
for reductions. The 2013 sequester round
cut construction spending by $4 billion,
according to ENR’s estimate.


Reprinted courtesy of
Engineering News-Record, copyright
McGraw Hill Financial, December 2/9,
2013, All rights reserved. The full
report (subscription required), is
available at

https://enr.construction.com/engineering
/subscription/LoginSubscribe.aspx?
cid=27158.


Construction Firms Expect
Growing Demand in 2014

Many firms plan to start hiring
again, and most contractors predict
demand will either grow or remain stable
in virtually every market segment this
year, according to survey results
released on January 21, 2014 by the
Associated General Contractors of
America (AGC). The survey, conducted as
part of Optimism Returns: The 2014
Construction Industry Hiring and
Business Outlook, provides a generally
upbeat outlook for the year even as
firms worry about growing worker
shortages, rising costs, and the impact
of new regulations and federal budget
cutting.

“Contractors are more
optimistic about 2014 than they have
been in a long time,” said Stephen
E. Sandherr, the AGC’s Chief Executive
Officer. “While the industry has a
long way to go before it returns to the
employment and activity levels it
experienced in the middle of the last
decade, conditions are heading in the
right direction.”

Sandherr noted that many firms plan
to begin hiring again, while relatively
few plan to start making layoffs. Forty-one percent of firms that did not change
staff levels last year report they plan
to start expanding payrolls in 2014,
while only 2% plan to start making
layoffs. However, net hiring is likely
to be relatively modest, with 86% of
firms reporting they plan to hire 25 or
fewer new employees this year.

Among the 19 states with large
enough survey sample sizes, 100% of
firms that did not change staffing
levels last year in Utah plan to start
hiring new staff this year, more than in
any other state.

Contractors have a relatively
positive outlook for virtually all 11
market segments covered in the Outlook,
in particular for private-sector
segments. For 5 of those segments, at
least 40% of respondents expect the
market to expand, and fewer than 20%
expect the market to decline in 2014.
The difference between the optimists and
pessimists-the net positive reading-is a
strong 28% for private office,
manufacturing, and the combined
retail/warehouse/lodging segments; and
25% for power and hospital/higher
education construction.

Among public-sector segments,
contractors are more optimistic about
demand for new water and sewer
construction, with a net positive of
17%. Contractors are mildly optimistic
about the market for highway
construction, with a net positive of
10%. Respondents are almost equally
divided regarding the outlook for the
other 4 segments, ranging from net
positives of 5% for public buildings, 4%
for schools, and 3% for transportation
facilities other than highways, to a
negative of 2% for marine construction.

Sandherr added that contractors’
market expectations are significantly
more optimistic than they were at this
time last year. At that time, more
contractors expected demand to shrink
for highway, other transportation,
public building, retail, warehouse and
lodging, K-12 schools, and private
offices than expected it to grow.

Many contractors also report they
plan to add new construction equipment
in 2014. Seventy-three percent of firms
plans to purchase construction
equipment, and 86% report they plan to
lease it this year. The scope of those
investments is likely to be somewhat
limited, however. Forty-four percent of
firms say they will invest $250,000 or
less in equipment purchases, and 53% say
they will invest that amount or less for
new equipment leases.

One reason firms may be more
optimistic, association officials noted,
is that credit conditions appear to have
improved. Only 9% of firms report having
a harder time getting bank loans, down
from 13% in last year’s survey. Only 32%
report customers’ projects were delayed
or canceled because of tight credit
conditions, compared with 40% a year
ago.

“While the Outlook is
significantly more optimistic than in
years past, there are still areas of
concern for most contractors,”
said Ken Simonson, AGC’s Chief
Economist. “Many firms will
struggle to find enough skilled workers,
cope with escalating materials and
health care costs, and comply with
expanding regulatory burdens.”

Ninety percent of construction firms
report they expect prices for key
construction materials to increase in
2014. Most, however, expect those
increases will be relatively modest,
with 43% reporting they expect the
increases to range between 1 and 5%.
Meanwhile, 82% of firms report they
expect the cost of providing health-care
insurance for their employees will
increase in 2014. Despite that, only 1%
of firms report they plan to reduce the
amount of health-care coverage they
provide.

Simonson noted that as firms
continue to slowly expand their
payrolls, they were likely to have a
harder time finding enough skilled
construction workers. Already, 62% of
responding firms report having a
difficult time filling key professional
and craft worker positions; two-thirds
of firms expect it will either become
harder or remain as difficult to fill
professional positions; and 74% say it
will get harder, or remain as hard, to
fill craft worker positions.

Those worker shortages are already
having an impact, the economist added.
Fifty-two percent of firms report they
are losing construction professionals to
other firms or industries, and 55%
report they are losing craft workers. As
a result, a majority of firms report
they have improved pay and benefits to
help retain qualified staff. One reason
they are likely worried is that nearly
half of the firms believe training
programs for new craft workers are poor
or below average.

Adding to their challenges, 51% of
contractors report that demand for their
services is being negatively impacted by
federal funding cuts, new federal
regulations, and/or Washington’s
inability to set an annual budget.
“It would appear that Washington
is not here to help as far as
contractors are concerned,“
Simonson noted.

Association officials added that
survey respondents would prefer that
Washington officials work on other
priorities. Seventy-seven percent of
firms reported listed having Washington
find ways to make it easier to prepare
the next generation of skilled workers
as a top priority, 63% listed repealing
all or part of the Affordable Care Act
as a top priority, and 63% listed
renewing tax deductions and bonus
depreciation for construction equipment
as a top priority.

The Outlook was based on survey
results from over 800 construction firms
from every state and the District of
Columbia. Varying numbers responded to
each question. Contractors of every size
answered over 40 questions about their
hiring, equipment purchasing, and
business plans.

The Optimism Returns: The
2014 Construction Hiring and Business
Outlook report is available in full at

www.agc.org/galleries/news/2014%20Constr
uction%20Hiring%20and%20Business%20Outlo
ok%20Report%20%282%29.pdf


Nonresidential Construction
Index (NRCI) Predicts Growth, Hiring
Concerns in 2014

Nearly all components of the FMI’s
2014 first quarter NRCI report are on
the rise. The NRCI bounced back from a
drop of 2.9 points in the fourth quarter
of 2013 to register 64.9 in the first
quarter of 2014, the highest mark yet
for the NRCI and 6.8 points better than
the first quarter in 2013. FMI’s current
report and reports from other sources
and surveys are beginning to indicate a
growing industry challenge to find and
hire more talented people.

That concern will continue,
according to 49% of FMI’s panelists who
expect growth in construction to improve
from 2.6% to 5% next year, while 36%
expect more modest growth. Few expect
slower growth, and only 3% expect more
expansive growth. The forecast for
construction growth is nearly matched
with the expectation of hiring growth.
More likely, hiring will continue to lag
growth in backlog since most panelists
do not expect to hire until they
absolutely need to and current staff is
consistently maxed out. One of FMI’s
panelists explained, “We are
focused on hiring the top talent
available before we need the help.
Waiting to hire a body because you have
more work than you can handle produces
weak results and unhappy teams.”
The question as to when to hire is
something each company will have to
answer for itself, but the report notes
that hiring talented people ranks at the
top of the challenges for 2014 given by
FMI’s panelists.

The NRCI report was prepared
by FMI. The full report is available
online at
www.fminet.com/visitor/download/fre
eDownload/id/557


After a Year of Moving
Sideways, Nonresidential Building
Activity Poised to Resume Recovery in
2014

By Kermit Baker

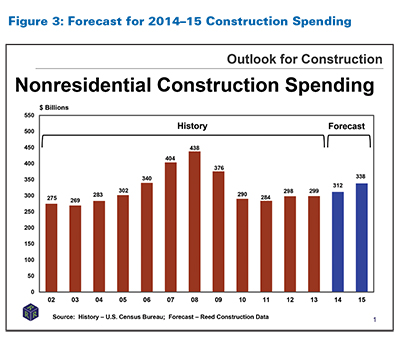
Nonresidential building activity had
a disappointing performance in 2013,
with spending levels largely unchanged
from those of 2012. However, 2014 looks
to be a better year, with building
activity increasing 5.8% overall,
including a double-digit gain for
commercial facilities. The recovery will
continue into 2015, with spending
increasing 8% overall and 6% for
institutional buildings.

These are some of the key findings
from the American Institute of
Architects’ (AIA’s) Consensus
Construction Forecast, conducted in
December 2013. Semiannually, the AIA
compiles results from the leading
national construction forecasters to
develop its consensus. The forecasters
lowered their outlook for 2014 from the
2013 midyear update, which had projected
7.6% growth for the coming year.
However, disruptions in the economy in
the second half of the year stalled the
construction recovery, modestly pushing
back growth rates.

Economy Moves Toward
Stronger Growth

After generating more than 5% growth
in spending in 2012-reversing a steep 4-year decline-nonresidential building
activity was poised to continue its
recovery in 2013. However, a few
roadblocks materialized: The popular
suspects included a federal budget
sequester that scaled back government
spending, a federal government shutdown,
credit restrictions for construction
projects, and rising long-term interest
rates motivated by concern that the Fed
was going to scale back its stimulus.

While all of these factors certainly
played a role in holding back more
building activity, the problem was more
encompassing. The U.S. economy appears
to have grown less than 2% last year,
well below the 2.8% pace of 2012.
Unfortunately, the United States was not
the only laggard. World economic growth
had its worst performance since the 2009
global financial meltdown, garnering
only a 2.9% growth rate, according to
estimates from the International
Monetary Fund (IMF). The economies of
virtually every major region of the
world either declined or saw slower
rates of growth last year, as compared
to 2012. Slower international growth
affected U.S. exports, which, coupled
with ongoing domestic concerns,
discouraged construction activity.

What will change in 2014? The
international economy is expected to
move back to more traditional growth
levels, with world economic growth
expected to increase almost a full
percentage point, according to the IMF.
But there are more improvements on the
horizon closer to home.

Home building is expected to see
strong gains. The slowdown in household
formations during the foreclosure crisis
is expected to reverse, and steady gains
in house prices will bolster confidence
that it is once again safe to buy a
home. The consensus is that housing
starts will increase 25% this year, but
even that pace of growth would only
produce between 1.1 and 1.2 million
starts, well below long-term trends.

Energy is a net positive for the
economic outlook. After decades in which
energy costs were a principal risk
factor to the economy, they have
transformed into a positive benefit. In
recent years, hydraulic fracturing has
dramatically increased domestic
production of both crude oil and natural
gas. As a result, household energy costs
have been trending down for the past 5
years.

The manufacturing sector is strong.
After a steep downturn in production
output during the recession, the
manufacturing sector has come roaring
back. In spite of relatively weak growth
in the overall economy, industrial
production has averaged gains of almost
4% per year over the past 4 years, the
strongest 4-year performance since the
late 1990s. Lower energy costs are a
major factor in making domestic
manufacturing more attractive,
particularly for energy-intensive
industries like steel and chemicals.

Consumer spending is increasing.
Consumer spending for large-ticket
purchases has been one of the bright
spots in the economy in recent years,
having grown 6% or more for each of the
past 4 years. With household wealth
levels now 10% above their pre-recession
high, consumer spending is likely to
continue. Encouragingly, a higher share
of the wealth gain now comes from home
equity, which is more broadly enjoyed
than other forms of wealth.

This is not to say that there will
not be economic challenges moving
forward. The unemployment rate remains
high, and 2013 ended with fewer workers
on payrolls than before the recession.
The United States has a large and
growing federal debt level, a situation
that is likely to be a contentious
political issue as the next debt ceiling
limit approaches in the next few months.
It is still too early to tell how the
economy will respond to the Fed’s
winding down of its bond-buying program.

Construction on a Solid
Footing

With the economy finally
stabilizing, there should be some
substantial improvement in the
construction outlook. Both design
activity at architecture firms and the
fundamentals of the commercial property
market point to healthy growth moving
forward.

Even with a modest dip last November
and December, the AIA’s Architecture
Billings Index (ABI) has risen in the
vast majority of the last 16 months.
With such sustained growth in design
activity, continued improvement in
construction activity will follow suit.
While the residential sector has led the
upturn in the ABI, firms specializing in
the commercial/industrial sector have
reported solid results for most of the
past year. Even firms serving the
institutional sector have generally been
reporting modest levels of growth over
the past year.

In recent months, sunbelt firms have
enjoyed the best business conditions.
These regions tended to be the most
overbuilt prior to the downturn. Now
that growth is returning, markets in
these regions are capturing a
disproportionate share of activity. For
example, a recent analysis of
construction employment growth in metro
areas conducted by AGC using U.S.
Department of Labor data reported that
metro areas in the West accounted for 5
of the top 10 areas in the country in
terms of construction jobs added over
the past year. Three of these top growth
markets were in California. Two
additional growth markets were in the
South. Still, in Boston, New York, and
Minneapolis/St. Paul, which have not
seen much population growth in recent
years, a strong economy has put these 3
in the top 10 in terms of gains in
construction employment over the past
year.

In addition to increased workloads
at architecture firms, indicators from
the construction sector point to
increased activity levels moving
forward. Commercial property values—which declined at a steeper rate
nationally than did house prices during
the recession—have recovered nicely. As
of late 2013, commercial property values
had gained back almost two-thirds of
their losses, according to data from
Moody’s/Real Capital Analytics
Commercial Property Price Index.

Other commercial market indicators
point to strength. Vacancy rates for
offices and retail facilities have been
declining recently, and occupancy rates
at hotels have been increasing. Over the
next 2 years, vacancy rates are expected
to continue to decline for offices and
retail facilities, and rents are
projected to increase, according to a
consensus forecast of industry experts
conducted last October by the Urban Land
Institute. These indicators reflect a
growing demand for commercial space.

Supply Conditions Still a
Concern

In spite of a weak overall recovery
to date, supply conditions for
nonresidential building are unusually
tight. Construction financing remains a
problem. Bank credit standards for
construction and land development loans
have eased modestly, according to the
October Federal Reserve Board Senior
Loan Officer Survey. However, the modest
easing does not offset the sharp
increase in demand for these loans that
many of the loan officers are reporting.

Contractors are having difficulty
finding workers. In spite of a high
unemployment rate among construction
workers, home builders and
nonresidential building contractors
report difficulties filling positions. A
survey by AGC in August found that
almost three-quarters of contractors
reported problems filling at least some
of their craft positions, and over half
were having trouble filling professional
positions. Only 12% of contractors that
were hiring reported no problems filling
positions.

Construction costs are also rising.
In a low-inflation environment with weak
levels of construction activity,
construction costs would be expected to
be stable at worst. However, the U.S.
Department of Labor reported that
producer prices for major nonresidential
building types have risen in the 3 to 4%
range over the past year. Overall
consumer inflation increased by only 1%
over this period, and producer prices
were up only 0.7%. Lumber, plywood, and
gypsum prices were up at a double-digit
pace over this period, with insulation
materials up almost as much.

Building Activity
Resumes

With less of a decline in government
spending, and with healthy fundamental
conditions in the nonresidential
building sector (growing property
values, declining vacancies, and
increasing rents), 2014 should produce
healthy gains in nonresidential building
activity. With spending stronger in the
private side of the economy, the
commercial/industrial building sector is
expected to be resurgent. In 2013, when
overall nonresidential building spending
saw almost no growth, spending on
commercial and industrial facilities
increased about 5%. Growth in this
sector will accelerate this year,
reaching 10%, according to the
consensus forecast panel, and will see
slightly stronger growth in 2015. The
hotel sector is expected to be the
strongest commercial sector this year,
but offices and retail space also should
see healthy gains.

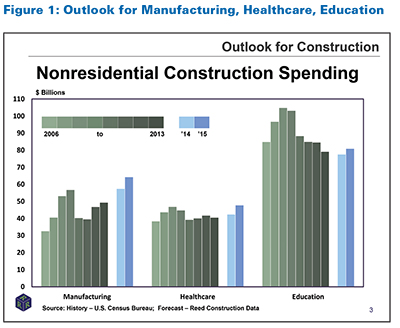
Institutional building lost ground
last year, but 2014 should usher in the
long-awaited institutional building
recovery. Spending gains are expected to
reach 3.4% this year, and accelerate to
6.3% in 2015. Health care is expected to
be one of the stronger institutional
sectors this year and next, but the
education market should also see healthy
gains.


Article reprinted with
permission from AIA’s magazine,
AIArchitect, January 24, 2014 issue,
Vol. 21. This article and AIArchitect
can be accessed online at

www.aia.org/practicing/AIAB101318.

The mechanical insulation industry is continuing to recover from the recent recession. The recovery is slow and varies geographically and by industry segment, but as a whole is continuing steadily. Undoubtedly, our industry is dependent upon the national economy, and while many signs point to sustained moderate growth, several economists are quick to point out just how fragile the economic recovery is. Taking into account a variety of data and expert analyses predicting steady growth, the overarching prognosis might be summarized as: full speed ahead, but proceed with caution. The industry has experienced low to modest single-digit growth for the last couple of years (2012–2013), and 2014 appears to be headed in that same direction. The forecast for 2015 and 2016 are much more optimistic, with the potential for double-digit growth. Again, this varies geographically and by industry segment, and consequently, by company.

The mechanical insulation industry consists of many differently sized companies, with some having multiple branches or sales locations. It is not unusual for various local branches within a company to experience different conditions—one may be up by double digits, while another may complain of business being flat or even down. Such variations are usually impacted by the gain, loss, or completion of a major project; a market share shift; reduction or expansion of backlog; consolidation; a local facility closing or opening; or simply the local economy. One consistent factor among all segments and geographic areas is that the industry remains competitive. It does appear that margins are steady and even trending upward, which is the sign of an improving market.

The recent recession and the recovery road, politics, consolidation, and our industry’s dependency on the national and global economy may provide the most significant opportunities—and simultaneously challenges—in the next few years.

Talent Shortage

Our industry, among others, lost talented people at all levels during the recession. That reduction of available skilled and knowledgeable personnel is problematic, especially in light of the 2015 and 2016 forecasted growth.

Downsizing—or rightsizing, as some prefer to call it—restructuring, consolidation, and attrition have taken and continue to take a toll on sales, administrative, and management levels. While many companies are currently adding bright and talented professionals in those areas, the fact remains that the industry has lost years of experience. That level of experience will take years to replace. There is a significant difference between being in the mechanical insulation industry and truly knowing the mechanical insulation industry.

The new blood, new ideas, and renewed energy emerging in the industry is nothing less than phenomenal. One can only hope the knowledge of more experienced workers is being transferred to the next generation.
The industry is changing, and the challenges change brings can be difficult. Understanding the history of the industry and the lessons learned can make the obstacles of the future less burdensome.

The loss of skilled and experienced project work force personnel is real and cannot be corrected overnight. Regardless of a company’s labor affiliation, investment in training is essential to meet the demands of the future. Many organizations, associations, and companies have excellent training programs, but it takes time to complete those programs. The shortage of skilled craft men and women will only get worse over time without a meaningful and continual commitment
to recruitment and training.

The mechanical insulation industry, at first glance, may not be appealing to younger generations and other novices. Industry should invest now to change that image by reaching out to high schools and trade schools with educational programs and career
path information. We have a great story to tell, and we need to share it. Our industry is competing with other industries for talent; we should act now by implementing recruitment programs before we are left behind.

Trying to gain awareness for the benefits and value of mechanical insulation has been an ongoing, and sometimes arduous, task for our industry. The central problem we face is the lack of sufficient and proper education and awareness as to the design,
installation, and maintenance of mechanical insulation systems.

The need for basic and continuing education at the college, university, and trade school level is a given. If the industry is going to fundamentally change how mechanical insulation is viewed, education at the post-high school level must happen. The enormity
of that challenge is great, but not addressing it is simply not acceptable.

Consolidation

Consolidation is not new to our industry. Companies have been buying and entering into mergers with other companies for years. It is affecting all industry channels: manufacturing, distributing/fabricating, laminating, and contracting. Since private equity’s entrance into the industry, consolidation as a strategy has visibly increased. For decades our industry was not attractive to private equity or public investment, but it has been garnering more interest recently.

This new attention may be due to the fact that the industry is extremely fragmented, presenting an appealing consolidation opportunity. It may also have to do with increasingly attractive growth and investment opportunities, or that insulation manufacturing, distributing/fabricating, laminating, and contracting fits well with implementing a multi-line or multi-craft strategy. Regardless of the motivation, private equity’s investment is a sign that our industry is alluring to those interested in profiting from their investment—we have even seen evidence of private equity purchasing the interest of other private equity companies.

While consolidation can be an exciting opportunity and rewarding to many, it can present challenges to all industry segments and certainly creates individual anxiety. The buying, selling, or merging component is the simple part; the difficult part is the merging of the cultures, implementing new operational and marketing procedures, employing new strategies, and dealing with the challenge of implementing operational synergies that may not be fully realized for months or even years.

Regardless, it is the projected return on investment opportunity that is driving consolidation and that will trump any concerns as to the impact to industry, pro or con. While that may sound cold, it reflects the reality of operating in a public market type environment. A public company is driven by creating shareholder value, and that is no different for private equity other than the fact that their hurdle rates may be higher with a shorter horizon. Private equity interests will always have an exit strategy or strategies concerned with getting the ultimate value out of their investment. This may take the form of a public offering, the sale of the company or components of the company, or a merger, among other options. Whatever the exit method, these new developments will continue to impact the industry.

The following are a few that could be viewed as either opportunities or challenges:

With multi-craft and service offerings, mechanical insulation could be the lesser of the company offerings. The definition of a true “specialty mechanical insulation contractor” could change. Could multi-labor affiliations become more common, or even the norm, in the future?

Traditional local, regional, or even national distributor-fabricator/manufacturer relationships could be put to the test as national consolidators leverage their buying power.

Manufacturers’ distributing/fabricating customer base could be shrinking, changing the dynamic of customer relationships. This could potentially even lead to business models mirroring “big box” business practices.

Will consolidation at some point fuel the drive for new entrants into the contracting and distributing market channels?

Will the consolidators “talk the talk” and “walk the walk” of maintaining traditionally strong industry distributor-contractor customer relationships?

Will consolidators continue to support industry associations to the same or higher levels as the companies they acquired or merged with? Or will consolidation drive association changes?

Consolidation will continue to change and shape all aspects of the industry for years to come. The mechanical insulation industry has been slow to change, but consolidation has the potential to quickly and materially alter many facets of the industry.
Only time will tell the degree and direction of its impact.

Reducing the Industry’s Dependence on the National Economy

The primary driver for our industry will always be the national economy. As the construction (commercial and industrial) industry goes, so goes our industry 6 to 12 months later. That being said, it is possible that with some effort a company can reduce,
though not erase, its dependency on such trends and improve performance during the up and down cycles.

Lessening our industry’s dependence on the national economy requires a straightforward, yet difficult, fix: sales. There are 2 schools of thought regarding selling style. In many cases, sales teams favor electronic communication and even automated
selling. Alternatively, some sales forces favor face-to-face communication and building personal relationships. Perhaps the best option for the industry is to blend these approaches to optimize its methods and increase sales.

Our industry is not alone in its loss of knowledgeable people over the last several years; the specification, engineering, and facility owner/management industries have faced similar losses. While many understand the basic principles of mechanical insulation,
a select number understand the details necessary to successfully design, specify, manage, and provide installation and maintenance inspection for mechanical insulation systems.

It is encouraging to see manufacturers once again putting renewed and expanded effort into specification development. Making this investment for their own benefit simultaneously provides needed education at the specification level. All industry segments
need to help educate those audiences that can directly influence our industry.

The following are some examples of initiatives that could positively impact growth and profitability—especially during the up and down cycles.

Help drive the adoption of ASHRAE 90.1 2010. Every time you see an older version of the ASHRAE standard, point out the difference and simply ask if the interested parties want to use an outdated standard that may be detrimental to the operational and resale value of their facility. The increased cost is minimal compared to the benefit.

Provide information to facility managers and owners on the real risk of not properly maintaining an insulation system. The risk can be substantial compared to the annual operational cost and potential capital investment and production losses in the long term. Too frequently, insulation is damaged or missing, causing energy loss and potentially presenting a safety issue for personnel. Properly maintaining an insulation system is crucial to a facility’s long-term success.

Many take insulation for granted. Educate all parties on the energy savings and environmental benefits of insulation-system performance. The return on investment is attractive from an annual and longer term perspective.

Energy and the environment will always be part of our industry’s economic future. Advocates of increased use of alternative energy sources, increased production, and use of nuclear, fossil fuels, and a long list of similar initiatives seem to be in every publication. Energy efficiency should always be included in those discussions. Our industry needs to resolve to be recognized as a leader in energy efficiency in existing and new construction, retrofit, and maintenance applications.

Fight improper “value engineering” of insulation systems. This is not only detrimental to the project or application in question, but it could allow others to believe such practices are acceptable on other applications.

Help to create and use case studies from actual projects. Specifiers and owners relate to applications that resemble their facility or operational footprint.

Support developing data related to mechanical insulation in the world of sustainability, the energy-water nexus, life-cycle analysis, the numerous and ever-growing “green” programs, etc. The world is heading rapidly in those directions, and the potential of mechanical insulation’s contribution is significant and should not be taken for granted. The more data we have to support the benefits of mechanical insulation, the easier it will be to make an argument for its inclusion in more applications.

Holistic building measurements and performance-based codes continue to gain momentum. The industry has historically operated in a prescriptive environment. Our industry should help support programs that address how prescriptive initiatives can and will work in a holistic world.

Building simulation and energy modeling is also gaining momentum. Mechanical insulation needs to be specifically recognized in those initiatives, and the industry should actively work with coalitions and similar groups in this arena.

It is difficult and time consuming for a contractor to offer “upscale” or alternative approaches when bidding a project. However, it can be a worthwhile time investment when combined with a thorough explanation as to the short- and long-term advantages of a particular approach. The key in many cases is the involvement of the facility owner in the decision process.

The Political Landscape

Politics can be an incredibly divisive topic, particularly given the current atmosphere of partisanship and the lack of meaningful action on Capitol Hill. While it is tempting to just avoid politics, it plays a role in our daily personal and business
lives, so it is important to get involved. Members of our industry should let their Congressional Representatives and Senators know their position on topics, support initiatives they agree with, and make time to vote.

In 2005, the National Insulation Association (NIA) decided to get involved with Capitol Hill to promote the value of mechanical insulation by obtaining incentives and appropriations for educational opportunities and industry advancement. Having never
had an active legislative advocacy program, we were surprised to be met with the reality of the slow pace on Capitol Hill and the difficulty in passing even small measures.

In spite of being a relatively new player, NIA—through its Foundation for Education, Training, and Industry Advancement—has accomplished a great deal with limited resources over the last 8 years. Accomplishments include defining mechanical insulation to new and unaware parties, receiving appropriation dollars through the Department of Energy, introducing tax incentives, testifying before Congressional Committees, successfully having mechanical insulation included in various bills—most recently, in the Farm Bill—attending hundreds of meetings with legislators, and building a network of allied and supportive associations.

With these small victories, we are benefiting both NIA and its members. On Capitol Hill, success comes in small pieces, but by continuing to raise awareness and win support from different allies, we are promoting the long-term growth we need to succeed as an industry. While it can be frustrating to those of us who are aware of the benefits of mechanical insulation not to see all of our initiatives adopted wholesale, we are laying the groundwork to win more and more victories for our industry.

The key to advancing our interests on Capitol Hill is active involvement from NIA’s membership. While it may not always seem to be the case, elected officials listen to the people who vote for them. The more times they hear a message, the more they
listen. This formula applies to federal, state, and local legislators—get involved, and you can make a difference. One call or letter can have a significant effect, and the collaborative action of many is the key to true success. It is time to accelerate our efforts by presenting a united front and working both collectively and individually to advance our goals.

Full Speed Ahead, Cautiously

With steady growth improving the national economy, higher confidence levels in the global economy, increasing bid activity, industry consolidation and investment in the industry continuing, the low interest rate environment, a promising forecast spanning
several years, upward manufacturing trends, energy independence improving, and the forecasted skilled labor shortage, how can you not step on the accelerator?

With that acceleration, however, you must be cautious and able to react quickly to the potential bumps in the road. It is not easy to develop and execute a prudent, profitable, low-risk growth strategy that focuses on long-term earnings without sacrificing
short-term earnings. However, taking no action or being slow to react in a highly competitive industry could carry severe consequences.

There is every reason to be optimistic about the future of the mechanical insulation industry. The respondents in the recent NIA industry survey forecast that overall growth in 2014 would range from 3% to 17%, with an average of 8.9%. Those expectations seem to be reasonably in line with overall commercial and industrial construction market forecasts, and may actually be conservative. Based upon the survey responses, it appears 60% of the growth will come from unit growth and the
balance in dollar growth. In other words, an increase in unit cost, or sale price depending upon your point of view, is expected to represent 40% of the growth expectations. That ratio between unit and dollar growth is good news, since unit growth
is important to sustained growth.

Preliminary indications are that 2015 and 2016 could also see moderate—i.e. middle to high—single-digit growth and forecasted construction starts would support that potential growth.

We will continue to see geographic differences. Some areas and certainly individual companies may enjoy higher growth rates driven by project securement, mix of business, and an array of other unique or localized events, while some companies could experience
a downturn or flat position due to project completion, scheduling, or other factors.

Once again, the industry has responded to and overcome rough economic times, proving our resiliency and making us stronger. The next several years look promising, with numerous and diverse opportunities. We should be defined by how we have taken advantage of these opportunities, and not stymied by the challenges they may create. The mechanical insulation industry for years has been dependent upon the economy, and that dependency will always be a primary influencer. Our industry needs to accept and embrace whatever hand the economy deals us, but we need to influence mechanical insulation’s role in that economy by understanding and aggressively examining the changing market place and addressing the opportunities where we can make adifference.

When a boss calls an employee a “competent person,”
it is not necessarily a compliment—it is a legal obligation.

A competent person is an employee who is able to recognize hazards
associated with a particular task, and has the ability to mitigate those
hazards. Many Occupational Safety and Health Administration (OSHA) construction
standards require someone on site—such as a Foreman, Supervisor, or other
employee—to be designated as a competent person.

However, OSHA does not have a
specific standard regarding a competent person, which has led to some
confusion.

“It’s a fairly misunderstood
term,” said Phil Colleran, a Riverside, Illinois-based Safety Consultant
specializing in construction and a former OSHA Compliance Officer. Some people
may believe they can be considered a competent person because they attended a
class, or a boss arbitrarily assigned the title to them—although neither is
necessarily the case, Colleran stated.

Knowledge and Action

A competent person should not be chosen lightly,
experts say, because he or she needs to be qualified to identify the hazards
associated with a particular operation. For instance, if work is being
performed on scaffolding, the competent person must be knowledgeable about
scaffolding hazards.

This knowledge can come from a
person’s skills, experience, and training, according to Kevin Cannon, Director
of Safety and Health Services with the Associated General Contractors of
America in Arlington, Virginia. Training, which Cannon called key, can provide
the individual with information from particular manufacturers or on various
OSHA standards that will help him or her identify hazards.

Colleran warned against general
“competent person training,” and stressed that fitting the description goes
beyond what is learned in a classroom. “Just because you sat through a 10-hour
course, [that] alone [cannot] determin[e] your competency,” he said.
“Competence is demonstrated, not certified.”

Part of that demonstration
entails the competent person being able to immediately correct any hazards that
may appear. If that person is unable to do so, he or she would not fit the
definition of a competent person, Colleran said.

This is where part of the confusion with the term resides, according to
Cannon. “You can have an employee who’s competent but may lack the authority to
take any corrective action,” he said. “Employers need to make sure the employee
identified as a competent person has such authority granted to them.”

Proper Person

Because many
different types of activities can take place on a worksite, a competent person
must either have the authority to make safety-related changes to those
different operations, or know who can enforce those changes.

For instance, imagine a site where some workers are on a scaffold several
yards downwind from a mason subcontractor performing cutting work. Because the
scaffold workers are being exposed to dust and other potentially hazardous
debris from the masonry work, and the masons are not under direct control of
the competent person for the scaffolding work, the competent person must
mitigate the situation by going to the General Contractor.

A large worksite with different operations going on at the same time also
may require more than 1 competent person, Colleran suggested.

“There is nobody who is all-competent,” he said. “There are many types of
many competent persons based on the fact [that] there are many specialized
activities out there, and you can’t be competent in all fields.”

This does not have to be the case in every situation, however. If an
individual has experience in 2 different types of work being done on
site—trenching and use of ladders, for example—that person could serve as the
competent person for both tasks, Cannon said.

Additionally, a competent person could be somewhat of a generalist,
according to Colleran. This person does not need to know all the ins and outs
of every OSHA standard on the jobsite, but could be considered a competent
person if he or she is able to recognize when something may present a risk to
workers—such as an unguarded platform—and can act when such a risk is
identified.

In some respects, designating a
competent person is similar to instituting a workplace safety and health
program. Both have goals of identifying and mitigating hazards. Cannon believes
that employers who have a competent person working likely have already
implemented some type of injury and illness program.

“If you’re aware of the need
[for] a competent person, it’s not by chance. You understand what your
responsibilities are,” Cannon said.

OSHA Inspection

When OSHA visits
a site, one of the first questions an inspector may ask is who the competent
person is. (If not with those exact words, then by asking who may be in
charge.) The agency inspector may then question that individual about his or
her knowledge to ensure the work being performed is done under the oversight of
a truly “competent” competent person, according to Colleran. The requirement
for being a competent person goes beyond simply designating an individual with
that title, he said.

Colleran suggested employers
ensure all employees have the ability to recognize hazards and the knowledge to
mitigate them. That way, when OSHA comes knocking and asks who the competent
person is, the employer can respond a little differently.

“The logical answer—if the
company was really operating consistently with best practices—would be,
hopefully, ?everyone,'” Colleran said.


SIDEBAR #1

Key Points

  • A competent person needs to not
    only recognize hazards but be in a position to mitigate them.

  • It is possible to have an
    individual who is competent in many tasks, or to have multiple competent people
    for several different tasks.

  • While some experts believe hazard
    training is important, others assert that general “competent person training”
    does not exist.

SIDEBAR #2

Competent Person Versus Qualified
Person

In addition to a competent person, some
OSHA standards mandate the designation of a “qualified person.” Experts are
quick to point out that although the 2 have some similarities, notable
differences exist.

A competent person can identify hazards and has the authority to
mitigate them. According to OSHA, a qualified person must have a “recognized
degree, certificate, etc., or extensive experience and ability to solve the
subject problems”—including possibly technical or engineering knowledge—for a
specific worksite issue.

For example, take a
trenching operation. A competent person must be able to identify hazards within
the operation and solve those issues; a qualified person has the knowledge to
design the protective system in the trench.

According to Mr. Cannon,
it is possible for a single individual to be both a qualified person and a
competent person, but it may not be possible for every situation.

“You
can be both, but you must meet the criteria in the definitions to be both,”
Cannon said. “A competent person may not be a qualified person just because of
the different degree of knowledge and training that’s required” for the latter.