Category Archives: Global

The National Insulation Association Reaches 1,000
Certified Insulation Energy Appraisers!

The National Insulation
Association?s (NIA?s) Foundation for Education, Training, and Industry
Advancement is very excited to announce the certification of the 1,000th
Certified Insulation Energy Appraiser. Glenn Vande Walle with Bay Industries,
Inc. in Milwaukee, Wisconsin, attended an Insulation Energy Appraiser Program (IEAP) training course this fall; by
passing the exam, he became the 1,000th person to become a Certified
Insulation Energy Appraiser!

NIA?s IEAP training
course was developed in 2001 to teach students how to determine the optimal
insulation thickness and corresponding energy and dollar savings for mechanical
insulation projects. The program gives students the information needed to
explain the value of properly installed mechanical insulation systems to
customers.

The IEAP course
curriculum includes instruction in the 3E Plus® insulation thickness
calculation software, how to interview customers, conducting a facility
walk-through, determining the amount of greenhouse gases saved through the use
of insulation, analyzing and completing an appraisal spreadsheet, and preparing
a final report for the customer that outlines this information. Students who
attend the 2-day IEAP training course and pass the exam become Certified
Insulation Energy Appraisers. Their certification is valid for 3 years and
renewed by providing information about appraisals or passing an online exam.

The IEAP training courses have seen increased
interest in recent years. Appraisers are bringing awareness regarding the
economic and environmental value of mechanical insulation to their customers,
with the goal of installing more insulation. Over the past 2 years, 15 training
courses were held in 2011 and 12 classes have been held in 2012.

For additional
information about the IEAP, or to view the list of Certified Insulation Energy
Appraisers, please go to www.insulation.org/training/ieap.

Find an Appraiser
Visit www.insulation.org and
click on ?Find a Certified Insulation Energy Appraiser? on the left side of the
page to locate a trained professional in your area.

Find
out How a Certified Insulation Energy Appraiser Can Save You Money

NIA has more than 400 members who are certified
insulation energy appraisers trained to help you discover the true dollar and
performance value of your facility?s mechanical systems. These professionals
conduct thorough insulation assessments of your facility and can determine the
potential savings and reduction in emission levels you can achieve with the
help of mechanical insulation. You will be amazed at the energy and dollar
savings, and emissions reduction achieved by investing in a properly insulated system.

Stand
out from the Competition: Become a Certified Insulation Energy Appraiser

NIA?s Insulation Energy Appraisal Program will train you
to calculate specific dollar and energy savings
and identify the proper insulation thicknesses required
for customers to achieve maximum return on investment. More than 400 NIA
members have already added the certification to their customer services, so
don?t get left behind.
 For more information
about the 2-day IEAP course and the certification process, visit www.insulation.org/training/ieap.

What Does 2013 Hold in Store for the Construction Industry?

“A goal without a plan is just a wish.” – Antoine de Saint-Exupéry

With the economic challenges faced over the past few years, uncertainty over the effects of the November elections, and the threat of the “fiscal cliff” looming, the end of 2012 left many of us with the sense that while we may not like where we are at the moment, we are glad to have the last year behind us and look forward to the future. The quote from author and pilot Antoine de Saint-Exupéry is empowering, as it focuses us on taking action and preparing to achieve our objectives, rather than passively hoping things will fall into place for us. To help you actualize your goals in 2013, NIA reached out to sources in other industry organizations and compiled this report of expert opinions on the state of the market today and forecasts for the new year. Where are the challenges, and where can you see opportunities? We hope you will be able to use this information as you hone your business strategies for 2013.

The Current Construction Market Analysis

October Construction Falls 14 Percent

The value of new construction starts retreated 14% in October to a seasonally adjusted annual rate of $434.9 billion, according to McGraw-Hill Construction, a division of the McGraw-Hill Companies. Much of the decline was due to a sharp pullback by the electric power and gas plant category after a robust September. If this volatile project type is excluded from the month-to-month comparisons, total construction starts in October would register a 3% gain. Greater activity was reported in October for the public works sector, while both nonresidential building and housing settled back. Through the first 10 months of 2012, total construction starts on an unadjusted basis came in at $390.4 billion, a 4% gain relative to the same period a year ago.

The October statistics brought the Dodge Index to 92 (2000=100), down from the 107 reported for September. Over the first 10 months of 2012, the Dodge Index fluctuated within the range of 85 to 116, averaging 97 during this period. “This year’s pattern for total construction has been shaped to some degree by the swings for the electric utility and gas plant category, which is still on track to achieve a new annual high in current dollar terms, even with its weak October performance,” stated Robert A. Murray, vice president of economic affairs for McGraw-Hill Construction. “Leaving out electric utilities and gas plants, the amount of construction starts in 2012 would be up 3% through the first ten months, which reflects a mixed pattern by project type. For housing, the emerging recovery for single family housing is joining the strengthening trend for multifamily housing that’s already underway. For nonresidential building, commercial building is seeing modest growth in 2012, but this has been offset by declines for institutional building and manufacturing plant construction. Public works year-to-date has been basically flat, beginning to stabilize after its 14% downturn in 2011. While the pattern of overall construction activity does seem to be moving towards more broad-based expansion, the persistent uncertainty affecting the U.S. economy continues to pose a downside risk. The degree to which policymakers in Washington, D.C. are able to agree on the steps necessary to avert the fiscal cliff will determine whether the nascent upturn for construction continues to grow in 2013 or slides back.”

Nonbuilding construction in October dropped 32% to $133.4 billion (annual rate), retreating after the prior month’s 68% jump. September had been lifted by a 335% surge for the electric utility and gas plant category, as a $4.8 billion liquefied natural gas plant (the Sabine Pass Liquefaction Project) was included as a September start, along with six power plant and transmission line projects valued each in excess of $100 million. For October, the largest electric utility and gas plant project was $88 million for transmission line work in Massachusetts, contributing to a 93% decline for the category.  In contrast, the public works sector in October climbed 19%. The miscellaneous public works category, which includes such diverse project types as site work, mass transit, and pipelines, soared 52% in October.  The boost to miscellaneous public works came from $2.0 billion related to work on the Keystone Pipeline Gulf Coast Expansion, located in Oklahoma and Texas. The large increase marked a departure from what has been a declining trend in 2012 for highway construction, which on a year-to-date basis was still down 11%. Sewers and water supply systems dropped a respective 16% and 5% in October.

Nonresidential building, at $131.6 billion (annual rate), decreased 4% in October. The manufacturing plant category plunged 73%, continuing to pull back from the improved activity that was reported earlier in 2012. Murray noted, “As the result of the uncertainty created by the looming fiscal cliff, manufacturers have increasingly held back on investment as 2012 has progressed.” Warehouse construction also weakened substantially in October, falling 33%. Office construction in October slipped 3%, although the month did include the start of several noteworthy projects?the $216 million Tower at PNC Plaza in Pittsburgh, PA, the $110 million Energy Center III office tower in Houston, TX, a $76 million municipal office building in Boston, MA, and a $50 million corporate headquarters renovation for TJX in Marlborough, MA. On the plus side, hotel construction in October grew 7%, helped by the start of a $189 million hotel in Austin TX. Store construction also registered a gain in October, rising 3% with the help of the $101 million retail portion of the $250 million City Point Residential Retail Development Project (Phase 2) in Brooklyn, NY.

On the institutional side, the educational facilities category continued to lose momentum, dropping 3%. Even with the decline, several large education projects reached groundbreaking in October, including a $95 million facility for the University of Tennessee in Knoxville, as well as two large high school projects in Massachusetts. More considerable October declines were registered by amusement-related work, down 22%; and transportation terminals, down 50%. The public buildings category posted a large October gain, climbing 92% due to the start of a $524 million military facility at Offutt Air Force Base in Nebraska. Healthcare facilities also registered a large October gain, advancing 37% with the help of five hospital projects valued each in excess of $100 million. These hospital projects were located in Virginia ($215 million), Iowa ($150 million), Florida ($111 million), North Carolina ($104 million) and Ohio ($102 million). Church construction in October edged up 1%, although activity continues to be very depressed.

Residential building in October dropped 2% to $169.9 billion (annual rate). The downward pull came from multifamily housing, which retreated 7% from September. During 2012, multifamily housing  fluctuated around an upward trend, and the pace for multifamily housing in October was still 23% above the level reported at the start of the year.  Large multifamily projects that reached groundbreaking in October included the $200 million Insignia Residential Towers in Seattle, WA and $149 million for the multifamily portion of the City Point project in Brooklyn, NY. Single-family housing in October was unchanged from September, maintaining the enhanced activity established over the course of 2012. The October single-family amount was up 25% from the level reported at the start of the year, and this project type had earlier shown gains in seven of the nine preceding months. During the January?October period of 2012, the regional pattern for single family housing showed the largest increase in the West, up 39%; followed by the Midwest, up 28%; the South Atlantic, up 26%; the South Central, up 22%; and the Northeast, up 14%.

The 4% pickup for total construction on an unadjusted basis during the first ten months of 2012 was the result of increases for two of the three main construction groups.  Residential building advanced 28%, with year-to-date gains of 27% for single family housing and 30% for multifamily housing. Nonbuilding construction grew 3% year-to-date, the result of combining an 11% increase for the electric utility and gas plant category and “no change” for public works. Nonresidential building continued to be the one major construction group to register a year-to-date decline, falling 14%. The nonresidential building decline was due to this behavior by segment?commercial building, up 2%; institutional building, down 15%; and manufacturing building, down 47%. To a large extent, the nonresidential building decline in dollar terms comes from the comparison to several massive projects that reached groundbreaking during the first 10 months of 2011, including a $3.0 billion coal-to-gasoline plant in West Virginia, a $1.5 billion semiconductor plant in
Arizona, a $1.2 billion airport terminal in New York, and a $1.1 billion government data center in Utah.  On a square footage basis, nonresidential building in the first 10 months of 2012 was up 1% compared to a year ago.

By geography, total construction starts during the January?October period of 2012 showed a large gain for the South Atlantic, up 24%, with much of the upward push coming from the start of two massive nuclear power projects in Georgia and South Carolina. If these two projects are excluded, then total construction starts in the South Atlantic would be up only 1%. Year-to-date gains for total construction were also reported for the Midwest, up 6%; and the South Central, up 5%. Year-to-date declines for total construction were reported for the Northeast, down 6%; and the West, down 8%.

For more than a century, McGraw-Hill Construction has
remained North America’s leading provider of project and product information;
plans and specifications; and industry news, trends, and forecasts. To learn
more, visit www.construction.com
.


The 2013 Construction Market Forecast

FMI Releases Q3-2012 Construction Outlook Report

“Contrary to election-year rhetoric, the economy is inching its way to improvement, and the construction industry has not stopped working,” according to the third quarter 2012 Construction Outlook report by FMI, the largest provider of management consulting and investment banking to the engineering and construction industry. Released in December, the industry forecast is calling for an 8% increase in total construction put in place for 2013. Contributing to this positive forecast is more robust growth in residential construction, as well as a few strong markets in nonresidential and non-building construction.

The focus for 2013 will be on the movement of private money back into the markets. For the economy to grow at a faster rate, with the fiscal cliff looming and state and municipal budgets still in repair mode, it will be the private markets that must lead the way. Total construction put in place for 2013 is forecast to be $892 billion, a solid improvement over the last few years, but still just edging out 2003 levels of construction activity.

Health care construction will see a solid recovery, along with power construction. Both markets are expected to grow by 8% in 2013. Lodging, office, educational, and commercial markets will continue to struggle to get out of the doldrums. However, growth for all will be in line with or ahead of expected Gross Domestic Product (GDP) growth.

Residential construction housing starts rose to 603,000 units a year as of September 2012. Single-family permits also rose to a 545,000-unit pace, or 6.7%, returning to levels not seen since July 2008.

Nonresidential Construction Trends and Forecasts by Sector

  • Lodging: Hotel developers will renovate before building new properties. Bank loans will be hard to justify until occupancy and room rates remain consistently high.
  • Office: Through the first 2 quarters of 2012, the U.S. office sector absorbed 10.4 million square feet, 100,000 square feet less of net absorption than was generated over the first 6 months of 2011. (Source: Jones Lang LaSalle, “Office Outlook United States, Q2 2012”). This is not yet enough activity to compare with prerecession highs, but we expect Construction Put in Place (CPIP) to improve 4% in 2013.
  • Commercial: Expect more rethinking of commercial construction space to accommodate smaller stores and combining in-store sales with online shopping. Look for increasing multiuse projects.
  • Health care: New health care construction will include a growing number of renovation projects to update current facilities for modern hospital design, using more technology in the rooms as well as for improving air quality and reducing energy usage.
  • Religious: The lending environment continues to be a challenge for many congregations.
  • Public safety?Despite overcrowding in prisons, we expect public safety construction to remain slow
    for the next couple of years, at least with only 1% growth in 2013 to $10.2 billion.
  • Transportation: This remains a strong sector for construction. CPIP is expected to grow 6% in 2013 to a total of $38.2 billion for the year. This is due in part to The FAA Modernization and Reform Act, which will provide $63.6 billion for the agency’s programs between 2012?2015.
  • Manufacturing: Manufacturing construction is starting to make a comeback with both new growth in manufacturing output and with some companies repatriating their manufacturing capacity.
  • Power-related: Power construction will continue to be one of the strongest growth sectors for construction. Worthy to note: The U.S. Army Corps of Engineers has a proposal out for $7 billion in locally generated renewable energy through power purchase agreements.
  • Sewage and waste disposal: Waste-to-energy may be one of the best bets for future work in this sector if more municipalities can find ways to work with private investors.
  • Water supply: Expect this sector to struggle to find funds for necessary remediation and construction. Strength in water supply construction will be found in pockets for industrial projects like the mining sector, power, and industrial plants.
  • Conservation and development: The 2012 annual budget for the Department of Agriculture eliminates funding for the Resource Conservation and Development (RC&D) and Watershed and Flood Prevention Operations programs. New projects in this sector, like water system projects, will likely come from cleanup for the mining and energy sector to comply with regulations.

For more information, contact Sarah Avallone at 919-785-9221 or savallone@fminet.com.

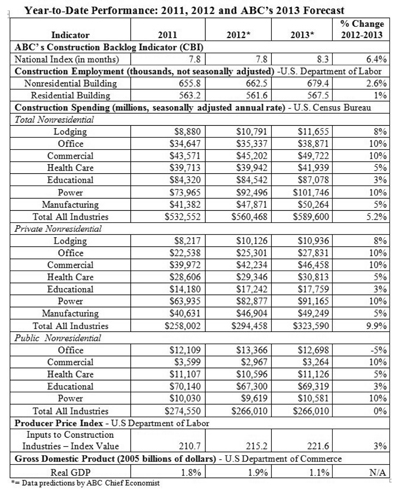
ABC Predicts Moderate Construction Recovery Will Continue in 2013

Associated Builders and Contractors (ABC) released its 2013 economic forecast for the U.S. commercial and industrial construction industry, and it shows the continuation of a modest recovery for nonresidential construction next year.

“ABC predicts nonresidential construction spending will expand 5.2% in 2013,” said ABC chief economist Anirban Basu. “Given the remarkably deep reductions in nonresidential construction spending since the onset of the downturn, one would expect more robust growth during the fourth year of broader economic recovery.

“Thanks to a handful of segments experiencing more rapid economic recovery, much of the construction expansion next year will be in categories heavily associated with private financing,” Basu said. “Due largely to constrained capital budgets at state and local government levels, as well as ongoing turmoil in Washington, D.C., publicly funded construction spending is expected to be flat next year, and perhaps worse.

“The fastest growing major U.S. industry during the last year in terms of absolute job creation was professional and business services,” said Basu. Because many firms in this category use office space, office-related construction spending is expected to rise 10% in 2013.

“Consumer confidence also has progressed,” Basu said. “Accordingly, ABC predicts total commercial construction will expand roughly 10% next year. Other industries positioned to experience rising levels of investment include power, up 10%; lodging, up 8%; health care, up 5%; and manufacturing, up 5%.

“Nonresidential building construction employment is expected to expand 2.1% in 2013, slightly better than the 1% performance estimated for 2012,” said Basu. “Construction materials prices should rise a bit more rapidly in 2013 than they did in 2012, with substantially more volatility to be experienced from month to month next year.

“Despite ongoing slowdown in many of the world’s largest economies, ABC anticipates many investors will opt to invest in hard assets as a way to avoid volatility in equity and bond markets,” Basu added.

ABC’s Conclusion

“Whether or not the nation falls off its fiscal cliff?a collection of spending cuts and tax increases that kick in at the end of the year?certain taxes likely are headed higher,” said Basu. “ABC predicts higher marginal income tax rates to reach pre-Bush levels, as well as an increase in tax rates on capital gains and dividend income. In addition, ABC expects the payroll tax credit to sunset in the first quarter of 2013.

“The U.S. economy is presently expanding at a 2% rate,” said Basu. “Even in the absence of a dive off the federal precipice, the nation will struggle to achieve 2% growth next year as certain tax rates rise and as federal spending growth slows and perhaps turns sharply negative. 

“GDP has expanded for 13 consecutive quarters,” Basu said. “ABC’s forecast for GDP growth next year is between 1%-2%. If the nation falls off its fiscal cliff, recession will follow, with GDP falling between 2% and 3% for the year.

“With the elections now behind us, the hope is the White House and Congress will be able to successfully navigate the nation past its fiscal cliff,” Basu said. “If that happens, the latter half of 2013 could be surprisingly good for nonresidential activity given the large volume of construction projects that were put on hold during the course of 2012. However, the baseline forecast calls for only moderate expansion in nonresidential construction spending next year.”

Associated Builders and Contractors (ABC) is a national association with 74 chapters representing merit shop construction and construction-related firms with nearly two million employees. Visit them at www.abc.org.

McGraw Hill’s 2013

Dodge Construction Outlook

After the steep decline of 2007?2009, the construction industry has shown a few glimmers of recovery, but overall there’s not yet been sufficient traction to say that renewed expansion has taken hold. As reported by McGraw-Hill Construction, new construction starts in 2010 edged up 2%, followed by another 1% gain in 2011; and the current year is headed for a 5% increase to $458 billion. This still leaves the volume of total construction starts 32% below the 2005 peak on a current dollar basis, and down about 50% when viewed on a constant dollar basis. The modest gains experienced during the past 2 years have in effect produced an extended bottom for construction starts, in which the process of recovery is being stretched out.

The pattern of construction starts seems to be in a “balancing act,” where gains for a few project types are offset by declines for other project types. The upturn for multifamily housing has been joined in 2012 by a strengthening single-family market. Several commercial project types, notably hotels and warehouses, have picked up the pace; and electric utility construction will reach a new record high. However, the institutional building sector has weakened considerably during 2012, adversely affected by tight federal, state, and local budgets; while public works construction has experienced further erosion.

The backdrop for the construction industry remains the fragile U.S. economy. Real GDP in the second quarter of 2012 grew just 1.3%, and for all of 2012 the GDP increase is estimated at 2.1%. The employment statistics have reflected this hesitation, as growth in the second quarter fell to just 67,000 jobs per month, before bouncing back in the third quarter to 146,000 jobs per month. The main obstacle to stronger growth for the U.S. economy is the pervasive sense of uncertainty, which has dampened business investment and hiring. Earlier in 2012, at least some of this uncertainty was related to concerns over the potential spread of the European debt crisis, but by midyear the anxiety about the impending “fiscal cliff” (the expiring tax cuts, combined with reduced federal spending) became dominant. Along with the uncertainty created by the 2012 presidential election, many firms have placed plans for investment on hold.

The fiscal cliff poses a significant downside risk to the near-term prospects for the U.S. economy and the construction industry. In May, the Congressional Budget Office warned that allowing existing policies to take effect in early 2013 could cause the U.S. economy to slide 1.3% during the first half of 2013. For the purpose of this forecast, it is assumed that policymakers will be able to reach agreement in early 2013 to soften the impact of the spending cuts as well as maintain some of the Bush-era tax cuts. The U.S. economy will be shaky at the outset of 2013, but it is hoped that efforts to cushion the fiscal cliff will allow some of the uncertainty to diminish. Real GDP growth for all of 2013 will still be a tepid 2.2%, but the economy should improve after a weak start to the year.

A U.S. economy that avoids recession in early 2013 will allow several positive factors to benefit construction. Interest rates are very low, and lending standards for commercial real estate loans are easing. Significantly, market fundamentals for several project types are strengthening. This includes rent growth for multifamily housing, increases in revenue per available room for hotels, and retreating vacancy rates for warehouses and offices. In this environment, it is forecast that new construction starts for 2013 will climb 6% to $484 billion, a rate of growth not much different than the 5% gain estimated for 2012. The following are the main points, by sector, for the 2013 construction market:

  • Multifamily housing will rise 16% in dollars and 14% in units, marking healthy percentage gains, yet slower growth than what took place during 2011 and 2012. Improved market fundamentals will help to justify new construction, and this structure type continues to be viewed favorably by the real estate finance community.
  • Commercial building will increase 12%, a slightly faster pace than the 5% gain estimated for 2012. Both warehouses and hotels will benefit from lower vacancy rates, while store construction will feature more upgrades to existing space and the derived lift coming from gains for single-family housing. The increase for office construction will be modest, as new privately financed projects continue to be scrutinized carefully by lenders. Next year’s level of commercial building in current dollars will still be more than 40% below the 2007 peak.
  • Institutional building will level off, following the steep 13% drop estimated for 2012. For educational facilities, K-12 construction will slip further, while college and university construction should at least stabilize. Health care facilities are expected to make a modest rebound after this year’s downturn.
  • The manufacturing building category will grow 8%, showing improvement after its 2012 decline.
  • Public works construction will slide an additional 1%, as federal spending cuts in particular restrain environmental projects. The new 2 year federal transportation bill should help to limit the impact of spending cuts on highways and bridges.
  • Electric utility construction will drop 31%, after reaching a record high in current dollars during 2012. This year was boosted by the start of two very large nuclear power plants, and projects of similar magnitude are not expected for 2013. The expiration of federal loan guarantees for renewable energy projects would also dampen construction in 2013.

For more than a century, McGraw-Hill Construction has remained North America’s leading provider of project and product information; plans and specifications; and industry news, trends, and forecasts. To learn more, visit www.construction.com.

Conclusion

The companies who will succeed in 2013 and beyond will be those who effectively process the lessons of the past, adapting and targeting their efforts based on current and forecasted market conditions. Information and education are key to ensuring that goals are realistic and the path to reach them is well considered, built on a solid foundation of understanding. While conditions will evolve?historic storms will hit, or other events will catch us off guard?one thing is certain: As Benjamin Franklin noted, “By failing to prepare, you are preparing to fail.”

2012 has ended, and for
most of you that means the end of your fiscal year as well. Don’t start the new
year without successfully wrapping up your 2012 business affairs. Here is a
handy checklist of some things you need to consider.

  • If not already conducted, schedule your annual corporate
    meetings for shareholders and directors. Give notice in accordance with your
    bylaws/code of regulations, and set the agenda for the meeting

  • Review your corporate minute book to make sure it is up to
    date: Are last year’s minutes in there, and are they
    signed? Did the minutes call for certain actions to be taken during the year,
    and have these items been accomplished? Do the minutes ratify corporate
    actions, such as contributions to benefit plans, borrowing, auto leasing, and
    monetary distributions?

  • Have there been any changes in the officers, directors, or
    shareholders? Do the corporate records reflect those changes? Do others need to
    be elected?

  • Are there shares of stock needing to be transferred or
    canceled? Is your share ledger in the back of the minute book up to date?

  • Is the statutory agent designated to receive important papers
    current and on file with the Secretary of State? Check the state’s website.

  • Is your corporation in good standing with the state? Check
    the state’s website.

  • Is the corporation doing business in any other states? Is it
    appropriately registered and meeting the requirements to do business in those
    states?

  • Has the annual financial report?including a balance sheet,
    statement of profit and loss and surplus, and an opinion of the financial
    position of the corporation?been prepared?

  • Do the corporate records verify payments of salaries versus
    bonuses and dividends? The Internal Revenue Service can contend that payments
    to corporate officers, employees, or shareholders are not deductible dividends;
    and that payments to officers who are not shareholders are not deductible.
    Assure the proper classification of such payments by identifying the payments
    as deductible compensation and consider identifying the justification.

  • If no, or nominal, dividends are to be paid and your
    corporation has a large amount of accumulated earnings, do the minutes include
    a statement of the reasons why the earnings are being retained?

  • Have you changed financial institutions during the year and
    not noted it within the corporate records? Are those who are authorized to sign
    checks still the appropriate names, and are the appropriate corporate
    resolutions contained within the minute book?

  • Have there been loans to officers or
    shareholders that need to be documented by minutes and promissory notes?

  • Do you have a buy/sell agreement that regulates and restricts
    the transfer of shares so you don’t end up with an unwanted “business partner?”
    Have you updated the valuation information that sets the price for which shares
    are repurchased? Has the buy/sell agreement been amended to include new
    shareholders?

  • Are your benefit plans?such as retirement, profit sharing,
    medical reimbursement, Section 125 or 401(k) plan?appropriately documented
    within the corporate records and in full compliance with the law? Are the
    summary plan descriptions you give to employees up to date? Are you
    strategizing about the impact of the Patient Protection and Affordable Care
    Act?

  • Have you consulted with your Certified Public Accountant
    regarding year-end matters and anticipated 2013 financial matters?

  • Have you evaluated the cost of your Workers’ Compensation
    Program? Have you shopped for enrolment in a workers’ compensation group that
    provides good savings (discounts) and effective third-party administration?
    Have you gone online and looked at your claims history to identify your major
    claims? Have you met with your workers’ compensation attorney to devise a plan
    to eliminate costly claims from your experience and reduce your premiums?

  • For those key employees hired in 2012, do you have employment
    agreements in place addressing such things as non-disclosure of confidential
    information and non-competition? It’s not too late.

  • Have you reviewed your general liability insurance and other
    business coverages with your agent to ensure proper, cost-effective coverage?

  • Are your licenses to do business in
    various locales current?

  • Have you reviewed the exempt and non-exempt wage-hour status
    of your employees to ensure wages and applicable overtime are being paid
    properly and records maintained appropriately?

  • Your personnel policies and practices may require
    modification due to recent National Labor Relations Board decisions applicable
    to non-union employers. Is your employee handbook up to date?

  • Remember to run the numbers on your Occupational Safety and
    Health Administration (OSHA) Form 300 logs and prepare Form 300A for posting.

Dust off those corporate records and make sure that
everything is ready for the new year. 

Powerful “super storm”
Hurricane Sandy literally destroyed parts of New York, New Jersey, and other
areas along the East Coast. According to the Construction Claims Advisor,
“Estimates of the economic losses caused by Hurricane Sandy recently reached
$50 billion after experts assessed the costs of severe property damage,
shut-down subways and power outages. Hurricane Sandy’s recent devastation along
much of the East Coast is a reminder of the significant factor weather can
contribute to the planning and execution of a construction project.” Other
estimates put the losses and cost of repairs in just the two states of New York
and New Jersey between $50-$65 billion.

The National Insulation Association (NIA) contacted all of
our manufacturing members to see if they could offer any advice on what to do
with insulation materials in the areas damaged by Hurricane Sandy. As some
members noted, providing a blanket response for the replacement of insulation
is difficult, as these situations are better assessed on a case-by-case basis.
The best advice is to always use caution when handling any construction
materials, and contact the original manufacturer and mechanical insulation
experts to get answers specific to your situation. The damage done by Sandy is
extensive, leaving contaminates in many buildings, facilities, and homes, going
far beyond ruining insulation and building materials. Trying to save money by
salvaging damaged goods may have dire future consequences that are presently
unknown.

NIA would like to thank the
respondents, whose valuable feedback contributed to this article: Allen Dickey
at Pittsburgh Corning; Tony Garone at Polyguard Products, Inc.; Matt Hair at
K-FLEX USA, LLC; Gordon Hart, representing Auburn Manufacturing, Inc.; Betty
Hartman at Evonik Foams, Inc.; and Mike Resetar at Armacell. The following are
some of their responses to our questions.

1. What type of insulation does your company make?

  • Allen Dickey (AD) at Pittsburgh Corning: Closed-cell cellular
    glass

  • Jake Erickson (JE) at Roxul, Inc.: Stone
    wool insulation

  • Tony Garone (TG) at Polyguard Products, Inc.: Adhesives, pipe
    insulation support systems, tapes, jacketing and flexible facings, protective
    coatings, and sealants

  • Matt Hair (MH) at K-FLEX USA: Closed-cell flexible
    elastomeric foam

  • Gordon Hart (GH), representing Auburn Manufacturing, Inc.:
    Insulation blanket; tapes; jacketing and facings; fitting covers and fitting
    insulation; pads and covers; prefabricated insulation panels;
    removable/reusable blankets

  • Betty Hartman (BH) at Evonik Foams, Inc.: Polyimide foam
    product

  • Mike Resetar (MR) at Armacell: Closed-cell flexible
    elastomeric foam

2. What would your advice be to contractors working in the
aftermath of Sandy? How do you suggest handling the mechanical insulation
products?

  • AD: Worker safety is extremely important. Make sure your
    immunizations are up to date and wear protective clothing. Dispose of all
    materials that are contaminated with salt water, and all wet insulation
    materials that cannot be dried out.

  • JE: [When rebuilding,] there is an
    opportunity to build with sustainable materials that add comfort to the
    interior environment. Contractors can differentiate themselves by building
    something special versus just the way it used to be. You can insulate with
    sustainable materials that contribute to LEED credits and improve building
    performance. You can identify products that can contribute to the entire
    mechanical system.

  • MH: Contractors should take safety precautions when working
    in areas affected by Sandy and should contact K-FLEX directly to address
    elastomeric insulation maintenance, repair, or replacement questions.  In
    general, elastomeric insulation can be handled without risk of personnel safety
    concerns and can be disposed of in a landfill.

  • MR: Any insulation that was wet from the storm needs to be
    removed from the piping, the pipe needs to be wiped clean and dry, and new
    insulation must be installed.

3. Can your product be dried out and reused in the insulation
system?

  • AD: In many cases, yes, assuming it is only wet from rain or
    freshwater and not contaminated with salt water or any other contaminants.

  • JE: Most stone wool products can be dried and reused if they
    become saturated with clean water. Due to the dimensional stability and
    rigidity of stone wool, the material does not sag or lose its insulating value
    after exposure to moisture.

  • MH: Given the number of variables in this type of natural
    disaster, (salt water, full product immersion, high winds) contractors should
    contact K-FLEX directly to address insulation replacement on a case-by-case
    basis.

  • GH: Yes, if the product has not been contaminated with salt
    water.

  • BH: Yes, if the water has not been contaminated.

  • MR: No. There is great concern for the sea water and
    contaminates trapped under the insulation, which could damage the pipe long
    after the storm damage is cleared.

4. Does your product need to be replaced with clean, new
product?

  • AD: If the system is breached and the insulation is wet from
    storm surge (salt water) flooding or contaminated with chemicals that may have
    been released as a result of the storm then the insulation must be replaced. If
    the system, upon inspection, is still intact and sealed, then there is no need
    for replacement.

  • JE: It is recommended that you replace the insulation if it
    has been exposed to contaminants or pollutants.

  • TG: Polyguard’s products are typically used on rooftop duct
    work and piping as weather protection for the insulation. If flooding reached
    the rooftop of the building, there’s a good chance the building was totally
    destroyed. Wind-driven rain could have penetrated the system and caused
    insulation to become saturated. If that is the case, the wet insulation should
    be replaced. Since Polyguard’s products adhere directly to the insulation, they
    would need replacement as well.

  • MH: If the insulation system has been damaged or
    contaminated, the product should be replaced and the piping should be cleaned
    before the replacement insulation is installed. [Note that] damage to the
    insulation can also be caused by high wind or flying debris, especially any
    insulation outside or on a roof top, so those areas should be evaluated as
    well.

  • GH: Yes, if the product has been contaminated with salt
    water, it should be replaced.

  • BH: It should be replaced if the product is damaged or
    contaminated.

  • MR: Yes.

5. What are the reasons that the product can stay or needs to
be replaced?

  • AD: Salt or contaminated water intrusion into the insulation
    system can create the potential for corrosion under the insulation. This would
    be the most immediate reason for system replacement.

  • JE: Stone wool can be reused because it is organic and does
    not promote mold growth. It retains its rigidity and performance even after it
    has been exposed to moisture. It is also permeable so vapor can pass through
    the product.

  • MH: The need to replace product would depend on the extent of
    damage, so contractors should contact K-FLEX directly to address insulation
    replacement on a case-by-case basis. For example, damage caused by full and
    extended immersion in water would warrant product replacement. [There also may
    be] damage to insulation that may have been in inventory or on a job site.

  • MR: Concerns about the sea water and other contaminates in
    the water that will be trapped under the insulation [need to be considered].

6. For insulation, do you have any advice or product removal
or installation suggestions?

  • AD: Our MSDS [Material Safety Data Sheet] covers handling and
    disposal. Installation recommendations are application specific and are
    available on request.

  • MH: Contractors should follow the best practices for
    installing elastomeric insulation. Two good sources for this are a
    comprehensive “Installation Guide” available at www.kflexusa.com and
    ASTM C1710, Installation of Flexible Closed Cell Preformed Insulation in
    Tube and Sheet Form
    .

  • GH: There are no special removal instructions, but the pipe,
    which has been contaminated with salt water, should be cleaned off with tap
    water and allowed to dry prior to being re-insulated.

7. Do you have any health and safety advice or suggestions?

  • AD: Consult the MSDS for materials involved and use
    appropriate safety procedures prior to handling any product.

  • MH: Contractors should contact the manufacturer of all
    insulation types for specific health and safety concerns. In general, elastomeric insulation does not pose safety hazards.

8. Has your company appointed a hazard, environmental
engineer, or other contact person for contractors who have related product
questions?

  • AD: Contact our Technical Support Group or me (Allen Dickey)
    at Pittsburgh Corning.

  • MH: Yes, contractors can reach K-FLEX Technical Support at
    800-765-6475.

  • GH: Yes. You can
    contact me at
    gordon.hart@artekengineering.com.

NIA manufacturer members had additional
recommendations, including Allen Dickey’s (Pittsburgh Corning) observation that
consideration of the need for replacement extends to building envelope
insulation, as well as other materials besides insulation. Matt Hair (K-FLEX
USA) added that damage to the insulation jacket would warrant a look at the
insulation even if damage is not readily visible from the outside. If the
jacket is compromised, the insulation probably is also, and needs to be
replaced. Gordon Hart (Auburn Manufacturing, Inc.) commented that he would
assume most “flooded insulation materials have been contaminated by salt
(sodium chloride), a highly corrosive chemical to steel and other metals.” He
“would recommend that all such contaminated insulation materials be removed and
discarded, as soon as possible, and the contaminated pipe and equipment first
sprayed with high pressure fresh water prior to their being reinsulated.”

In the aftermath of the hurricane, it was universally
noted how people came together to help one another. NIA is pleased to provide a
forum for our members to share their expertise and pass along information to
support all who may have been impacted by the storm. Please contact your
mechanical insulation expert for suggestions on product replacements, or visit www.insulation.org.

High-Temperature Fiber

High-temperature fiber insulations are fibrous
insulations, varying
in flexibility, density,
and composition, with or without binders. These insulation products are
available in flat sheets, rolls, boards, or loose fibers. The insulation products
are used as the thermal insulation component in the fabrication of insulation
systems for use at temperatures up to 3,000°F.

This
category of products is composed of Refractory Ceramic Fibers (RCF), including
a recently developed class generally referred to as Alkaline Earth Silicates
(AES). These AES fibers are designed to be bio-soluble (i.e., they have
enhanced in-vitro solubility characteristics that enable these products to meet
European regulatory requirements [Directive 97/69/EC] for man-made vitreous
fibers).

The
RCF products in mat and blanket form are covered in ASTM C892. Products are
classified into five types (by maximum use temperature) and five grades (by
density).

The
standard contains requirements for thermal conductivity, density, maximum use
temperature, non-fibrous (shot) content, linear shrinkage, and tensile
strength. For comparison purposes, the maximum thermal conductivity of Grade 3
material is 0.66 Btu?in/(hr?ft²?°F) at 400°F. It should be noted that not all
manufacturers of high-temperature fiber products utilize the ASTM C 892
standard for their products.

High-temperature
insulation products are often used as an alternative to fire resistance-rated shaft
enclosures. Applications include kitchen exhaust grease ducts, ventilation
ducts, stairwell pressurization ducts, smoke extraction, chemical fume exhaust
ducts, and refuse and trash chutes. They may be used to cover plastic pipe and
cables to limit flame spread and smoke generation in fire-rated air plenums.
These insulation systems are listed and labeled by nationally recognized
laboratories.

Pneumatically
applied high-temperature fibers are typically used on applications where it
would be difficult to adhere blankets to a surface. These typically are
internal surfaces, such as furnace interiors, or outer surfaces that are
convoluted and/or difficult to access, such as boiler tube walls on a
coal-fired furnace. While they are not yet covered by an industry
specification, an ASTM specification is in development.

The
composition can be described as follows: The basic types of materials are
loose, inorganic fibers (either RCF or AES) combined with a liquid, water-based
chemical binder. The fibers are made from mineral substances such as silica,
alumina, calcium, and magnesium processed from the molten state into fibrous
form. The liquid binder is made from inorganic materials: water, colloidal
silica, and less than 2% of an organic foaming agent.

The
pneumatically applied product is separated into three types based on the
chemistry and upper use temperature use limit: The liquid binder consists of a
mixture of both organic and inorganic (colloidal silica) materials, and is
typically added in sufficient quantity to provide the fibers with necessary
adhesion to the applied surface; cohesion to one another; and the required physical properties
of the installed, dry insulation. Also, this type of fiber insulation is
typically dimensionally stable with exposure to the maximum rate temperature
for the particular type (I, II, or III). When first heated above a temperature of
about 500° F, most or all of the organic binder decomposes, leaving only the
colloidal silica binder.

The surface to which pneumatically applied high-temperature
fiber insulation is applied is typically prepared with weld pins and wire mesh,
the latter being applied a distance off the surface 1 inch less than the
finished thickness. The pins and wire mesh ensure the insulation material is
firmly applied and will resist the effects of vibration and external forces.

The
Safety and Health Committee of the National Insulation Association (NIA) met
during Committee Days for a combined committee meeting and roundtable.
Following the 2011 Committee Days, the committee voted to dispense with a
separate roundtable (with separate registration) and expand the regular
committee meeting to include a roundtable discussion. This article summarizes
the information shared among the attendees at the committee meeting on topics
including new procedures in Occupational Safety and Health Administration
(OSHA) whistleblower cases; the importance of establishing a program to address
heat stress issues for employees working in hot environments; scaffold safety
and scaffold erection issues; cranes, derricks, and safety issues concerning
this area of regulation; OSHA enforcement initiatives; and the possible OSHA
regulatory agenda following the election.

New
OSHA Whistleblower Program

OSHA has instituted a new program to address
whistleblower complaints, possibly as the result of an increase in the number
of such complaints being filed by employees. In March 2012, OSHA expanded the
issues it will address under whistleblower complaints to include actions taken
against employees who report an on-the-job injury and those who fail to follow
the employer’s procedures for reporting on-the-job injuries. Addressing the
typical whistleblower complaint has followed a fairly set pattern. After a
complaint is received by a local area office, it is assigned to an investigator
for OSHA who typically does not report directly to the area director, but to
the OSHA regional office. After speaking to the complainant, the investigator
begins the investigation by contacting the employer and typically proceeds by
interviewing witnesses for both sides of the complaint. Following the initial
interviews, the OSHA investigator usually makes an effort to get the matter
resolved through settlement before proceeding to the next level of
investigation and the possible filing of a complaint, which can result in a
case moving into Federal District Court.

NIA members attending learned that, under new procedures,
OSHA now employs a process of alternative dispute resolution to resolve these
issues. After OSHA receives a complaint?and usually before any investigation is
performed?the employer is contacted by someone from the OSHA area office
charged with trying to mediate and resolve the complaint without the necessity
of a formal investigation. Initial attempts are made informally; and the
employer is advised that if the matter can be resolved within a short period of
time, the need to file a position statement as to its response to the
whistleblower’s allegations may be obviated. This can save the employer a fair
amount of money because it can avoid the necessity of retaining counsel to
oversee preparation of documents to be supplied to the OSHA investigator. If
this informal procedure is not successful, but the parties truly seem to want
to resolve differences without going into formal investigation, a formal
mediation may be conducted?even though the employer has already filed its
position with OSHA. While no employer wants to admit liability or
responsibility for something it honestly did not do, from a purely economic
standpoint, being able to resolve a whistleblower complaint for a relatively
small amount of money without any admission of liability and without the
necessity of bringing in legal counsel can be an attractive proposition. Of
course, even an inexpensive settlement may not be desirable if other terms of
the settlement are not acceptable. As with any settlement in any litigation, be
sure you are knowledgeable of all the terms before signing.

Heat
Stress Issues

Heat
stress is an area that has moved from a general regulatory situation to one in
which “informal” guidelines have been recommended and will, in all likelihood,
form the basis for judging general duty clause violations in the future. In a
recent decision, the Occupational Safety and Health Review Commission (OSHRC) seemed
to take discretion out of the hands of the employer as to when a heat stress
hazard exists, providing the employer with much more rigid guidelines to
protect its employees and avoid a citation.

Under the new guidelines, the OSHRC referenced a National
Institute for Occupational Safety and Health (NIOSH) document recommending a
program to address heat stress. Some of the steps in the program include
re-acclimating employees who have been absent from a hot environment for more
than 3 days, and for the employer to develop a work/rest regimen. In the OSHRC
decision affirming a serious citation against an employer, the judge concluded
that the employer’s program was deficient because it did not have an
established work/rest regimen. Rather, it depended on employees asking for
breaks, which is considered insufficient. Employers must gauge the level of
heat exposure and the related stress on employees, and establish an appropriate
work/rest regimen.

A third part of the decision was the conclusion that merely making
water available for employees to drink is not sufficient. The OSHRC
recommendations include that the employer provide cool water and encourage
employees to drink 5 to 7 ounces of cool water every 15 or 20 minutes. A
general instruction to employees to “drink lots of water” was deemed to be
deficient because it does not encourage employees to drink a set amount of
water in a set period.

The decision additionally requires that
employers not only provide regular breaks, but cool rest areas where employees
take those breaks. Rest areas should be maintained at approximately 75
°F and should be
close to the work site. In the judge’s decision, the actions of the employer in
permitting employees to walk about 15 minutes to a break area to sit in an
air-conditioned vehicle was not adequate. The judge questioned whether an
employee suffering from heat stress would be able to walk 15 minutes to get to
a cool area.

These are just some of the points discussed during the
roundtable. All NIA members need to take a look at their heat stress program
and remember that this issue can be a problem at overheated worksites as well
as in hot climates.

Scaffold
Safety

Following
the discussion on heat stress, the conversation moved to scaffolding. Scaffold
safety is a high-visibility issue that is emphasized by OSHA. The committee
group discussed the need to have every scaffold green-tagged (approved) to show
that it has been inspected by a competent person. The status of the scaffold
needs to be checked at the start of each shift. Even if you use a
scaffold-erection company, you should have your own competent person place
his/her green tag on the scaffold after checking it. Do not forget that this
competent person needs to be “competent” in scaffold safety specifically.

Another area of great concern?which OSHA is emphasizing?deals
with the need to have toe boards on the working areas of scaffolds, especially
if employees will be working or passing below the scaffold. Even though you
have compliant guardrails to provide fall protection, do not lose sight of the
fact that you also must protect employees working below from the possibility of
something being kicked off one of the scaffold planks and striking the employee
working below.

Attendees discussed the need to have a scaffold
safety-competent person on site when a scaffold is in use, remembering that
scaffolds can only be erected, dismantled, or moved under the supervision of
such a competent person. A competent person for scaffold safety may not be the
same as the job site competent person, who may be more of a generalist as
opposed to someone focused in the scaffold area. Dovetailing with this
requirement is the fact that the design of scaffolding must be done by a
qualified person. While a qualified individual also can be a competent person,
these are distinct roles and can be filled by different people. While erecting
a scaffold, the employer shall have a competent person determine the
feasibility and safety of providing fall protection for employees who are
erecting or dismantling the supportive scaffolds. Employers are required to
provide fall protection for employees erecting or dismantling supported
scaffolds where the installation and use of such protection is feasible and
does not create a greater hazard.

Finally, the attendees discussed the need for barricading
areas under scaffolding when it is not possible to completely protect employees
below the work area on scaffolds from exposure of falling objects with toe
boards.

Cranes
and Derricks      

The
final topic discussed concerned cranes and derricks. The date for full
compliance with the cranes and derricks standard is fast approaching. During
this portion of the roundtable, attendees were reminded of the need for
employee training in the area of rigging and hand signals. For example, a
person in charge of signaling must know and understand signals; be competent in
using signals; have a basic understanding of crane operation; and be able to
pass a verbal or written test, plus a practical test, concerning the use of
signals. If a signal person is evaluated by a third-party qualified evaluator,
the employee’s qualifications and certain documentation is portable from one
employer to the next. However, if the evaluation is performed by the employer’s
own qualified evaluator, the certification is not portable when the signal
person leaves to go to another employer.

Attendees also were reminded that
inspections of cranes?for example, post-assembly inspection of a crane?must be
performed by qualified and/or competent persons.  The daily or per shift
inspection and the monthly inspection of the crane may be performed by a
competent person, but the annual inspection again must be performed by a
qualified individual. Crane requirements met in state-plan states must be at
least as effective as comparable federal standards. Members who operate in
states where there is a state-approved OSHA program still must comply with all
federal requirements. It is essential that all employers comply at least to the
level of federal OSHA requirements because most employers in our industry will
find themselves moving from state to state.

Committee Meeting Wrap-up

Participants
in the committee meeting felt that their time was well spent. NIA wishes to
encourage all members to participate in the various safety and health
activities, including the safety awards and the Health and Safety Committee
meetings at Committee Days and the Annual Convention. Your employees are your
most important resource. It is imperative that you take whatever steps are
necessary to provide a safe workplace for them and ensure as much as possible
that they are not needlessly exposed to hazards that can result in injuries or
death.

After
attending another informative and educational Committee Days meeting, it
occurred to me that the mechanical insulation industry—like the rest of the
world—can be divided generally into “givers” and “takers.” Givers are the
people and companies who seek to better our industry through active
participation in their professional community, business associations, and other
efforts in which they give their time and energy for a greater good. We all
benefit from the work of givers, both directly and indirectly. How much we
benefit depends on how much we involve and support them in our business—and how
much we give in return.

Givers Are Good
for Business

Identifying
the best-qualified mechanical insulation professional is easier when you start
from a pool of qualified candidates. Companies and individuals who have been
involved with the National Insulation Association (NIA) and other industry
organizations have advantages and resources that cannot be matched by those
outside of these associations. Members of NIA, for example, have access to the
most up-to-date information on issues such as safety awareness, human resources
requirements, developments in their sector of the industry (e.g., merit or
union contractor, distributor/fabricator, manufacturer), and training to
improve their knowledge and skills. NIA and other associations provide
opportunities for members to learn from each other and from experts on topics
of interest to the industry through participation at annual meetings,
conventions, and other networking opportunities. The knowledge, skills, and
resources they develop through their involvement in NIA and regional
associations offer you and your business direct benefits ranging from quality
and cost-effective services and products to enhanced worker safety and
productivity.

You probably don’t have to look far to identify one of these
givers. A colleague involved in a professional association is a giver; the
plant manager from across town who spends his free time going to monthly
meetings is a giver; the insulation contractor, manufacturer, or distributor
who belongs to one of NIA’s committees is a giver; as is the insulation service
provider who belongs to a regional association. Perhaps your insulation service
provider belongs to the local city association and serves on the Board of
Directors. Hiring these people/companies for your next job not only benefits
your business, it allows you to give back to those whose efforts benefit so
many.

Givers Improve
Our Industry

The
insulation industry owes a debt to givers who continuously strive to improve
worker safety, promote the value of mechanical insulation, raise the industry’s
profile on Capitol Hill and elsewhere, and develop training materials for use
by individuals in all sectors and at all levels of experience in the industry.

Givers have been involved in NIA from
the very beginning, donating time, talent, and money to promote safety in the
mechanical insulation industry. They created the Theodore H. Brodie
Distinguished Safety Award program, which offers NIA members the opportunity to
apply for safety awards and receive a critique of their safety program. These
givers have contributed toward making NIA contractor, manufacturer, and
distributor members the safest companies in the mechanical insulation industry.

Industry givers also created the unprecedented alliance
between NIA and the International Association of Heat and Frost Insulators and
Allied Workers to promote the effective use of mechanical insulation on Capitol
Hill and to the many government stakeholders that control the nation’s energy
consumption. These givers take time from their schedules to visit senators and
members of Congress to promote mechanical insulation. Thanks to them, while
many legislative priorities are currently sidelined, energy efficiency has won
the attention of Congress, which passed the Enabling Energy Saving Innovation
Act of 2012, H.R. 4850, with amendments focused on energy efficiency in federal
agencies and the industrial sector. Givers also work with the Department of
Energy to promote mechanical insulation, and with the National Institute of
Building Sciences to make all disciplines in the construction industry aware of
the importance of mechanical insulation.

It is the givers of the North American Insulation
Manufacturers Association who created the 3E Plus® Insulation
Thickness Computer Program—embraced and promoted by givers at NIA—that
identifies heat loss, greenhouse gas emissions, return on investment, and
energy savings potential of mechanical insulation. NIA givers also helped
create and support the 3E Plus training class and the Certified Insulation
Energy Appraisal Program. NIA givers meet regularly to create interesting and
informative programs for Convention and Committee Days so all members can
increase their knowledge of mechanical insulation and safe working practices,
and hone their business acumen. 

To promote continuing education and training, givers were
responsible for creating the Mechanical Insulation Education and Awareness
E-Learning Series to educate users about the benefits, proper design,
installation, and maintenance of mechanical insulation (available at www.nterlearning.org).
Givers also helped create the Mechanical Insulation Design Guide (MIDG), a
comprehensive source of information on the performance, use, testing, and
standardization of mechanical insulation in building and industrial facilities
(www.wbdg.org/design/midg.php); and it was givers who created the
Foundation for Education, Training, and Industry Advancement (the Foundation). 

Givers of the Midwest Insulation Contractors Association, one
of the regional associations in the United States, created the National
Commercial and Industrial Standards Manual, and regularly meet to ensure the
data in the manual is current. Givers in the Western Insulation Contractors
Association promoted and created the Foreman Training Program. The givers of
the various regional associations (CSIA, ESICA, MICA, SEICA, SWICA, and WICA)
serve on the Boards of Directors of NIA and promote mechanical insulation at
the local and national levels.

Givers Deserve
Our Support

It
is the givers who are prepared to risk making wrong decisions rather than
standing on the sidelines in the relative safety of making no decisions at all.
In the end, the givers are pulling the wagon, and takers are riding for free.
Are you buying your mechanical insulation services from a giver or a taker?
Does your mechanical insulation service supplier genuinely want to help you?
Ask your provider: Are you a giver or a taker? If the service provider is not a
member of a local, regional, or national insulation association, the chances
are good you’re dealing with a taker, not a giver. After reading about all the
concrete ways the givers help our industry and businesses, I hope you agree
that they are the people and companies you should use to get the mechanical
insulation services you need. They are involved, they are making a difference,
and they are promoting our industry today and for future generations. We need
more givers! We need to reward the givers we know, and we need to promote an
atmosphere of giving for the future.

The next time you buy mechanical insulation services, buy
from givers and let them know you appreciate their efforts. 


Notes:

1 For more information on the benefits
of NIA membership, see www.programs.insulation.org/images/nia/2012_NIA_Membership_Brochure.pdf.

2 For a full recap of this bill,
go to http://ase.org/resources/enabling-energy-saving-innovations-act-2012-section-section-summary.

As
demand increases for high-performance buildings, new methods and standards for
regulation are required.

Society demands a lot of buildings, and buildings require a
lot to meet those demands. Society expects buildings to provide a safe, secure,
healthy, and productive environment. To provide those features and peace of
mind, buildings use approximately 40 percent of the nation’s primary energy, 70
percent of the electricity generated in the United States, and around 10
percent of the nation’s water.1

The increasing desire for safer, more secure, healthier
buildings in the face of growing energy, environmental, and economic challenges
heightens demand for high-performance buildings.

As recognized by Congress, a high-performance building means
a building that “integrates and optimizes on a life cycle basis all major high
performance attributes, including energy conservation, environment, safety,
security, durability, accessibility, cost-benefit, productivity,
sustainability, functionality, and operational considerations.”2 To
individually and collectively consider, integrate, and optimize these diverse
attributes requires significant changes across the building industry.3
As a consequence, the building industry is evolving. Information technology has
played a role in streamlining historical processes.

Concepts such as integrated design, building information
modeling, building energy modeling, and alternative
methods of building construction project delivery (e.g., design-build,
construction manager/general contractor, performance contracting) are some of
the innovations that have emerged to actually change those processes. Public
demand for accountability and transparency also has grown.

However, the processes for communities and governments to
make sure buildings achieve the desired characteristics, whether high
performance or not, have remained largely unchanged, with the notable exception
of streamlining those processes through the use of information technology.

Adoption and
Enforcement of Building Regulations

Building
construction regulations (e.g., codes and standards governing the design,
construction, and even operation of buildings) have long served as the main
tool of governments in setting agreed-upon norms in a jurisdiction. Compliance
with those norms is generally secured through their enforcement by governments
or their designated agents in the design and construction of buildings. The
concept of building codes goes as far back as Hammurabi (circa 1772 B.C.), who
established a performance-based code4 with strict penalties for
noncompliance.5 Codes were developed and adopted in Europe as it was
settled, and evolved over many decades. Those codes were imported to the new
world and formed the basis for city codes as the United States was formed and
grew. Significant fires in Chicago and Baltimore,
and a San Francisco earthquake, in the late 19th and early 20th centuries
spurred further development of codes for the design and construction of
buildings. These efforts were fostered by the insurance industry. The primary
focus at that time was to avoid loss of life and property. Codes have increased
in stringency since then to address a myriad of new technologies and design concepts,
and they have expanded beyond health and safety requirements to include other
societal values such as accessibility, energy efficiency, indoor air quality,
and sustainability.

Codes typically contain two types of requirements:
prescriptive and performance. Prescriptive requirements provide minimum
standards for building materials, products, systems, etc. They stipulate
specifically what to provide and often represent a checklist of items and the
minimum acceptable specifications for those items. In contrast,
performance-based requirements set a desired end state and do not provide
minimum characteristics, per se?they set the desired result without specifying
how to achieve that result. In most instances, a measure of achieving the
desired result is based on the anticipated results associated with following
the prescriptive requirements. Both types of requirements are generally applied
when designing and constructing buildings with the premise that, if followed,
the building will perform at an acceptable level.

A third type of requirement is gaining traction:
outcome-based requirements. In this case, the performance outcome is
established. It is not aligned with any particular prescriptive provisions, and
compliance is verified after rather than before occupancy. Discussion of this
approach and its relationship to compliance verification methods appears later
in this article.

Today, several private-sector organizations develop model
codes and standards that are used as a basis for building construction regulations.
These documents provide the necessary criteria to make sure buildings are
designed and constructed to be considered safe, secure, healthy, energy
efficient, accessible, etc. They are then available for adoption by federal,
state, and local government as laws or regulations, or by anyone through
contracting or other mechanisms that can secure their application and use.
While the development process is slightly different within each organization,
the process is intended to comply with several key criteria:

  • The development process includes
    a balance of all relevant stakeholders including government, citizens, public
    interests, and building industry representatives – without undue influence from
    any one particular stakeholder;

  • A rigorous process is followed
    to make sure that recommendations for revision to existing codes and standards,
    or criteria for new model codes and standards, receive proper consideration and
    resolution; and

  • The process is transparent to
    facilitate trust and diverse engagement.

Like the development process within the private sector, the
adoption process by governments varies significantly. Some jurisdictions
require legislative action to adopt or update a code, while others
automatically update to a new edition of a model code or standard upon its
publication. In some instances, consideration by a state or locally appointed
committee or council may be required.

Within these processes, a jurisdiction may elect to develop
its own code to address state and/or local needs, adopt a model code unamended,
or adopt a model code that contains amendments the jurisdiction develops (the
predominant method of adoption). Once adopted, the adopting entity typically
sets the effective date of the new code to allow time for implementation and
educational considerations. Once the process is complete, the building industry
must satisfy the code’s provisions in the design and construction, and
sometimes actual operation, of a building. Those provisions are generally based
on nationally developed model codes and standards, generally adopted at the
state or local level (with the exception of buildings owned by or leased to
federal agencies), and compliance is enforced.

The responsibility to administer
building codes typically falls upon state or local jurisdictions. The
responsibility to comply with the adopted codes and standards falls on the
building owner or the designated agent. Compliance in the design stage
generally falls on designers and specifiers, and compliance with respect to actual
construction will  involve builders and contractors. Enforcement strategies
vary according to a state or local government’s regulatory authority,
resources, and staffing. Programs to verify compliance through code enforcement
may include all or some of the following activities:

  • Review of plans

  • Review of products, materials, and equipment
    specifications

  • Review of tests,
    certification reports, and product listings

  • Review of supporting calculations

  • Inspection of the building and its systems during
    construction (either by a public employee or a
    recognized third party)

  • Evaluation of materials substituted in the field

  • Inspection immediately prior to occupancy

  • Issuance of permit, certificate of occupancy,
    and/or other administrative documents

  • Processing of variance/appeal requests to the
    applicable code

For most requirements contained in codes, a building
department’s ability to re-inspect and verify compliance ends once a building
is issued a certificate of occupancy, as illustrated in Figure 1. Exceptions
can include elevators, boilers, fire suppression systems, egress, kitchen
sanitation, and plumbing system functionality. In addition to applying to new
construction, the adopted codes generally apply to additions, renovations,
repairs, and alterations to existing structures. Depending on the code and the
nature of the work being performed, the existing building’s status also will
have to be addressed and code compliance verified.

With respect to energy efficiency, Figure 1 can be summarized
as follows:

  • National model codes and
    standards are developed and updated, and provide prescriptive criteria to
    govern the design, construction, and pre-occupancy commissioning of buildings.
    They also provide a compliance path based on documenting equivalent or better
    energy performance compared to expected performance if the building just
    satisfied the prescriptive criteria.

  • Those model codes and standards
    are adopted by federal, state, and local government to govern the design and
    construction of buildings.

  • Designers and specifiers, or
    others retained by building developers/owners, prepare plans and specifications
    for the building, and document their compliance with what is adopted.

  • Where compliance verification is
    performed, the adopting agency or its agents conduct(s) a review of the plans
    and specifications. When it is determined that they meet the adopted code, a
    building permit is issued.6

  • The adopting agency or its
    agents conduct(s) inspection of the building during construction to verify that
    it is in conformance with the approved plans and specifications. If so,
    subsequent phases of construction are allowed to proceed. If not, a stop-work
    order could be issued and remain in effect until the noncomplying construction
    is repaired or replaced.

  • Upon passage of a final
    inspection, an occupancy permit is issued by the adopting agency or the
    designated enforcement agency.

  • The building is occupied and the
    occupants, owners, facility managers, etc. are provided a building that meets
    the minimum energy code?that is, it can be operated to provide certain
    environments and services, and there is an expectation that the energy use and
    associated costs of operation will be consistent with what was intended by the
    code.

The New Paradigm
and the Old Methodology

Until
recently, building owners and policy makers rarely asked how a building that
meets the energy code at occupancy really performs, and what that means with
respect to a code that does not apply after occupancy. In the end, if owners or
policy makers desire a particular level of performance, why not provide that
expectation up front and focus on whether the building actually performs to
expectations after it is occupied?

Recently, considerable focus has been directed at green or
sustainable buildings and achieving net-zero energy use. Achieving the results
envisioned by green building programs and reducing building energy use relies
on significantly more information and oversight than existing
prescriptive-based codes and standards, with compliance verified prior to
actual building occupancy. Unlike criteria covered by traditional health and
life-safety codes, resource use and many of the criteria covered in energy and
green or sustainable codes are measurable on an ongoing basis; their performance
is evident daily, and their ongoing level of performance is significantly
affected by operations and maintenance practices. Thus, they represent ongoing
costs to building owners, and are subject to measurement and verification.

Despite the differences between life-safety issues and energy
and water use, the development of codes and verification of compliance with
codes in these areas are largely the same. Current energy, water, and plumbing
codes do not actually regulate the use of energy or water, but cover the design
and construction of the building. Based on meeting prescriptive or performance
criteria for products, materials, equipment, or systems in buildings, there is
some expectation that the building will actually perform at an “energy efficient”
level. Prescriptive criteria include such items as minimum reflectivity of
roofing, minimum insulation levels, or providing certain types of lighting
controls.

Within the codes, individual performance criteria can be
found, such as lavatory faucets can use no more than X gallons per minute, or a
forced air furnace must have a minimum annual fuel utilization efficiency of Y.
Additionally, some design choices with significant impacts on actual building
energy use have traditionally not been addressed by energy codes but are
starting to be considered (e.g., minimum energy standards recently have added
orientation requirements, and green codes have addressed plug loads). These
include all energy-using objects brought into the building upon occupancy (plug
loads), orientation, and architectural massing.

Given today’s economic stresses, both the public and private
sectors are forced to prioritize limited resources. Because they do not
directly impact health and life safety, energy and green or sustainability codes
often receive a lower priority in the process of compliance verification.
Clearly, given a choice between working fire-suppression sprinklers in a
hospital or a working auto-dimming switch on a lighting system, the former
would take precedence. This example provides a look into the core focus of this
article. Given current and likely future resource challenges, and the need to
apply resources to  top priorities, is there a way to compose energy and green
or sustainable codes so that compliance verification can be significantly
simplified while increasing compliance and delivered outcomes?

Going beyond ensuring a design meets a set of criteria on
paper, high-performance buildings must be constructed pursuant to the plans and
specifications, and then commissioned and operated as real buildings. Achieving
high performance requires a focus on actual performance throughout a building’s
life cycle?from design and construction to operations and maintenance to
deconstruction. Existing energy and green or sustainable codes are not
presented in a manner that actually addresses the long-term performance of
buildings, nor is the current enforcement process geared to look beyond
occupancy at energy or water use issues.

Outcome-based policies7 are emerging to shift
focus from verifying compliance in design and construction and declaring
success toward the actual performance of the building following issuance of an
occupancy permit. These policies are intended to go beyond the
performance-based codes that are based on prescriptive codes and do not require
a measurement and verification process after occupancy.

Such policies would provide valuable feedback to building
teams and result in progressive improvements in building design and
construction. In effect, instead of trying to prescribe how to design and
construct buildings, why not just state a simple, measurable goal? Such an
approach recognizes the myriad factors that affect performance of the building.
These are analogous to prescribing in detail all the things a runner must do,
wear, eat, drink, etc., before a race; running down a checklist at the start of
the race and then sending the runner home, versus simply putting up a finish
line and measuring how fast the runner actually runs the course.

The implementation of outcome-based policies with respect to
building energy and/or water use is elegantly simple, but it will require
rethinking existing norms around design fees, code enforcement, liability,
contract duration, and establishing new norms of what happens if the building
does not perform to achieve the desired outcomes.8

Trying to fit new approaches into an existing infrastructure
not designed to accommodate them can result in ineffective and frustrating
attempts to verify and achieve compliance. It also ignores potential leverage
points and areas of expertise that can be utilized in pursuit of established
goals. Important tools to support long-term performance, such as operations and
maintenance plans and commissioning, are designed to occur after the certificate
of occupancy.

However, the existing code enforcement scheme is generally
not set up to handle long-term monitoring requirements associated with energy
and/or water use. A new, holistic scheme designed to achieve specific energy-
and/or water-use results for the life cycle of a building is necessary.

Start at the End

If
the ultimate intent is to achieve net-zero energy- and water-use buildings,
then codes and standards must be reformulated to focus on outcomes. The
building design and regulatory systems must be reformatted to provide the most
efficient process for reaching and verifying satisfaction of such goals.9
This is particularly important as code enforcement agencies and building owners
deal with a new economic environment where funds, personnel, and other
resources are limited. A singular focus on streamlining and/or applying more
resources to support the existing code enforcement infrastructure may seem
appropriate given the format and application time frame of current codes.
Alternatively, one may want to start at the end goal and explore how that might
be achieved in a process that reduces the stresses on the current support
infrastructure.

Throughout the life cycle of a building, there are numerous
touch points with government and other influences that can impact how buildings
ultimately perform. In addition to code officials, these include insurance
companies, financiers, utilities, tax agencies, tenants, and purchasers. Such
touch points should be examined as potential opportunities to influence
building performance. While the building community is recognizing the need for
integrative design processes, an integrated compliance verification process
appears equally attractive.

Achieving net-zero energy or water use
(and any improvement in performance toward that end) requires a well-designed
and well-constructed building, and well-managed operations and maintenance. The
existing code compliance verification scheme has the capability to adequately
examine the design and construction phase of a structure in a prescriptive code
environment to determine compliance.

As buildings become increasingly complex?and as building
modeling improves and owners and regulators demand specific levels of
performance?the adequacy of the existing compliance verification scheme comes
into question. Outcome-based policies can alleviate the need to bolster current
compliance verification processes simply by changing what is measured when.

Once a minimum threshold is demonstrated, further details of
the design of the structure are irrelevant. It is the actual energy or water
use that matters. Outcome-based policies would set the desired end state while
addressing stress associated with continuing to operate the current support
infrastructure.

Going back to the running analogy, an examiner with a
checklist at the start of the Boston marathon is replaced with timing chips, a
starting gun, and a finish line, with the recognition that there may be certain
minimum requirements that must be satisfied in order to run and that during the
race there may be certain checks such as ensuring the course is not cut.

Reaching the End
Goal

Through
a results-focused approach to achievement of building energy- and water-use
goals, a vast transformation of the building community is possible. An incentive-
and market-based approach would account for actual energy use?what building
owners actually pay for and policy makers actually want to reduce. By extending
responsibility of the design and construction team beyond the certificate of
occupancy, and involving them with the building owner and operator during
occupancy, valuable long-term feedback loops are established. The absence of
many of the constraints present in existing energy and water codes would
inspire technological and design innovation.

Code enforcement officials would remain
the primary mechanism to support life safety, but more recent requirements (and
related challenges) associated with enforcement of energy and green codes
largely would shift to the entities and policies that have the greatest ability
to influence energy use.

The Price of
Inaction

The
building community has established performance goals for the buildings they
design, construct, operate, and maintain. However, there appears to be growing
consensus that incremental improvements in existing codes will result in only
marginal improvements based primarily on assumptions rather than actual,
as-occupied performance.

Without a comprehensive policy focused on achieving an
identified result, piecemeal policies will continue to develop with an
uncoordinated result. Eventually, compliance rates may drop, as codes become
more stringent with respect to energy and/or water use, and state and local
resources become more stretched.

A new approach to achieving building
energy- and water-use goals is necessary. Such a new approach should be
centered on the recognition that results are based on the design and
construction of buildings, and how they are commissioned, operated, and
maintained. The current compliance verification scheme based solely on
compliance verification through code department enforcement up to initial
occupancy is inadequate, and even if significantly enhanced would still only
assess design and construction, and not actual operational outcomes. It is
those actual outcomes (rather than those anticipated by the design) that matter
to building owners, policy makers, and the public. More importantly, it is
those outcomes that will address our energy, environmental, and economic
challenges.

The shift in approach to compliance verification cannot
happen without the demand and insight of a progressive building community
willing to stand behind the buildings they design, construct, own, operate, and
maintain; and willing to support codes and standards that focus on measuring
and reporting the actual performance of buildings.


Notes:

1 Department of Energy, Buildings
Energy Data Book, Table 1.1.3 and Table 8.1.1, buildingsdatabook.eren.doe.gov/

2 Energy Independence and Security
Act of 2007 §401 (PL 110-140)

3 For the purpose of this article,
the building industry is considered in a very broad sense to include everyone
involved in the design, construction, commissioning, operations, and financing
of buildings, and those involved in a similar manner with the variety of
products, materials, systems, devices, etc. that buildings comprise.

4In general, a performance-based
code establishes a desired result without indicating how that result is to be
achieved. Conversely, a prescriptive code provides specifics to individually
govern all items in a building that would affect the outcome.

5 According to Hammurabi’s code,
if a builder builds a house for someone and does not construct it properly, and
the house falls and kills its owner, then that builder shall be put to death.
If it kills the son of the owner, the son of the builder shall be put to death.
If it kills a slave of the owner, then the builder shall pay, slave for slave,
to the owner of the house. If it ruins goods, he shall make compensation for
all that has been ruined; and, inasmuch as he did not construct properly the
house that he built and it fell, he shall re-erect the house from his own
means. If a builder builds a house for someone, even though he has not yet
completed it, if the walls seem toppling, the builder must make the walls solid
from his own means.

6 It is possible that the permit
would only cover certain aspects of construction and be updated during
different phases of construction.

7 Prior discussion has focused on
development of “outcome-based codes,” but, as will be discussed later, this
limited approach is inefficient and unlikely to reach the levels of actual
performance desired.

8 For an examination of the
existing norms and challenges associated with a shift to outcome-based
requirements, see Colker, R.M., “Outcome-Based Codes: Answering the Preliminary
Questions,” Strategic Planning for Energy and the Environment, Spring 2012.

9 The authors acknowledge that not
all buildings can achieve net-zero energy or water use in the near future. However,
all building owners and policies should reach for the lowest total energy use
possible for a particular building. Development of net-positive energy and
water buildings, and community approaches to net-zero energy and water use,
will help even out some of these variations across buildings. The key
distinction is measuring actual performance against some metric, or designing
and constructing to a set of limited prescriptions but not addressing actual
performance.

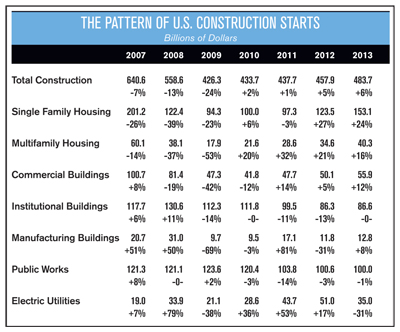
 

Changing Conceptions About Insulation System Maintenance

Insulation must first be properly designed and installed
by a professional or the consequences can be costly. Even then, insulation is
often seen as an “install-and-forget” item in both commercial and industrial
facilities. However, that apathy could become expensive if a lack of
maintenance results in an energy-inefficient process, the need for new
mechanical components, or a safety hazard. By monitoring the integrity of an
insulation system, facility managers and engineers help ensure desired system
performance, reduced energy costs and greenhouse gas emissions, and a safe
environment for personnel.
 

Making the Rounds

A
simple yet under utilized measure that goes a long way toward preserving
insulation system health is a regular inspection schedule. It is critically
important that insulated systems are inspected. Beyond visual inspections,
infrared technology can be used to spot compromised locations along an
insulated system. Dents or other significant impressions along the surface of
an insulated line?from foot traffic, dropped tools, or some other
factor?threaten the integrity of the insulation, especially at crucial
circumferential and longitudinal joints.

A compromised joint can enable
condensation or allow penetration of outside contaminants like chlorides. The
result is corrosion and safety risk due to contents under pressure. Any ingress
of fresh or salt water fosters corrosive conditions, which requires thinking
about process safety.

Any hole, compromising dent, or instance of corrosion should
be remediated immediately. Damaged or wet insulation reduces the thermal
efficiency of the insulation system.

Situational
Awareness

By
understanding factors contributing to the health of the insulation system, you
can prevent damage to the system, extend its durability, and create value. This
is also where visual inspections come into play. System design factors should
reflect a focus on areas that may be exposed to more physical abuse, such as
the aforementioned dents or other damage resulting from foot traffic.

Foot Traffic

An
engineering process should designate these areas of high traffic or physical
abuse as suitable locations for installing a more reinforced insulation
assembly. Higher compression insulation/jacket solutions should be used for
areas visibly affected by or exposed to traffic, such as horizontal runs that
are walked on as workers access a process line.

Solutions here could range from high compressive strength
insulation materials such as calcium silicate and perlite to molded,
heavy-density products that have abuse-resistant jackets. Protective structures
can be erected over high-traffic locations to allow for access without standing
or walking on mechanical insulation systems.

Elsewhere in the system, vertical runs that do not share the
same prospect for potential physical abuse can be engineered with the
appropriate insulation application.

Ultraviolet (UV)
Light Damage

Another
factor that can speed degradation of insulation is UV light. This is further
reason to inspect lines that have direct exposure to UV light. Even with
integrated UV resistance, any organically derived material will degrade under
the effects of direct UV ray exposure. Most people consider this for exterior
applications but forget about interior applications that can be exposed to
windows and UV light. If you are using one of the few products affected by UV
light, make sure that it is protected by coating or a jacket, and is regularly
examined and maintained.

Right Thought,
Wrong Habit

An
unfortunate scenario we have seen or heard about too many times is
unnecessarily stapling a self-sealing lap, even with today’s most advanced
insulation jacketing systems. While the intention may be to ensure integrity,
the opposite effect is created.

On a chilled water line, something as small as a few staple
holes can compromise the insulation vapor retarder and result in moisture
propagation, potential corrosion, and mold growth.

Proper
Maintenance Creates Sustainability Benefits

Maintenance
awareness is creating more opportunities to bring in sustainability at the
mechanical process level. With the trend toward viewing the building as a whole
system with respect to efficiency and economic opportunity, the drive for
energy savings means more awareness of the correct level of performance for
mechanical insulation.

This challenges traditional prevalent thought of mechanical
insulation as an install-and-forget building component. The NIA has estimated
that maintenance of industrial facility insulation could generate $3.7 billion
in energy savings annually. Research from the U.S. Department of Energy (DOE)
Industrial Technologies Program also found that mechanical insulation
improvements resulted in an approximate 9- to 12-month payback period for
plants of varying sizes when it came to process heating and steam systems. The
DOE estimates that between 10 and 30 percent of all mechanical insulation is
missing or damaged. Mechanical insulation provides great opportunities in both
the commercial and industrial sectors for energy and financial savings.

Today’s insulation awareness brings a
clear opportunity with energy resources. Nearly a third of the energy consumed
in the United States is used for industry, compared to 40 percent for buildings
and 28 percent for transportation. While energy policy is often focused on
transportation, real energy savings gains can be made in the industrial and
building sectors.

Another sustainability aspect is the healthfulness of the
insulation products themselves. As more specifiers and property owners gain
interest in indoor air quality, products that are formaldehyde-free or
certified by Greenguard play a role in enhancing sustainability. If a
low-emitting environmental strategy is in place for a building, one should
consider the insulation in the mechanical area that is the heart of the
structure’s ventilation system.

With commercial and industrial insulation, energy and cost
savings are enjoying more consideration beyond the simple enablement of system
processes. In under-performing or compromised insulation scenarios, evolving to
an optimized insulation system will significantly reduce energy costs.

The
Bottom Line

Simply put, an insulation system that hasn’t been well
maintained isn’t working properly. It does not give the performance you believe
it to be delivering. If it’s an industrial process, you might be adding
significantly more “fuel to the fire” to transfer required energy from point A
to point B. The same problem exists in a commercial building when, for example,
moving conditioned air from the basement to the 50th floor. Poorly or
unmaintained insulation is a waste of money and energy.

While it may sound like common sense,
insulation system maintenance requires a conscious effort. A lack of inspection
and maintenance increases the potential for problems, either with performance
or corrosion. Mitigating corrosion risk should be a constant thought.
Everything from process delivery to physical safety correlates to ongoing,
optimized insulation performance.


Fibrous Insulations

Fibrous insulations are
composed of small-diameter fibers that finely divide the air space. The fibers
may be organic or inorganic and they are normally (but not always) held
together by a binder. Typical inorganic fibers include glass, rock wool, slag
wool, and alumina silica.

Mineral Fiber (Fiberglass
and Mineral Wool)

Mineral fiber insulations
are defined by ASTM as insulations composed principally of fibers manufactured
from rock, slag, or glass, with or without binders.

Fiberglass and
mineral wool products fall in this category. There is some confusion concerning
the nomenclature used for these materials. Fiberglass products (sometimes
called “fibrous glass” or “glass wool”) and mineral wool products (sometimes
called “rock wool” or “slag wool”) are covered by the same ASTM “mineral fiber”
specifications, and sometimes by the same type and grade. Specifiers are
cautioned to call out both the specific material and the ASTM type and grade
when specifying these products. For example “Fiberglass pipe insulation meeting
the requirements of ASTM C547 Type I, Grade A” or “Mineral Wool pipe insulation
meeting the requirements of ASTM C547 Type II, Grade A.” A number of ASTM
material standards cover mineral fiber products.

Mineral Fiber Pipe

Mineral fiber pipe
insulation is covered in ASTM C547. The standard contains five types classified
primarily by maximum use temperature.

The standard further
classifies products by grade. Grade A products may be “slapped on” at the
maximum use temperature indicated, while Grade B products are designed to be
used with a heat-up schedule.

The specified
maximum thermal conductivity for all types is 0.25 Btu
in/(hr ft² °F) at a mean temperature of 100°F.

The standard also
contains requirements for sag resistance, linear shrinkage, water-vapor
sorption, surface-burning characteristics, hot surface performance, and
non-fibrous (shot) content. Further, there is an optional requirement in ASTM
C547 for stress corrosion performance if the product is to be used in contact
with austenitic stainless steel piping.

Fiberglass pipe
insulation products will generally fall into either Type I or Type IV. Mineral
wool products will
comply with the higher temperature requirements for Types II, III, and V.

These pipe
insulation products may be specified with various factory-applied facings, or
they may be jacketed in the field. Mineral fiber pipe insulations systems are
also available with self-drying wicking material that wraps continuously around
pipes, valves, and fittings. These products are intended to keep the insulation
material dry for chilled water piping in high-humidity locations. Mineral fiber
pipe insulation sections are typically supplied in lengths of 36 inches, and
are available for most standard pipe and tubing sizes. Available thicknesses
range from ½” to 6″.

Mineral Fiber Blanket

Mineral fiber blanket
insulation for commercial and industrial applications is covered in ASTM C553.
The standard contains seven types classified by maximum use temperature and thermal
conductivity.

The standard also
contains requirements for flexibility, water-vapor sorption, odor emission, surface-burning
characteristics, corrosiveness, and shot content.

These insulations
are flexible and are normally supplied as batts or rolled blankets. Dimensions
vary, but thicknesses from 1″ to 6″ are typically available. The products may
be specified with various factory-applied facings, or may be ordered unfaced.

Mineral Fiber Block and
Board

Mineral fiber block and
board insulation is covered in ASTM C612. This standard contains five types classified
by maximum use temperature and thermal conductivity.

Each of these types
is further classified by compressive resistance. Category 1 materials have no requirement
for compressive resistance, while Category 2 materials require a minimum
compressive resistance value. Density is not a performance measure and has been
removed as a requirement in ASTM C612.

The standard also
contains requirements for linear shrinkage, water-vapor sorption,
surface-burning characteristics, odor emission, corrosiveness to steel,
rigidity, and shot (non-fibrous) content. Further, there is an optional
requirement in ASTM C612 for stress corrosion performance if the product is to
be used in contact with austenitic stainless steel. Fibrous glass boards will
generally meet Types I, II, or III. Mineral wool products will generally comply
with the higher temperature requirements for Types IVA, IVB.

These
products are supplied in rigid and semi-rigid board form. Dimensions will vary,
but typical available thicknesses range from 1″ to 4″. The products may be
specified with various factory-applied facings, or may be ordered unfaced.

Figure 1
Figure 2
Figure 3
Figure 4
Figure 5