The Mechanical Insulation Design Guide (MIDG) contains extensive information on mechanical insulation materials and their properties, as well as design information. Based on excerpts from the MIDG, here is an overview of design objectives and considerations that should be taken into account for each insulation system.
Most engineers, architects, and end users are familiar with the use of insulation to reduce heating and cooling loads, and to control noise in building envelopes. Insulations used for pipes, ducts, tanks, and equipment are not as familiar; and the installed cost of these materials is usually a small part of the total cost of a project. As a result, mechanical insulation is often overlooked, undervalued, or improperly specified and maintained in commercial and industrial construction projects.
Mechanical insulation is used primarily to limit heat gain or loss from surfaces operating at temperatures above or below ambient temperature. It may be used to satisfy one or more of the following design objectives (answering the question: why insulate?).
- Condensation control: minimizing condensation and the potential for mold growth by keeping surface temperature above the dew point of the surrounding air
- Energy conservation: minimizing unwanted heat loss/gain from systems. There are three primary reasons to conserve energy
- Energy: minimize the use of scarce natural resources
- Economics: minimize return on investment (ROI) and minimize life-cycle cost
- Environment: minimize emissions associated with projects’ energy usage
- Fire safety: protecting critical building elements and slowing the spread of fire in buildings
- Freeze protection: minimizing energy required for heat tracing systems and/or extending the time to freezing in the event of system failure
- Personnel protection: controlling surface temperatures to avoid contact burns (hot or cold)
- Process control: minimizing temperature change in processes where close control is needed
- Noise control: reducing/controlling noise in mechanical systems
In addition to these objectives, a number of design considerations may require attention when designing a mechanical insulation system.
- Abuse resistance
- Corrosion under insulation
- Indoor air quality
- Maintainability
- Regulatory considerations
- Service and location
- Service life
Designing insulation systems can be complicated, as they are intended to satisfy a number of design objectives and in some projects, must satisfy multiple design objectives simultaneously. For example, the objective may be to provide the economic thickness of insulation and avoid surface condensation on a chilled water line. The chilled water line may pass through various spaces within the project. Those various spaces may have differing temperature and humidity conditions, so it is likely that different insulation materials, thicknesses, and coverings may be required for a single line. Since projects may involve many lines operating at various service temperatures in various environmental conditions, it is clear that a systematic approach is required for all but the simplest projects.
Design Objectives Condensation Control
For below-ambient systems, condensation control is often the overriding design objective. The design problem is best addressed as two separate issues 1) avoiding surface condensation on the outer surface of the insulation system, and 2) minimizing or managing water vapor intrusion.
Avoiding surface condensation is desirable for a number of reasons (1) it prevents dripping that can wet surfaces below, (2) it minimizes mold growth, and (3) it avoids staining and possible damage to exterior jacketing.
The design goal is to keep the surface temperature above the dew-point temperature of the surrounding air. Calculating surface temperature is relatively simple, but selection of the appropriate design conditions is often confusing. The appropriate design condition is normally the “worst-case” condition expected for the application. For condensation control, however, a design that satisfies the worst-case condition is sometimes impossible.
For outdoor applications (or for unconditioned spaces vented to outdoor air), there are always some hours per year where the ambient air is saturated or nearly saturated. For these times, no amount of insulation will prevent surface condensation. Therefore, for outdoor applications and mechanical rooms vented to outdoor conditions, it is suggested to design for a relative humidity (RH) of 90%. Appropriate water-resistant, vapor-retarder jacketing or mastics then must be specified to protect the system from the inevitable surface condensation. Additional design dew-point data can be found in Chapter 28 of the 2005 ASHRAE Handbook of Fundamentals (www.ashrae.org).
For indoor designs in conditioned spaces, care must still be exercised when selecting the design conditions. Often, the HVAC system will be sized to provide indoor conditions of 75°F/50% RH on a design summer day. However, those conditions would not represent the worst-case indoor conditions with respect to the insulation design. Part load conditions could result in higher humidity levels, or night and/or weekend shutdown could result in more severe conditions.
Water Vapor
Note that the discussion has focused so far on designing to avoid condensation on the exposed surface. Another important design consideration is minimizing or managing water vapor intrusion. Water vapor intrusion is extremely important for piping and equipment that is operating at below ambient temperatures. Water-related problems include thermal performance loss, health and safety issues, structural degradation, and aesthetic issues. Water entry into an
insulation system may be through diffusion of water vapor, air leakage carrying water vapor, and leakage of surface water.
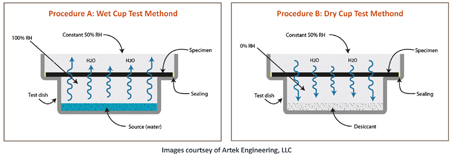
During those periods when the operating temperature is below the dew point of the surrounding ambient air, there will be a difference in water vapor pressure across the insulation system. This vapor-pressure difference serves as the driving force for diffusion of water vapor from the ambient toward the cold surface. Piping and equipment typically create an absolute barrier to the passage of water vapor, so any vapor-pressure difference imposed across the insulation system results in the potential for condensation either within the insulation or at the cold surface. While these pressure differences seem small, the impact over many operating hours can be significant.
A number of fundamental design principles are applied in managing water vapor intrusion. One method is to reduce the driving force by reducing the moisture content of the surrounding air. While the insulation designer typically will not have control of the location of the piping, ductwork, or equipment to be insulated, there are opportunities for the mechanical engineer to influence the ambient conditions. Certainly, locating cold piping, ductwork, and equipment in unconditioned portions of buildings should be minimized. Consideration should be given to conditioning mechanical rooms, if feasible.
Another fundamental design principle involves the moisture-storage design. In many systems, some condensation can be tolerated, with the amount depending on the water-holding capacity or water tolerance of a particular system. The moisture storage principle permits accumulation of water in the insulation system but at a rate designed to prevent harmful effects. This concept is applicable when 1) unidirectional vapor flow occurs, but accumulations during severe conditions can be adequately expelled during less severe conditions; or 2) reverse-flow conditions regularly occur on a seasonal or diurnal cycle. Design solutions using this principle include 1) periodically flushing the cold side with low dew point air (this procedure requires a supply of conditioned air and a means for distribution), and 2) use of an insulation system supplemented by selected vapor retarders and absorbent materials such that an accumulation of condensation is of little importance. Such a design must ensure adequate expulsion of the accumulation.
Another common method is the application of moisture-blocking design. The moisture-blocking principle is applied in a design wherein the passage of water vapor is eliminated or minimized to an insignificant level. The design must incorporate: 1) a vapor retarder with suitably low permeance; 2) a joint and seam sealing system that maintains vapor retarding system integrity; and 3) accommodation for future damage repair, joint and seam resealing, and reclosing after maintenance.
A vapor retarder is a material or system that will adequately reduce the transmission of water vapor through the insulation system. The vapor retarder system is seldom intended to resist the entry of surface water, or to prevent air leakage, but can occasionally be considered the second line of defense for these moisture sources.
Energy Conservation – Financial Considerations
Energy is in short supply, and our dependency on foreign energy sources is at best volatile. Throughout the developed world, the primary source of energy is the burning of fossil fuels. Energy supply and demand plays an increasingly vital role in national security and the economy.
Minimum insulation levels for ductwork and piping often are dictated by these energy standards, which are often adopted by model building code organizations and/or various jurisdictions as building energy codes. Energy codes address energy conservation in buildings, but typically do not address additional design objectives (such as condensation control, personnel protection, or noise control) that may be important on a specific project. The adoption of energy codes varies by state and locality, and the level of enforcement varies. For the current status of statewide energy codes, see www.bcap-energy.org or www.energycodes.gov.
As an aid to understanding the relationships between energy, economics, and emissions for insulated systems, simple spreadsheet calculators have been developed for equipment, vertical flat surfaces, and horizontal pipe applications.
Calculated results are given over a range of insulation types and thicknesses, and include 1) surface temperature, 2) heat flow, 3) annual cost of fuel, 4) payback period, 5) annualized rate of return, and 6) annual CO2 emissions.
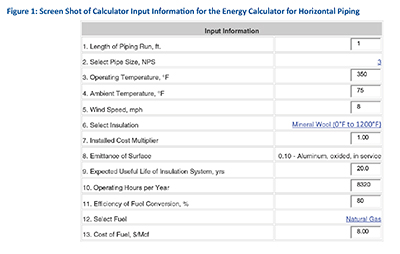
The pipe spreadsheet estimates the heat flows through horizontal piping. Information concerning a hypothetical insulation system (e.g., the length of run, pipe size, operating temperature, ambient temperature and wind speed, insulation material, and surface emittance of a proposed insulation system) may be input by the user. Calculated results are given over a range of insulation types and thicknesses, and include 1) surface temperature, 2) heat flow, 3) annual cost of fuel, 4) payback period, 5) annualized rate of return, and 6) annual CO2 emissions.
Economic Considerations – ROI
Insulation systems are frequently designed with the objective of minimizing costs. Properly designed systems can reduce heat loss (or gains) from (or to) mechanical systems by 90-98%. When energy must be purchased to offset these heat flows, insulation systems can quickly pay for themselves in reduced energy costs.
Insulation projects (like many energy conservation projects) generally involve making an initial investment that will result in future cost savings. A number of approaches can be used to measure the financial desirability of an insulation project. All require estimates of the initial investment (the installed cost of the insulation system) and the resulting future savings. Some of these financial measures are simple, like ROI and Simple Payback Period. Others are more complicated and take into account the time value of money, inflation, and taxes.
In today’s economic environment, companies are requiring that investments be subject to review at various levels in the approval process. The Mechanical Insulation Financial Calculator was developed to provide a simple example of specific financial measures related to investments in mechanical insulation. It can be used for an overall mechanical insulation project or a simple, small mechanical insulation investment?such as insulating a valve or replacing a section of insulation. Tax implications of the investment have not been considered in the Financial Calculator. Users should consult a financial advisor for specific and/or tailored financial calculations.
Economic Thickness Considerations
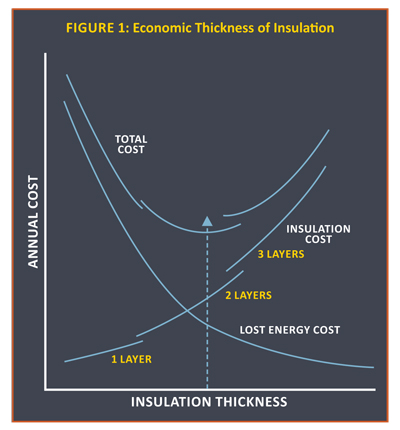
The concept of economic thickness of insulation considers the initial installed cost of the insulation system plus the ongoing value of energy savings over the expected service lifetime. Economic thickness is defined as the thickness that minimizes the total life-cycle cost (see Figure 1). The installed costs (labor and material) of the insulation increase with thickness.
Insulation often is applied in multiple layers (1) because materials are not manufactured in single layers of sufficient thickness, (2) to accommodate expansion and contraction of insulation and system components, and (3) to minimize thermal short circuits at joints. Figure 1 shows initial installed costs for a multilayer application. The curve is discontinuous and increases with the number of layers because labor and material costs increase more rapidly as thickness increases. Figure 1 also shows the present value of the “lost energy” cost over the expected life of the project, which decreases as the insulation thickness is increased. The total cost curve, which is the sum of the installed insulation cost and the present value of the lost energy cost curves, shows a minimum value at point A. This point on the total cost curve corresponds to the economic insulation thickness, which, in this example, is in the double-layer range.
Initially, as insulation is applied, the total life-cycle cost decreases rapidly because the value of incremental energy savings is greater than the incremental cost of insulation. Additional insulation reduces total cost up to a thickness where the change in total cost is equal to zero. At this point, no further reduction can be obtained; beyond it, incremental insulation costs exceed the additional energy savings derived by adding another increment of insulation.
An economic thickness analysis should consider the time value of money, which can be based on a desired rate of return for the insulation investment. Energy costs are volatile, and a fuel cost inflation factor is sometimes included to account for the possibility that fuel costs may increase more quickly than general inflation. Insulation system maintenance costs should also be included, along with any identifiable cost savings associated with the ability to specify lower capacity equipment.
Any economic analysis must, by nature, deal with quantifiable benefits and costs. Some benefits difficult to quantify (e.g., thermal comfort of occupants, increased life of mechanical equipment, reduced dependency on energy imports, and/or reduced emissions). Designers therefore should consider the economic thickness of insulation to be a minimum.
Economic considerations also come into focus during the owner/contractor “value engineering” (VE) process. Efforts by the contractor or owner/developer to reduce the initial cost of a building or structure by applying the principles of value engineering to the building design and construction must be carefully weighed by the architect/engineer-of-record against the best long-term interests of the owner/end-user. This is particularly true with regard to mechanical insulation. In too many instances, the term “value engineering” is used as a euphemism for cost reduction. Design choices of insulation materials, thicknesses, and jacketing systems made by the design professional are arbitrarily considered cost-prohibitive for a project and are eliminated during the VE process. In some cases, the costs associated with correcting problems that result from VE decisions can be significant, and the work highly disruptive. The importance of documenting the criteria used in the design, and highlighting these criteria during the VE process, is emphasized.
Environmental Considerations – Sustainability
Along with the benefits associated with conserving energy resources, insulation contributes to the reduction in emissions associated with using those energy resources. Insulation products are among the few building materials considered to be “carbon negative,” in that reductions in carbon emissions over the life of the materials far exceed the carbon emissions associated with manufacture, transport, and installation of the insulation products.1 In addition, well-insulated mechanical systems often can result in smaller equipment, which also contributes to sustainability.
Fire Safety
Mechanical insulation materials often are used as a component in systems or assemblies designed to protect buildings and equipment from the effects or spread of fire (i.e., fire-resistance assemblies). Specific designs are tested and assigned hourly ratings based on performance in full-scale fire tests. Note that insulation materials alone are not assigned hourly fire-resistance ratings; ratings are assigned to a system or assembly that may include specific insulation products, along with other elements such as framing members, fasteners, wallboard, etc.
Materials used to insulate mechanical equipment generally must meet the requirements of local codes adopted by governmental entities having jurisdiction over the project, so local code authorities should be consulted for specific requirements. In the United States, most local codes incorporate or are patterned after model codes developed and maintained by organizations such as the National Fire Protection Association (NFPA) and the more recent International Code Council (International Codes).
Fire-resistance ratings often are developed using ASTM E119. This test exposes assemblies (walls, partitions, floor or roof assemblies, and through-penetration fire stops) to a standard fire exposure controlled to achieve specified temperatures throughout a specified time period. The time-temperature curve is intended to be representative of building fires where
the primary fuel is solid, and specifies a temperature of 1,000°F at 5 min, 1,700°F at 1 h, and 2,300°F at 8 h.
Most codes related to insulation product fire safety refer to the surface burning characteristics as determined by the Steiner tunnel test (ASTM E84, NFPA 255, UL 723, or CAN/ULC S-102). These similar test methods evaluate the flame spread and smoke developed from samples mounted in a 25 ft long tunnel and subsequently exposed to a controlled flame. Results are given in terms of flame-spread and smoke-developed indices.
For pipe and duct insulation products, samples are prepared and mounted in the tunnel per ASTM E2231, which directs that “the material, system, composite, or assembly tested shall be representative of the completed insulation system used in actual field installations, in terms of the components, including their respective thicknesses.” Samples are constructed to mimic the products, as closely as possible, the products as they will be used?including any facings and adhesives, as appropriate.
Duct insulation generally requires a flame-spread index of not more than 25 and a smoke-developed index of not more than 50, when tested in accordance with ASTM E84. Codes often require factory-made duct insulations (e.g., insulated flexible ducts, rigid fibrous glass ducts) to be listed and labeled per UL 181, Factory-Made Air Ducts and Air Connectors. This standard specifies a number of other fire tests (e.g., flame penetration and low-energy ignition) as part of the listing requirements.
Some building codes require that duct insulations meet the fire-hazard requirements of NFPA 90A or 90B to restrict spread of smoke, heat, and fire through duct systems; and to minimize ignition sources.
For pipe insulation, the requirement is generally a maximum flame-spread index of 25 and a maximum smoke-developed index of 450. For insulation materials exposed within supply and return ducts and plenums, the typical requirement is that the materials be noncombustible or have a maximum flame-spread index of 25 and maximum smoke-developed index of 50.
Freeze Prevention
It is important to recognize that insulation retards heat flow; it does not stop it completely. If the surrounding air temperature remains low enough for an extended period, insulation cannot prevent freezing of still water or water flowing at a rate insufficient for the available heat content to offset heat loss. Clean water in pipes usually supercools several degrees below freezing before any ice is formed, then, upon nucleation, ice forms in the water and the temperature rises to freezing. Ice can be formed from water only by the release of the latent heat of fusion (144 Btu/lb) through the pipe insulation. Well-insulated pipes may greatly retard this release of latent heat. Gordon’s research in 1996 showed that water pipes burst not because of ice crystal growth in the pipe, but because of elevated fluid pressure within a confined pipe section occluded by a growing ice blockage.2 Insulation can prolong the time required for freezing, or
prevent freezing if flow is maintained at a sufficient rate.
Personnel Protection – Safety
In many applications, insulation is provided to protect personnel from burns. In addition, there are safety and comfort concerns related to personnel working in high-temperature, high-radiant exposure locations.
The potential for burns to human skin is a complex function of surface temperature, surface material, and time of contact. See ASTM Standard Guide ASTM C1055 – 03(2009) for a discussion of these factors. ASTM Standard Practice C1057 – 03(2010) provides a mathematical model for “Determination of Skin Contact Temperature from Heated Surfaces….” Standard industry practice is to specify a maximum temperature of 140°F for surfaces that may be contacted by personnel. This temperature would cause no more than first-degree burns for all surfaces for contact times up to about 5 sec. Note that for non-industrial settings (e.g., retail stores) it may be prudent to design for longer contact times (i.e., lower surface temperatures).
When evaluating an insulation system for the potential for burn hazards, select the appropriate worst-case ambient condition. For indoor applications, maximum air temperatures depend on the facility and location, and are typically lower than for outdoor conditions. For outdoor installations, base calculations on summer design ambient temperatures with no wind (i.e., the worst case). Surface temperatures increase because of solar loading, but are usually neglected because of variability in orientation, solar intensity, and many other complicating factors. Engineering judgment must be used in selecting ambient and operating temperatures, and wind conditions, for these calculations.
The choice of jacketing also strongly affects a surface’s relative safety. Higher-emittance jacketing materials (e.g., plastic, painted metals) can be selected to minimize the surface temperature. Jacketing material also affects the relative safety at a given surface temperature. For example, at 175°F, a stainless steel jacket blisters skin more severely than a nonmetallic jacket at equal contact time.
Process Control
Insulation systems often are designed to minimize variation of temperatures in processes. A common example is the use of insulation on tanks or vessels used as chemical reactors, where the yield of the reaction is dependent on the temperature. Insulating the reactor helps to isolate the reaction from variations in ambient temperature and minimizes the capacity of process heating and/or cooling equipment.
Another example is the use of insulation to minimize temperature change (drop or rise) of a fluid from one location to another. Consider the case of a hot fluid flowing down a pipe or duct. Note that, for a cold fluid flowing down a pipe, the temperature drop will have a negative sign, which indicates a temperature rise in the fluid stream.
Noise Control
Noise Radiating from Pipes
Noise from piping can be reduced by adding an absorptive insulation and jacketing material. The expected level of noise reduction in the field can be estimated from knowing knowing the sound insertion loss of insulation and jacketing material combinations. A range of jacket weights and insulation thicknesses can be used to reduce noise. Jackets used to reduce noise are typically referred to as being mass-filled. Some products for outdoor applications use mass-filled vinyl (MFV) in combination with aluminum.
Pipe insertion loss is a measurement (in dB) of the reduction in sound pressure level from a pipe as a result of application of insulation and jacketing. Measured at different frequencies, the noise level from the jacketed pipe is subtracted from that of the bare pipe. The larger the insertion loss number, the larger the amount of noise reduction.
ASTM Standard E1222 describes how to determine insertion loss of pipe jacketing systems.
It is important that sound sources be well identified in industrial settings, otherwise it is possible to treat specfic noise sources effectively and have no significant influence on ambient sound measurement after treatment. All sources of noise above desired levels should receive acoustical treatment, beginning with the largest source.
Noise from Ducts
HVAC ducts act as conduits for mechanical equipment noise and carry office noise between occupied spaces. Additionally, some ducts can create their own noise through duct wall vibrations or expansion and contraction. Lined sheet metal ducts and fibrous glass rigid ducts can greatly reduce transmission of HVAC noise through the duct system. The insulation also reduces cross-talk from one room to another through the ducts.
Attenuation loss is noise absorbed within the duct. In uninsulated ducts, it is a function of duct geometry and dimensions, as well as noise frequency. Internal insulation liners generally are available for most duct geometries. Chapter 47 in the 2007 ASHRAE Handbook?HVAC Applications provides attenuation losses for square, rectangular, and round ducts lined with fibrous glass, and gives guidance on the use of insulation in plenums to absorb duct system noise. Internal linings can be very effective in fittings such as elbows, which can have two to eight times more attenuation than an unlined elbow of the same size. For alternative lining materials, consult individual manufacturers.
Breakout noise is from vibration of the duct wall caused by air pressure fluctuations in the duct. Absorptive insulation can be used in combination with mass-loaded jacketings or mastics on the duct exterior to reduce breakout noise. This technique is only minimally effective on rectangular ducts, which require the insulation and mass composite to be physically separated from the duct wall to be effective. For round ducts, as with pipes, absorptive insulation and mass composite can be effective even when directly applied to the duct surface.
For More Information
Additional information on these topics and more can be foundat www.wbdg.org/midg or www.insulation.org.
References
1.
Gordon, J., 1996. An investigation into freezing and bursting water pipes in
residential construction. Research Report 90-1. University of Illinois Building
Research Council.
2.
Russell, A., 2007, The Basics of Life Cycle Assessment and Insulation, ASTM C
16 Forum. April 2007.
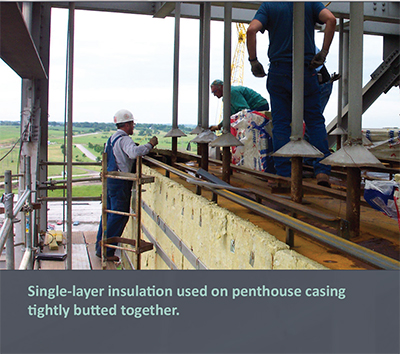 Figure 1
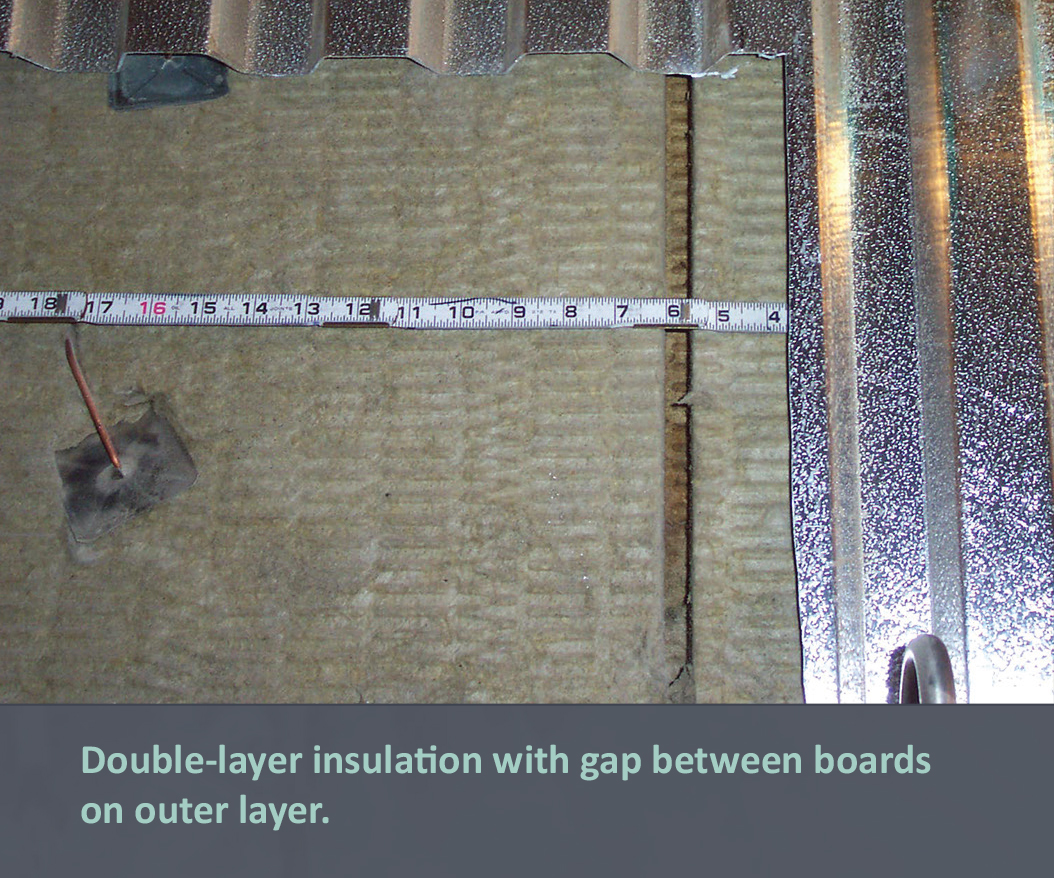 Figure 2
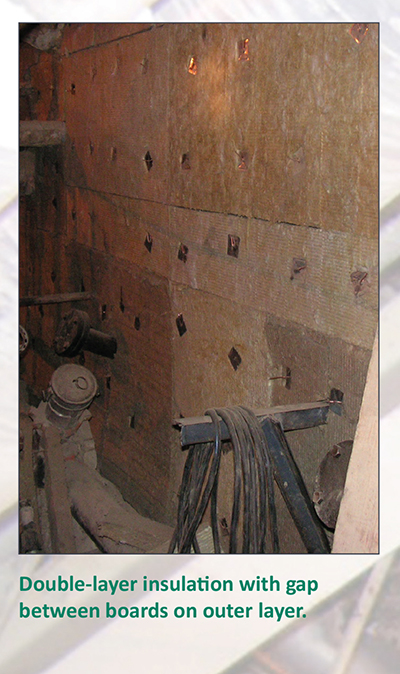 Figure 3
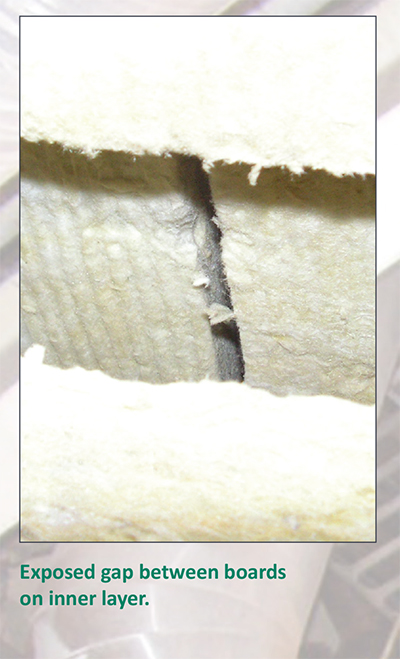 Figure 4
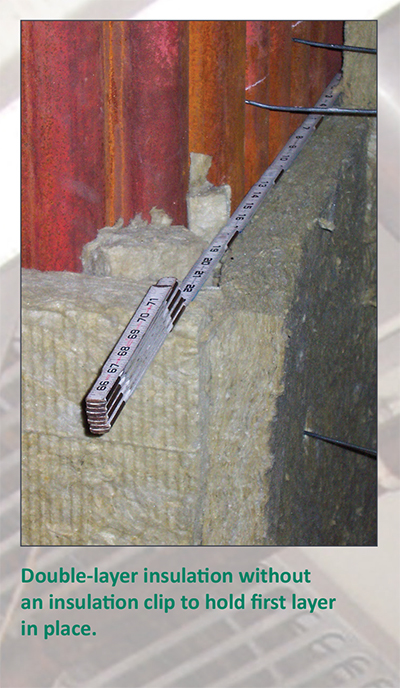 Figure 5
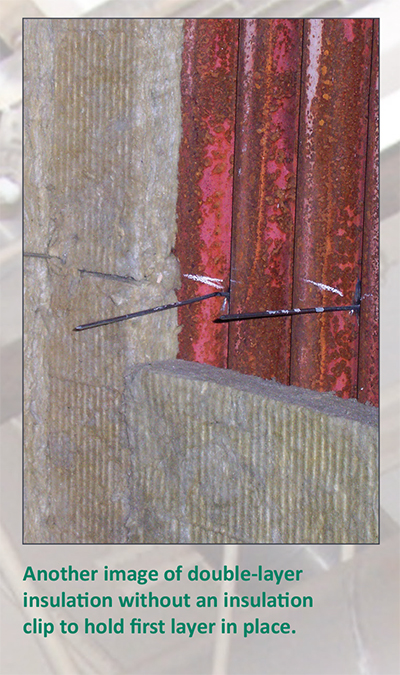 Figure 6
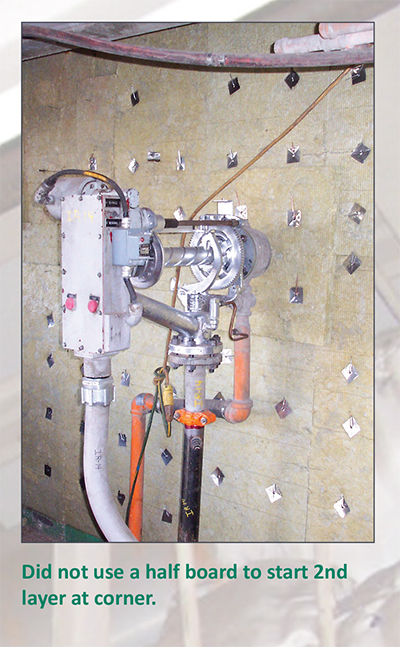 Figure 7
 Figure 8
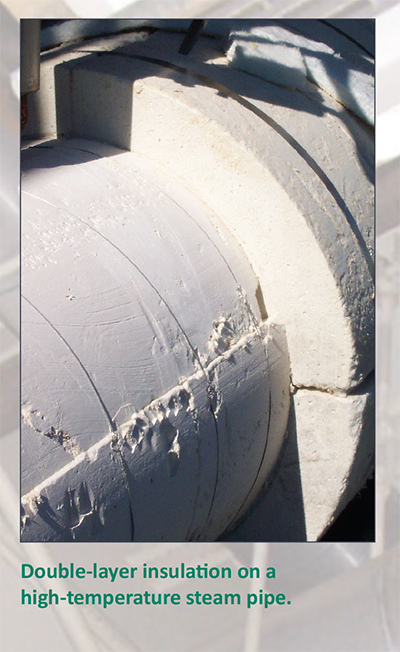 Figure 9
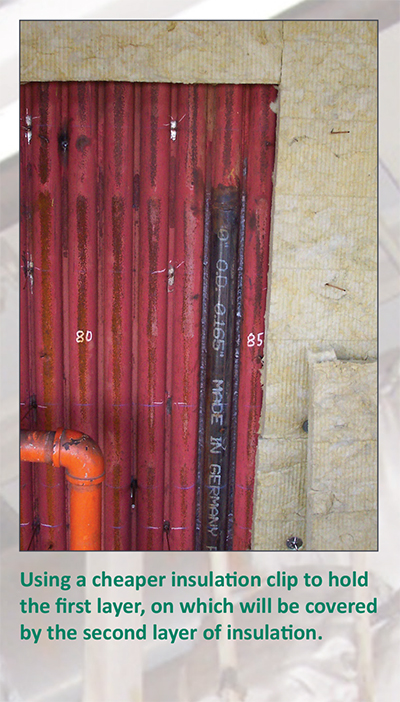 Figure 10
 Figure 11
 Figure 12
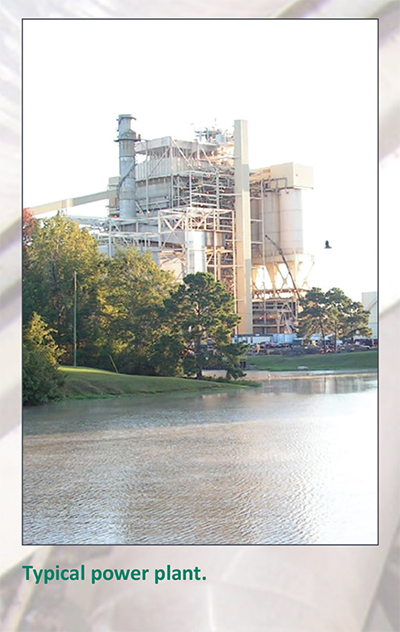 Figure 13
 Figure 14
 Figure 15
 Figure 16