Category Archives: Global

To avoid costly problems, an owner, engineer, and/or architect should check some basic things on their mechanical insulation systems during construction. While no article can educate everyone on the nuances of mechanical insulation, the basic information in this article is important for facility owners, architects, and engineers to understand. This article is meant for the majority of Insulation Outlook readers who are owners, operators, architects, and engineers. It is not directed at mechanical insulation contractor readers, who already know what makes a mechanical insulation installation live up to its potential.

Lesson 1: The Specification

If the community where the facility is being constructed has an energy code, be sure the mechanical insulation specification meets or exceeds that code. Many, but not all, specifications adhere to ASHRAE 90.1 2007. Make sure the specification for mechanical insulation takes the current environment into consideration. The next standard will undoubtedly have stricter energy efficiency requirements, so if you go cheap now, you may pay dearly later.

There are a few items that the owner should consider for a properly functioning facility:

  • All domestic hot and cold water pipe systems should be properly insulated.
    • Hot water systems should be insulated from the hot water heater or storage tank to the branch leading to the faucet. Every foot of uninsulated hot water pipe translates into dollars out the window for the building owner. The lack of insulation on a 140-degree pipe system can become very expensive (see Lesson 2).
    • Failure to insulate domestic cold water systems can lead to condensation on the pipes, causing unsafe conditions for walking and mold growth that can be very expensive to eradicate.
  • On heating systems, all heating hot water supply and return piping, steam and condensate piping, and process heating system piping should be properly insulated, including valves, strainers, and fittings. This will help reduce greenhouse gas emissions by allowing the system to work efficiently.
  • Proper insulation of cooling systems will also have an environmental impact. Proper insulation on below-ambient cooling pipes will reduce the possibility of mold growth and lessen the chances of condensation problems, as well as increase equipment efficiency.
  • Proper mechanical insulation on ventilation systems should be included in the specification. This should include the supply and, in many cases, the return duct systems.

Lesson 2: “Value Engineering”

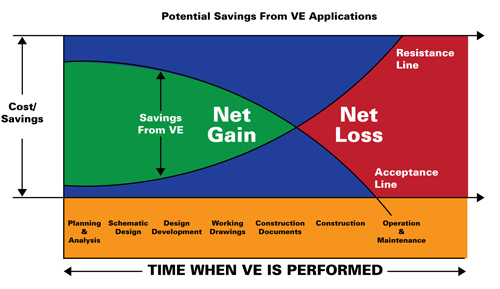
Did the mechanical insulation for this facility get “value engineered,” or is someone trying to convince you to “value engineer” your insulation specification? Value engineering, when it comes to mechanical insulation, almost always means compromising the insulation thickness, changing the materials (a cheaper substitute), or eliminating the insulation on some services or portion of services.

Value engineering is used to get the initial building cost at or below the number placed on the facility during the design stage. The problem with value engineering mechanical insulation is that the cost to operate the building will increase as mechanical insulation is eliminated or reduced. When mechanical insulation is reduced, the equipment within a facility works harder, thus increasing operating costs and decreasing the life of the equipment.

The process is almost never done with the long-term ramifications of building operation in mind. A case in point: a building owner or architect allows the specification for a 180-degree hot water heating system to be decreased from 1½-in. thick fiberglass material to 1 in. thick. There would be a small savings in material cost. But the CO2, NOx, and CE emissions go up 32 percent each, while the heat loss for the system goes up 32 percent. The cost per foot per year also goes up 32 percent. These numbers are just for reducing the insulation thickness; imagine the impact if parts of the system are not insulated at all.

Another example: a building owner or architect allows the specification for a 140-degree domestic water system to decrease from 1 1/2-in. thick fiberglass to 1 in. thick. The CO2, NOx, and CE emissions go up 28 percent, and the heat loss for the system goes up 28 percent. The cost per foot per year goes up 28 percent. Again, imagine the impact if the system is not insulated at all due to value engineering.

Mechanical insulation on domestic water systems is a frequent victim of value engineering. If your facility’s mechanical insulation was value engineered, you may be paying for something you are not getting, and you will be paying for it for years to come. If some form of the current cap-and-trade legislation comes to fruition, you may well be paying for your increased carbon footprint with higher taxes as well.

Lesson 3: Mechanical Pipe, Duct, and Equipment Installation

The proper installation of the mechanical services is critical to the proper installation of mechanical insulation. From the mechanical perspective, if the fluid in the pipes gets to where it should, the air in the ducts gets to the diffusers, the toilets flush, and the faucets work, it’s all good. But if the pipes were installed too close together for the insulation to be installed properly, it can become a big problem.

If the pipe or conduit has been installed using the sheet metal duct as a support system, it may require that the conduit and/or pipe be insulated with the duct. A simple rule of thumb is that the outside edge of parallel pipes that require insulation should be at least double the insulation thickness plus 1/2 in. apart. If a duct system requires insulation, the electrician, fitter, plumber, cable installer, or any other trade should not use the duct as a support system, and the duct should be installed with enough clearance to insulate around the entire duct. If pipes, ducts, or equipment requires insulation, the items should be installed with enough clearance to allow proper installation of the insulation.

Lesson 4: Materials

Make sure the proper insulation material is installed on each mechanical service. Many materials look alike but are not alike. Make sure the labels are on the materials and that the proper thicknesses are on the jobsite ready for installation. This can be accomplished by a quick walk through of the facility. All major insulation manufacturers label their materials properly, and you should be able to see the labels at a glance.

Lesson 5: Weather

Never force the mechanical insulation contractor to install material prior to establishing a dry building. If insulation materials are installed before the roof or windows are on the building, moisture may damage the insulation. Wet insulation will support mold growth and be less effective.

If you force the insulation contractor to install material before the building is ready, you are taking a risk. High-rise buildings frequently require insulation to begin on the lower floors while the upper floors are still under construction. There are no windows or roof on the building, but the schedule requires completion on a certain date, so the pressure is on to insulate now. Rain, snow, and ice can enter the upper floors and melt down onto the materials installed on the lower floors. This is a problem you don’t want. You will forget the accelerated schedule long before you solve the problem of wet and damaged insulation.

In the industrial sector, material must often be installed in inclement weather; however, in most cases the materials are protected immediately after application.

Lesson 6: The Little Gaps

Look for little transgressions that can become big problems later. One example is not properly butting the insulation materials to one another as the materials are installed. A small gap between insulation sections may seem like a little thing, but it can compromise materials and become very expensive. If the gap is on a cold pipe system, it can allow condensation to form on the pipe at the opening. The condensation can form a moist area on the insulation or on the ceiling where mold can grow. The dripping condensation can also lead to unsafe conditions on the floor, where the moisture can collect and cause a slipping hazard.

On the hot side of things, the small gap is not as noticeable. But it allows heat loss for the life of the building (see Lesson 2). That heat loss translates to dollars out the window for the facility owner.

Make sure the mechanical insulation is installed with properly butted joints and vapor barriers. Duct systems can have the same types of problems too. If mechanical insulation does not look clean and sharp when it is finished, it probably has not been installed properly.

Lesson 7: Vapor Barriers

Vapor barriers are extremely important when insulating cold systems. Improperly installed vapor barriers can cost significantly when the failures become apparent. Most pipe insulation materials are furnished with factory-applied vapor barriers from the manufacturer.

Many vapor barrier system failures occur at irregular surfaces. Cold insulation systems require vapor barrier mastic to seal the fittings, valves, strainers, valve stems, etc. Make sure that small appurtenances are insulated to avoid condensation that can creep back into the main, causing possible mold problems and dripping.

Ask to look at the mastic containers to ensure that the product is a vapor barrier material. When the wrong mastic is used, the costs can be very high: removing the old materials and replacing them with the correct materials, as well as removal and replacement of portions of the ceilings and walls. It can be very expensive. Make sure it is done right the first time.

Lesson 8: Pipe Supports

Pipes must be supported by hanger systems installed by the pipe fitting contractor. There are many types of support systems, but all require some insulation between or over the pipe and hanger.

When walking through the facility, pay particular attention to the pipe support systems on all services. Most specifications require some insulation protection at the pipe supports. There are many different systems to alleviate this pipe support problem:

  • Insulation support saddles are designed to spread the weight of the pipe over a larger area at the hanger.
  • Wood plugs can be inserted between the insulation support saddle and the pipe.
  • Special treated wood saddles, half the diameter of the pipe, can be used between the pipe hanger and the insulation.
  • Heavy density materials can be installed at each pipe support to protect the insulation.
  • Special insulation protection systems that will support the pipe at the proper level while performing the insulation function are manufactured by several companies.

If there is no insulation protection saddle at the support, chances are good that the insulation will be crushed when liquid is placed in the pipes. The crushing will decrease the value of the insulation and may cause breaks in the vapor barrier, which will allow failure in the future.

The softer insulation materials usually require some sort of insert between the pipe and the protection saddle to spread the weight of the pipe over a large area. If the insulation is showing signs of crushing, the chances are very good the inserts have not been installed.

Large bore pipe sizes almost always require some sort of protection to ensure that the insulation is not crushed. Insulation protection inserts are manufactured to size to address this problem.

Copper pipes are frequently clamped directly to a unistrut hanger. The insulation can be field fabricated to go around and over most of the unistrut, but not the portion that is in direct contact with the unistrut itself. That portion is destined to fail. There are many manufacturers of special hangers that allow proper spacing at the unistrut to allow insulation.

Lesson 9: Flashings

One of the most important parts of an outdoor installation is the weather protection. Many facilities use various gauges of metal products to protect the mechanical insulation from snow, rain, wind, ice, and abuse. If the protection fails, water may enter the insulation system and begin the process of corrosion under the insulation, as well as cause the material to stop performing as specified.

Failure points can be found in many places on outdoor systems. The lap of the jacketing on straight pipes should be facing down at four o’clock or eight o’clock. On risers, the lap should be away from the direction of the prevailing wind. All joints should be overlapped by at least 3 in. to ensure that no moisture can be driven into the system. On risers, the circumferential lap from the piece of jacket above should be over the jacket below to ensure water will flow away from the insulation system. Valve bodies, elbows, tees, and other areas where irregular insulation is used should be properly flashed so the water will run away from the system, not into it. The edge may be cleaner if the jacket is run up and over the down side of the elbow cover, but the moisture will run down and into the insulation system if this practice is used.

Common sense should dictate how flashings are done. If water will run into the system, it is done wrong. Caulking should be used at all appurtenances to keep moisture out of the system. Insulated systems should not be used as a platform or ladder to access higher areas. When people stand on weatherproofed material, they can destroy the protection and allow moisture to enter the system. There are many new weatherproofing materials on the market that not only provide weather protection but also act as a vapor barrier, and they are gaining wide acceptance.

Lesson 10: The Clean, Safe Job

Every project should be kept as clean as possible. The floors should be kept clean of insulation scraps, lap backings, empty boxes, materials not being used, and other items that can create a danger to the insulator or other tradespeople. Protective coverings should be placed under areas where mastic is being applied to avoid splattering. Protective equipment should be worn by all tradespeople at all times on the project site. Ladders should be inspected and used only if in good order. All OSHA rules and regulations should be adhered to at all times on the project site.

The safe job is a topic that could take an entire issue of Outlook to cover. Follow OSHA regulations, and remember: a dirty job is trouble waiting to happen.

Conclusion

So there you have it: the top 10 basics of mechanical insulation. There are many more lessons, and all of the above could be expounded on in much greater detail. To learn more about mechanical insulation installation, check out the Mechanical Insulation Design Guide at www.wbdg.org/midg or search the National Insulation Association’s technical articles database at www.insulation.org/articles/. Another great reference for any person responsible for mechanical insulation is the Midwest Insulation Contractors Association (MICA) National Commercial and Industrial Insulation Standards Manual (available at www.insulation.org/products).

The Federal Building in downtown Youngstown, Ohio, features an extensive use of natural light to illuminate offices and a white roof to reflect heat. It has LEED certification, the country’s most recognized seal of approval for green buildings.

But the building is hardly a model of energy efficiency. According to an environmental assessment last year, it did not score high enough to qualify for the Energy Star label granted by the Environmental Protection Agency (EPA), which ranks buildings after looking at a year’s worth of utility bills.

The building’s cooling system, a major gas guzzler, was one culprit. Another was its design: to get its LEED label, it racked up points for things like native landscaping rather than structural energy-saving features, according to a study by the General Services Administration (GSA), which owns the building.

Builders covet LEED certification—it stands for Leadership in Energy and Environmental Design—as a way to gain tax credits, attract tenants, charge premium rents, and project an image of environmental responsibility. But the gap between design and construction, which LEED certifies, and how some buildings actually perform led the program to announce that it would begin collecting information about energy use from all the buildings it certifies.

Buildings would provide the information voluntarily, said officials with the United States Green Building Council, the nonprofit organization that administers the LEED program, and the data would be kept confidential. But starting this year, the program also is requiring all newly constructed buildings to provide energy and water bills for the first 5 years of operation as a condition for certification. The label could be rescinded if the data is not produced, the officials said.

The council’s own research suggests that a quarter of the new buildings that have been certified do not save as much energy as their designs predicted and that most do not track energy consumption once in use. And the program has been under attack from architects, engineers, and energy experts who argue that because building performance is not tracked, the certification may be falling short in reducing emissions tied to global warming.

Some experts have contended that the seal should be withheld until a building proves itself energy efficient, which is the cornerstone of what makes a building green, and that energy-use data from every rated building should be made public.

“The plaque should be installed with removable screws,” said Henry Gifford, an energy consultant in New York City. “Once the plaque is glued on, there’s no incentive to do better.”

Scot Horst, the council’s senior vice president for its certification program, said that any changes in the process would have to be made by consensus to ensure that the building industry would comply. Already, some construction lawyers have said that owners might face additional risk of lawsuits if buildings are found to underperform.

The council planned several meetings with builders, owners, developers, and others around the country in September and October to promote its building performance initiative, which could lead to further revisions in the rating program to ensure buildings reduce energy consumption as much as they can.

Mr. Horst called the issue of performance one of his “absolute priorities.”

“If you’re not reducing carbon, you’re not doing your job,” he said.

The LEED label, developed by the council in 1998 to have a third-party verification of a building’s environmental soundness, certifies new homes, schools, and other buildings, as well as existing ones. (The certification for existing buildings is the only one currently tied to energy performance.) Its oldest and largest program, in terms of square footage, is the certification of new commercial and institutional buildings, with 1,946 projects already certified and 15,000 more that have applied for certification. Many other buildings include environmentally friendly features and advertise themselves as “green” but do not seek the LEED label.

The program uses a point system based on a broad checklist of features, and buildings can be certified by accumulating points on not just efficient energy use but also water conservation, proximity to public transportation, indoor air quality, and use of environment-friendly materials.

Council officials say that these other categories also help reduce energy use and emissions. And many architects and engineers praise the comprehensiveness of the label. But the wide scope of the program, many in the industry point out, also means that buildings have been able to get certified by accumulating most of their points through features like bamboo flooring, while paying little attention to optimizing energy use.

Another problem is that the certification relies on energy models to predict how much energy a planned building will use, but council officials and many experts agree that such models are inexact. Once a building opens, it may use more energy than was predicted by the design. And how a building is used—how many occupants it has, for example—affects its energy consumption.

“If the occupants don’t turn off the lights, the building doesn’t do as well as expected,” said Mark Frankel, technical director for the New Buildings Institute, which promotes improved energy performance in new commercial construction and conducted the research commissioned by the Green Building Council on LEED buildings.

“In the real world, the mechanical systems may have problems, so that increases energy use,” Mr. Frankel said, adding that keeping track of energy use is rarely a priority for owners.

LEED energy standards have grown more stringent over the years, and construction like the Youngstown federal building, built in 2002, would not be certified under the current version of the program, the GSA study noted. The LEED standard goes through periodic revisions, and this year, the minimum energy requirements needed for the basic LEED certification for new buildings were raised.

But in its own study in 2008 (see www.newbuildings.org/downloads/Energy_Performance_of_LEED-NC_Buildings-Final_3-4-08b.pdf) of 121 new buildings certified through 2006, the Green Building Council found that more than half—53 percent—did not qualify for the Energy Star label and 15 percent scored below 30 in that program, meaning they used more energy per square foot than at least 70 percent of comparable buildings in the existing national stock.

Anecdotal information from follow-up research to that study indicated that the best-performing buildings had limited window areas and tended to be smaller.

Sometimes, a building’s inhabitants are the first to notice energy-wasting features.

At the Octagon, a LEED-certified residential rental building on Roosevelt Island in New York City, residents like Alan Siegal say that obvious energy savers, like motion sensors in the hallway, are hard to miss. But Mr. Siegal, 59, a customs service broker, said his three-bedroom apartment has floor-to-ceiling glass windows that offer great views but also strong drafts.

“If there’s a lot of glass, is that going to be efficient?” he asked.

Bruce Becker, whose company Becker and Becker Associates developed and owns the Octagon, said that the windows offer day lighting but conceded that there were plenty of opportunities to become more energy efficient. He said the Octagon would soon switch to a fuel cell system for heat and electricity, partly to cut energy costs at a time of a depressed rental market.

Mr. Horst, the LEED executive, said that LEED may eventually move toward the EPA’s Energy Star model, which attests to energy efficiency only for the year the label was given, similar to restaurant ratings.

“Ultimately, where we want to be is, once you’re performing at a certain level, you continue to be recertified,” Mr. Horst said.

From The New York Times on the Web © The New York Times Company. Reprinted with Permission.

In the October 2009 issue of Insulation Outlook, I shared with you the benefits of social media. While many readers have provided feedback in agreement with these benefits, most are left wondering: “If I set up a Twitter, Facebook, LinkedIn, Stumble Upon, Bing, and YouTube page, where will I find the time to update all this stuff?”

When I started writing this article back in the beginning of November, the answer was as simple as “use a social media integration site such as streamy.com.” However, that answer is no longer the best solution.

Since early November, something amazing has happened: social media collaboration among the 10 different types of social media. In layman’s terms, non-competing types of social media are allowing the comments from one site to be posted on the other site. What this means to you is that by strategically selecting only the social media most likely to generate leads, you can save time and money by linking all your sites to help eliminate duplication of your efforts, all while making multiple impressions on your target audience.

That said, before you get bogged down with how to manage social media, I strongly recommend two things:

  1. Learn about the 10 different types of social media.
  2. Develop a social media marketing strategy that best targets your audience segment.

Types of Social Media

Microblogging. Twitter is the best example of a microblogging site, because it allows you to say what is on your mind very briefly, typically in 140 characters or less. Even links to other sites are converted into smaller URLs automatically prior to sharing. Want to learn more about Twitter? Request a free copy of my Twitter Marketing Your Business e-book (see address at the end of this article).

Professional. LinkedIn has mastered this category. It is very exclusive and designed to help you network with the people who really make your professional industry move.

Purely Social. Facebook and Myspace are the best and worst because they allow a large number of creative applications. This causes social sites like Facebook and Myspace to have a vague purpose, which makes it difficult to identify a potential customer. You have to make it easy for your customers to find you, since you can’t identify them.

Video. YouTube has quickly become the standard component in social media. Video social media helps level the playing field for many small businesses with insulation and product videos, and if done well can create trust very quickly.

Bookmarking. Sites like StumbleUpon and Digg are leaders in bookmarking. Bookmarking sites add efficiency to your searches for useful information on the web. Not only do they make it easier for you to find information, they also make it easier for people interested in what you offer to find you.

Photo Sharing. Flickr and Picasa are king. Both do a great job of getting good search results for your photos, so it would be wise to keep an album of photos tagged with keywords related to your website.

Search. Google…need I say more? Okay. Yahoo!, Ask, Goodsearch, Dogpile, and Bing. Search sites are getting more and more powerful and granular, and are great for basic secondary market research.

Forums. Wikipedia is an example of a powerful forum. It is viewed by many as a great knowledge resource and is moderated with care. Well-run forums come with built-in trust because users know the moderator will drive conversations toward constructive usage.

City/Regional Weekly. Social media is going local. A great example of this is Outside.In, a site that helps locate local bloggers. Outside.In is a content aggregator; it shows content from both traditional media and blogs. You can’t contact the local bloggers directly through Outside.In; it’s just for locating them. You’ll want to visit the local blogs you find, start reading them regularly and leaving quality comments, and then eventually introduce yourself and start that relationship.

Gadget News and Review. Engadget and Gizmodo are on the forefront of this technology. Gadget blogs provide a sense of where hardware, software, and social interaction will intersect. They don’t describe this explicitly, but the devices are part of the equation and essential to forecasting and preparing for future trends. This knowledge plays a critical rule in the development of “the next big thing.”

Once you are familiar with the 10 types of social media, you must identify where your target audience is most likely to be found. Within the insulation industry, three major delivery segments exist: manufacturers, distributors, and retailers. Each of these will most benefit from a different combination of social media tools, because each has a different target audience.

Delivery Segment Combinations

Manufacturing: Bookmarking, Video, Photo Sharing, Forum, Professional, and Gadget News and Review.

Distributors: Search, Professional, Purely Social, and City/Regional Weekly.

Retailers: Microblogging, Video, Sharing, Photo Sharing, Search, Purely Social, and City/Regional Weekly.

I will identify the combinations for each delivery segment one at a time in the next three articles in Insulation Outlook. In the meantime, take a look at the sites in this article and try to understand what is really happening with each.

Notes

  1. Insulation Outlook: www.insulationoutlook.com/io/article cfm?id=IO091002
  2. Microgeist: microgeist.com/2009/04/the-10-types-of-social-media-sites-you-need-to-be-on-and-why/
  3. American Marketing Association: www.marketingpower.com/ResourceLibrary/MarketingNews/Pages/2009/43/11_30_09/Social_Media.aspx

For those for you interested in receiving a FREE copy of my Twitter Marketing Your Business ebook, please e-mail Twitter@DIRInc.us

Mechanical insulation and insulation in general are among the few industrially manufactured products that save more energy over their life span than is required for their manufacturing. The National Insulation Association (NIA) has estimated that mechanical insulation systems save more than 140 and up to 500 times more energy over their life spans (20 years for the purposes of this discussion) than it takes to produce them. This is based on performance comparison of surfaces with and without insulation. Mechanical insulation also saves a minimum of 150 (and up to 750) times more CO2 emissions than it takes to produce the insulation product. The data proves that mechanical insulation is a sustainable, green initiative that provides an unparalleled ecobalance.

Mechanical insulation systems are used for piping, equipment, vessels, ducts, boilers, and similar mechanical apparatus in commercial building and industrial applications. They perform thermal, acoustical, and personnel safety functions for piping and equipment in both hot and cold applications; heating, ventilating, and air conditioning (HVAC) applications; and refrigeration and other low-temperature piping and equipment applications.

A life cycle assessment (LCA) is used to systematically investigate the environmental impact of goods. The complete life cycle of a product is tracked “from cradle to grave.” All aspects of the product’s life are considered, including raw material production, energy usage, manufacturing, transporting, use, and disposal. Such ecobalances provide information on greenhouse gas emissions and the use of energy and raw materials, increasingly important in today’s environment.

While some manufacturers and associations have developed or are in the process of developing LCAs for their products, there is no universal guide to develop an Environmental Product Declaration (EPD). There is a growing demand for clarity and comprehensive information about the sustainability benefits of all products. In response, NIA prepared this analysis for mechanical insulation products.

Mechanical insulation is used across a broad spectrum of service temperatures from cryogenic to refractory applications, with the predominant usage between -40°F and 400°F. All insulation materials are used in a wide range of applications, including various ambient and pipe/equipment operating temperatures.

An average use profile for each product line is not yet available, and determining that information will require an extensive survey and research examining energy sources and cost, product logistics, and myriad other factors. For this analysis, NIA used data from companies and associations to estimate the LCA value range for the mechanical insulation industry, given the wide range of service applications, calculation methodologies, energy sources, logistic options, etc.

Construction and operation of commercial buildings and industrial facilities are among the most energy- and raw material-intensive industries. To meet the growing need for energy and protect the environment for future generations, increased energy efficiency/conservation should be considered a primary source for reducing energy use and emissions. Mechanical insulation is one of the most valuable keys to achieving those goals. It is relatively simple, cost effective, maintainable, and “shovel ready,” creating and preserving jobs now on a local basis across a wide array of industries. It is time to get excited about mechanical insulation.

Acknowledgements:
Appreciation is extended to the companies and associations that contributed to the estimates expressed in this article. The estimates were developed from the best information available at the time. Neither the National Insulation Association nor the contributors to these estimates guarantee the accuracy of the good faith estimate ranges contained herein.

The Environmental Protection Agency (EPA) on Monday, December 7, 2009—opening day of the 12-day international climate change talks in Copenhagen—formally declared CO2 and other greenhouse gases (GHGs) threats to public health and welfare. The move responds to the Massachusetts v. EPA U.S. Supreme Court decision in 2007 that found that GHGs fit within the Clean Air Act definition of air pollutants.

The so-called “endangerment finding” does not impose emission reduction requirements, nor does it trigger Prevention of Significant Deterioration (PSD) or Title V permitting. But it allows the EPA to finalize GHG standards proposed on September 15, 2009, for light-duty vehicles and to require large GHG-emitting facilities, beginning next spring, to incorporate the “best available methods” for controlling GHGs when planning to construct or expand.

The EPA had proposed a PSD and Title V GHG Tailoring Rule on September 30, 2009. If enacted, those regulations would require facilities emitting more than 25,000 tons of GHGs a year to obtain permits and demonstrate they were using the “best practices and technologies to minimize GHG emissions.” On December 7, EPA Administrator Lisa Jackson said that no timeline had been considered for the enactment of this rule.

From January 1, 2010, however, large emitters would be required to monitor their GHG emissions and be required in 2011—for the first time—to submit publicly available information to allow the EPA to track GHGs over time, she said.

The EPA’s proposed endangerment finding was first issued in April 2009. The announcement followed a 60-day public comment period and review of more than 380,000 comments, the federal agency said.

GHGs include CO2, methane, nitrous oxide, hydrofluorocarbons, perfluorocarbons, and sulfur hexafluoride. “Scientists in the United States and around the world have tracked in the last century—and in particular the last three decades—alarming increases in the amount of greenhouse gases in our skies,” Jackson said in a press conference. “That increase is deteriorating the natural balance in our atmosphere and changing our climate.”

In making the finding, “we relied on decades of sound, peer-reviewed, extensively evaluated scientific data. That data came from around the world and from our own U.S. scientists,” she said. The agency says on its website that this included “all of the scientific and technical information in the record,” though it relied primarily on “published, well-vetted climate change assessment literature. That information, including the recent assessment of the U.S. Global Change Research Program, released in June 2009, is summarized in the Technical Support Document.”

The data showed that “as a result of human activities, GHG concentrations in the atmosphere are at record high levels, and data shows that the Earth has been warming over the past 100 years, with the steepest increase in warming in recent decades.” The “evidence of human-induced climate change” went beyond “observed increases in average surface temperatures.”

Contesting the Science

Immediately after the EPA’s announcement, the Competitive Enterprise Group (CEI) a self-described “non-profit, non-partisan public policy group dedicated to the principles of free enterprise and limited government,” said it would file suit in federal court to overturn the endangerment finding. The suit would be filed on the grounds that “EPA has ignored major scientific issues, including those raised recently in the Climategate fraud scandal,” it said.

“EPA is clinging for dear life to the notion that the global climate models are holding up,” said Sam Kazman, CEI general counsel. “In reality, those models are about to sink under the growing weight of evidence that they are fabrications.”

“Climategate” refers to the scandal that broke in late November 2009, when a file containing more than 1,000 e-mails sent from or to members of the University of East Anglia’s Climatic Research Unit (CRU) in England was allegedly hacked and posted on the Internet. The e-mails reportedly discussed efforts to prevent certain research from being considered by the Intergovernmental Panel on Climate Change and to “hide” declining temperature trends from tree ring data that were contradicted by rising thermometer measurements. Climate change skeptics contend the messages are evidence that scientists have falsified data to exaggerate the threat of global warming.

Hearings regarding the controversy have already taken place in Congress—and several more are planned. On December 2, 2009, the House Select Committee on Energy Independence and Global Warming grilled White House Office of Science and Technology Director John Holdren and Jane Lubchenco, administrator of the National Oceanic and Atmospheric Administration. Both downplayed the significance of the CRU e-mails and documents.

Holdren said that the documents had yet to be fully analyzed but added that “There is, and there will remain after the dust settles in this current controversy, a very strong scientific consensus on the key characteristics of the problem [of climate change].” Lubchenco said that “the e-mails do nothing to undermine the strong scientific consensus and independent scientific analysis of thousands of scientists around the world that tell us the Earth is warming, and the warming is largely a result of human activities.”

EPA Administrator Jackson, meanwhile, testified separately on December 3 to the Senate Committee on Environment and Public Works that the e-mails did not undermine the scientific consensus on anthropogenic climate change, a claim she repeated at the press conference on Monday.

The controversy has also prompted congressmen—most of whom are Republicans—to formally investigate the climate science, indicating a long and contentious haul ahead for the EPA’s endangerment finding.

Most recently, representatives Darrell Issa (R-CA), John Barrasso (R-WY), F. James Sensenbrenner (R-WI), and David Vitter (R-LA) wrote to the EPA administrator asking that the agency withdraw its proposed regulations for controlling GHG under the Clean Air Act until it can demonstrate that the science is sound.

Sen. James Inhofe (R-OK), ranking minority member of the Senate Environment and Public Works Committee, has also asked Committee Chair Barbara Boxer (D-CA) to hold hearings on whether there was a concerted effort to manipulate climate science. Boxer is looking into the controversy.

Reactions

The endangerment finding on December 7 prompted a flurry of statements.

Some groups were silent: The U.S. Chamber of Commerce, which had earlier threatened to sue the EPA if it did not have a public debate on climate change science, did not issue a statement. Neither did the U.S. Chamber Climate Action Partnership, the group of businesses and environmental organizations responsible for the cap-and-trade blueprint on which the bill that passed in the House this summer was based.

Others were outright unexpected: The Alliance of Automobile Manufacturers—opponents of climate regulation—welcomed the finding. “Automakers recognize the need to reduce CO2 emissions from new autos,” said Charles Territo, spokesperson for the 11-member alliance, adding that it remains committed to the national standards announced by the Obama administration last May.

The American Coalition for Clean Coal Electricity said that the ruling underscored the need for “sensible climate legislation.” The coalition of coal companies and utilities added: “We believe that regulating greenhouse gas emissions under the statutory authority of the Clean Air Act is not the preferred course.” The key was to bring new technologies to the marketplace, it said.

America’s Natural Gas Alliance President and CEO Regina Hopper said, meanwhile, that the gas group supported the “nation’s goal of reducing greenhouse gas emissions in the United States and around the world, and we believe that natural gas can play a critical role in advancing solutions that are favorable to our nation’s economy, energy security, and low-carbon future.”

Sources: EPA, House Select Committee on Energy Independence and Global Warming, Senate Committee on Environment and Public Works, AAM, ACCCE, ANGA.

Used with permission of POWER Copyright©2009. All rights reserved.

Proponents of Building Information Modeling methodology say that, by using BIM objects and virtual design/construction methods to design, manage, and store and update all the files related to a construction project, companies can save time, improve efficiencies, and keep better records. Here’s a look at how the technology offers benefits to several of the key participants in the construction process: building owners, architects, building product manufacturers, and, of course, general contractors.

According to a January 13, 2000, article in the Economist titled “New Wiring,” the estimated annual cost of inefficiencies and delays in the U.S. construction industry is about $200 billion. That’s almost one-third of the more than $650 billion spent on construction each year in the United States.

At the Construction Management Association of America’s Web site, the numbers are similar. The association claims that 30 percent of the money spent on construction in the U.S. each year goes to cover delays and inefficient work processes.

So what does all this talk of wasteful spending have to do with Building Information Modeling or BIM?

Proponents of the methodology say that, by using BIM objects and virtual design/construction methods to design, manage, and store and update all the files related to a construction project, companies can save time, improve efficiencies, and keep better records. The entire scope of a project—from design, scheduling, and costing to contracts, purchase orders, change requests, as-builts, and completion—is all reliably and digitally coordinated.

BIM for building owners

It’s not hard to see why building owners have much to gain from these new methods of digitally managing the construction process:

  • Better informed decisions regarding specifications and costs at the design stage
  • Fewer design changes as construction gets underway;
  • Less waste and fewer delays;
  • Better scheduling of trades and materials;
  • Accurate as-builts for future facility management
  • Improved communication throughout the process
  • Better documentation for LEED accreditation.

In an article from U.S. Construction Management Association of America on the Daily Commercial News website: “Use of building information modeling accelerates: CMAA study,” the author points out that “more than a third of the construction project and program owners responding to the Eighth Annual Survey of Owners…say they have used Building Information Modeling (BIM) on one or more projects.”

BIM for architects and building product manufacturers

For architects and building product manufacturers, the push is on right now to create data-rich 3D BIM objects for every building product, in order to make specifying products for large institutional, commercial, and industrial building projects faster and more precise.

To meet that need, Reed Construction Data introduced software to the market that has the potential to be the best and only bridge between the designers/specifiers who choose building products and the people who sell those products.

Of course, building modeling and 3D visualization isn’t new, but Reed’s platform takes BIM to the next level. In short, the system allows designers to use BIM objects in their workflow, then manage and store them in a conveniently accessible way. But it’s the information that platform can attach to the objects—specifications and costing, for example—that marks a huge leap forward for the North American construction industry.

The Reed BIM software means that building product manufacturers are able to create “virtual” versions of their products—a floor or a lighting system, for example—with all of the specification data attached, including standards, dimensions, costs, etc. The system works seamlessly with Autodesk Revit, too.

Because architects can create a BIM library of the products they use in their drawings using the software, building product manufacturers who have BIM models of their products available on the platform should have an advantage when it comes to being sourced, selected, and specified.

There’s more—once a building product is specified, the specification can be used to create quantity take-offs and pricing schedules. That information then becomes part of the contract documentation with the general contractor, ensuring that the specification does not change down the road and substitutions are not made without communication.

BIM for general contractors?

Expertise with BIM will give general contractors a competitive advantage in the marketplace, particularly in the early stages of its adoption.

Many of the advantages to the building owners also apply to the GCs, too. In a Construction Management Association of America white paper called “Building Information Modeling and the Construction Management Practice: How to Deliver Value Today” (http://cmaanet.org/bim_article.php), authors Soad Kousheshi, P.E., and Eric Westergren, write:

“The potential advantages (of BIM) span a wide range of outcomes including a better tool for design and engineering documentation and analysis, more robust cost estimating, improved trade co-ordination, optimized means and sequence of work, a powerful communication tool for design intent and construction plan, and an information rich as-built model for facilities management.”

General contractors who get in on the ground floor have much to gain from understanding and applying this new technology.

For an analysis of the potentially far-reaching impact of Reed’s BIM platform on the construction industry, read Tectonic Purchase Creates a New Direction for Construction by David Worlock, Chief Research Fellow with Outsell, Inc., of London, UK.

Source: Construction Management Association of America, March 2008.

Do you know how much money your facility spends annually for purchased energy and utility equipment maintenance? Is it $2 million, $5 million, $10 million? Would reducing those costs by 5 or 10 percent interest you? This article offers unique ideas about how to effectively reduce site energy and utility costs in these times of limited resources and frozen budgets.

Energy management is not a new concept. The United States has gone through several supply shortages and price spikes since the 1970s. Accordingly, many large companies implemented energy programs and reduced their costs significantly. In the past 8 years, though, energy costs have again increased 30 to 50 percent (even more in some regions). Energy has become a major part of indirect operating expenses, compared to earlier times when it accounted for just 5 to 8 percent of the operating budget. This trend is expected to continue, on average, increasing 2 or 3 percent per year for the next several years.

Environmental and energy advocates tell us the United States must move away from carbon-based energy sources—coal, oil, and gas—to effectively manage budgets, mitigate environmental challenges, and sustain our standard of living; yet 45 percent of our energy is provided by coal and 28 percent by oil and gas. It could take 30 years to displace many of the nation’s aging coal-fired utility power stations—the major source of CO2, NOX, and SO2 pollution. All the while, the Organization of the Petroleum Exporting Countries (OPEC) continues to control energy prices by manipulating global oil supply.

The United States must become more energy independent and carbon-free. As 4 percent of the world population, we consume 26 percent of the energy, a proportion that is growing each year. Commercial and industrial facilities that consume large amounts of energy need to concentrate on demand-side issues.

Accountability

For energy and utility systems, it is rather straightforward: The manager in the corner office should have demand-side energy conservation as a measurable performance objective (i.e., pay is partially based on a continued energy and environmental improvement program). This helps incentivize the organization to commit its scarce resources.

Energy and utility equipment challenges have increased for many facilities, partly due to corporate short-term operational strategies, cost reduction programs, and reduction-in-force policies brought about by conflicting political, environmental, and financial policies. High wages and benefits in the United States have affected our competitiveness in the world economy. To compensate, companies have automated and eliminated jobs, or relocated offshore. Utility equipment in some mature facilities has fallen in need of rebuild or upgrade.

The U.S. Department of Energy (DOE) reports that declining maintenance services, poor equipment reliability, and the need for employee training are among the most frequently identified causes of energy waste.

Are you keeping abreast of technological changes, new products in the energy industry, and the operational integrity of your equipment?

Beginning the Search for a Solution

The number of companies selling energy management services these days is staggering. Every week we hear another energy-strategy buzzword: carbon footprint, sustainability, “green” buildings, LEED, stimulus funds, buy versus save, cap and trade, etc. Perhaps U.S. commerce and industry should look inward and reduce their carbon-based energy appetite rather than accept market manipulation and federal oversight.

Rather than spending time trying to package sound energy conservation issues into a new, more palatable management concept, focus on education. Energy conservation is a well-established industry, and energy programs have been well documented since the early 1980s. Information is readily available on the Internet—start by trying some of these programs. The DOE has a list of the 100 most often identified energy conservation measures on its website. For mature operating facilities, it just takes a trained eye to review some energy data, check over the DOE list, and conduct a brief assessment. Then, prioritize and get busy. Or you can hire a Certified Insulation Energy Appriaiser for a complete audit.

The new carbon-free technologies (e.g., wind, solar, geo-thermal) will not pass economic muster in most for-profit companies over the short term. Companies should be careful about considering huge energy projects. In these slow economic times, big capital projects are few and far between. Moreover, if a facility was built after 2000, new ASHRAE/DOE building codes should have resulted in energy efficiency, and many of the newer conservation measures (such as efficient motors and controls upgrade) may not apply.

The Concept

Mature facilities may need to get back to the basics—e.g., operational reliability, operator training—and evaluate some of the new products with excellent returns, such as insulation upgrades. One approach used successfully in the 1970s was to require personnel to have 1 of every 10 issues on their project list be an energy conservation item—even a small one. In today’s environment, 2 of every 10 items may be a better plan. Facilities need to commit to continuous improvement. Demand-side energy conservation is everyone’s job. We must modify wasteful habits developed in the 1960s and ’70s “throw-away” society, when energy was bountiful and cheap. Do you leave the lights and TV on at home when you leave the house? The same conservative logic should apply throughout an organization.

The job needs to be approached rationally. Staff should key in on the boss’ priorities—and cost control is Number One. How can Btus be turned into dollars? There are usually a few “low-hanging fruit” energy savings and utility improvement items that can be implemented without project managers, consultants, and major capital initiatives. A few successful small projects will gain some credibility. With 10¢ power and $7 fuel, there are several issues around the facility that should have lower than a 2-year return on investment (ROI), including boiler efficiency, insulation work, leak repairs, and new controls. These are some of the same items from the 1980s, but the difference now is that engineering and maintenance staff are no longer available to handle many routine improvements. With downsizing, operational reliability has begun to slip. Left unattended, equipment and systems will degrade in performance. Experienced help may be needed. Numerous contractors specialize in energy systems improvements.

The Team

Management will need to communicate with employees, ask for their assistance, and get them involved. One idea is to organize an informal Energy Awareness “Alpha Team” to meet at lunch and generate ideas. Outstanding contributions can be rewarded with tickets to a community activity or a U.S. Savings Bond. There must be environmentally conscious folks in the organization. Some may even have noticed an excessive number of compressed air leaks or workers leaving office lights on at lunchtime. A few may volunteer to be on an Alpha Team if management makes a firm commitment and pays for the sandwiches and chips.

The adage that one cannot “eat an elephant in one sitting” is relevant here. Small and continuous progress will sustain employee interest, produce good results, and please the management team. For larger projects, a lack of technical resources should not be a reason to do nothing. Get some help to lead the program if needed.

Proven energy projects and utility equipment optimization can bring more profit than selling an equal amount of a company’s products. The challenge is to identify these opportunities. The extent of resource commitment can be easily estimated.

The Goal

Energy and utility costs are usually summarized in a section of the financial monthly closing statement. It takes only a few minutes to compare energy costs to total manufacturing or operating costs. Energy may be 60 to 80 percent of the maintenance and utilities budget. It also may be 25 to 40 percent of the site’s overall operating budget. If these benchmark comparisons are known, it is easier to determine potential savings and extrapolate a reasonable level of resource commitment.

Figure 1 can be used to estimate a facility’s potential savings. For smaller facilities, $50,000 to $100,000 savings can justify a limited resource commitment. For larger operations, $500,000 to $1,000,000 of annual savings would be a major success. Again, management must be committed, employees should be including energy awareness in their daily activities, and those with exceptional ideas should be rewarded. A 5-percent employee participation rate is typical.

The Plan

The tried-and-true energy projects of yesteryear are still good ideas today: insulation; boiler efficiency; compressed air systems; pipe and duct insulation; steam and air leaks; electric demand control; efficient motors; Variable Speed Drives; lighting upgrades; Heating, Ventilating, and Air Conditioning (HVAC) optimization; synthetic lube; belt drives; and pumps and fans. Many of these will produce excellent results (less than 2-year ROI) with today’s higher energy supply costs. In regions where power costs are 12¢ to 18¢, many electrical projects can produce an ROI of less than 1 year.

For facilities with fuel costs of $7 to $9, boiler efficiency and insulation improvements produce an ROI of 6 to 24 months. Any process that operates above 250°F should have the insulation inspected annually. An inexpensive ($250) infrared gun can be used to conduct a brief survey. If surface temperatures exceed 130°F, then repairs are in order. A list of repairs should be developed, and an insulation contractor should handle the work. There should be NO poorly insulated steam or condensate piping, valves, or fittings in the facility. The same goes for gas and electric heated process system ducting and pressure blower piping. In air-conditioned bays, the savings can be double.

This brief questionnaire can be helpful in assessing an energy program:

  1. Energy Policy: Is there a published energy plan and objectives?
  2. Identified Sponsor: Is someone designated as the energy coordinator?
  3. Energy Bills: Are bills reviewed by a technical person (not just the Accounting Department)?
  4. Accountability: Is management held accountable (energy cost control is one of their personal objectives)?
  5. Ongoing Repair Work: Do facilities personnel have an active repair program for leaks, insulation, air filters, steam traps, lighting, etc.?
  6. HVAC, Lighting, and Office Equipment: Is there a published policy for how this equipment is operated and controlled?
  7. Data Monitoring and Reporting: Are costs and usages reported regularly—quarterly at minimum—to technical personnel for review and critique?
  8. Employee Involvement: Is there a newsletter or program that encourages employees to help and rewards exceptional ideas? Have their training needs been investigated?

Getting started requires old-fashioned legwork: Facility personnel need to get help from a trained eye and dig in.

Getting Started

The following is a checklist for getting started:

  1. Develop a one- or two-page energy plan
  2. Obtain management approval to delineate energy and utility costs
  3. Quantify those costs compared to total operating costs
  4. Assume that a 10-percent annual savings is possible
  5. Get employees involved and develop some ideas
  6. Separately identify and prioritize electrical and thermal opportunities
  7. Tackle the four or five best projects and validate the results

Within a few months, a culture shift may begin to occur—you could be pleasantly surprised.

This more casual approach should produce some excellent results, and a more formal energy program can be implemented later.

One note of caution: One must be sensitive to “turf” issues with those responsible for facility systems and the energy program. A good approach may be offering to help economically justify some of their backlogged energy projects.

Figure 1

Energy management investments can provide some of the best returns on investment (ROI) available to building owners. Energy efficiency improvements become permanent cost reductions for buildings and therefore are more important than the short-term gain of getting a better energy commodity price. To maximize energy management benefits, both supply-side and demand-side strategies should be pursued.

The standard method for evaluating an energy management investment (like insulation) is to use capital planning measurements like simple payback period, ROI, and net present value (NPV). An additional financial tool is asset appreciation, since the cash added to the bottom line of a business increases the value of the asset by a factor of 10 or more. If a $450,000 energy management investment yields a 3-year simple payback, then the ROI is 33 percent. The $150,000 in annual energy savings (cash via cost avoidance) also increases the value of the asset for sale or refinance by a factor of 10, making the additional cash flow (pretax profit) worth $1,500,000 in asset appreciations.

A better facilities management strategy is to consider the total benefits and cost of an investment over the effective lifetime of a project. If a lighting retrofit needs replacement lamps in 3 years, then that project life-cycle cost needs to reflect the true cash flow of the investment. If a given insulation project has an effective lifetime of 25 years, then the financial model needs to reflect its lifetime contribution to the organization long after the simple payback (break-even) period has passed. While this concept seems simple, some financial analysts need to be shown the cost savings after the break-even period. A simple bar graph, as in Figure 1, can illustrate the long-term energy cost savings.

The Sustainable Building Technology Manual, written by Public Technology, Inc., in cooperation with the U.S. Green Building Council, the U.S. Department of Energy (DOE), and the Environmental Protection Agency (EPA), is a no-cost reference manual on life-cycle costing and energy. The National Institute of Building Sciences has the publication on its website at www.wbdg.org/ccb/browse_doc.php?d=4156. One of the facts of building life is that the capital cost of purchasing a building system is only a very small percentage of its true life-cycle cost. For example, the life-cycle cost of an electric motor running three shifts in an industrial plant is 2 percent for the capital investment and 98 percent for the energy consumed. Therefore, paying a slightly higher cost for a premium-efficiency motor pays for itself many times during the life of the motor. The extra cost of a premium motor—or premium industrial insulation—is an attractive investment over the life of the investment.

This understanding of life-cycle cost (plus environmental impact) is the foundation of the “green” movement worldwide. Over the life of a building, energy use affects the profitability for the building owner, as well as the building’s contribution to environmental pollution. Since energy is lost in transmission, the real environmental and natural resources cost is much higher than most people think. The thermal losses and transmission/distribution of energy generally waste more than half the original fuel Btu content. See Figure 2 for a look at energy transmission/distribution losses.

What about Value Engineering (VE)?

The Society of American Value Engineers (SAVE) (value-eng.org) was formed in 1959 as a professional society dedicated to the advancement of VE through a better understanding of the principles, methods, and concepts involved. Now known as SAVE International, it has grown to over 1,500 members and currently has more than 350 active Certified Value Specialists (CVS) in the United States. Requirements for registration as a CVS were developed by SAVE at the request of the U.S. General Services Administration (GSA) in the early 1970s. VE can be applied at any point in a project—even in construction. Typically, however, the earlier it is applied, the higher the return on the time and effort invested. The three main stages of a project and VE’s application are described in Figure 3.

The chart in Figure 3 illustrates that the apparent “savings” from value engineering (VE) starts to disappear as soon as the building moves into its operational phase. While an Architect/Engineer (A&E) may be considered a hero during the design phase for finding a cheaper way of doing something, that A&E does not have to live with the building and its higher operating cost for the next 20, 40, or 60 years. Most of the time, the focus on “first cost” versus “life-cycle costs” is a poor investment.

Net Present Value

The capital planning tool of NPV considers the time value of money when an investment is made, versus a rhetorical investment of the same funds earning an assumed rate of return (see Figure 4).

As a result, the NPV model will demonstrate whether a given investment today (or a premium level of investment) makes good economic sense. The trick to the model is that future savings are discounted since they are not in hand today, meaning that they are worth less. If the NPV calculation results in a positive number, (a) it beats the company’s hurdle rate for internal rate of return (IRR) and (b) the investment is worthwhile. Figures 5, 6, and 7 demonstrate an NPV model.

This model assumes that the cost value of the thing saved (e.g., natural gas) will cost the same thing in the future as it does today. The more advanced NPV model will factor in the higher value of the energy units saved in future years based on the rate of inflation and energy cost increases. This is very significant now as natural gas prices are depressed in the near term and will increase in future years, as documented in the NYMEX futures market. This conservative look at natural gas prices does not include any hurricanes in the Gulf of Mexico, problems in the Middle East, Wall Street traders working the commodity markets, and other unknown factors. Clearly, the cost of natural gas, oil, and electricity will increase in future years faster than the rate of inflation.

Simple Question

Is this plant, facility, or business going to be here in “X” years? If the answer is yes, then the proposed investment in energy efficiency should make sense. Most people will answer yes without any concrete facts on which to base their opinion.

Manufacturing plants and commercial buildings of all types tend to be used for 50 years or more. If a plant expects to be operating for the next 20 years, then the simple payback period of 3 years versus a desired 2-year payback period should not be a deal killer. Simply stated, plants, facilities, and buildings are long-term investments; therefore, the period for energy savings is also long term.

While every financial analyst will run his/her own investment analysis, it is helpful to provide an illustration of the payback period, simple cash flow chart, ROI, NPV calculation, and asset appreciation for each insulation proposal. An extra hour of proposal time using Microsoft Excel should help your proposal get serious attention and an energy management investment.

Resources

While there are many guides to life-cycle cost analysis on the Internet, the DOE provides free software tools to run the analysis at www1.eere.energy.gov/femp/program/lifecycle.html. The same website lists a 2-hour online class on life-cycle cost analysis and a 2-day class on using the Building Life-Cycle Cost (BLCC) Programs. Handbook 135 (PDF 9.2 MB), the Life-Cycle Costing Manual for the Federal Energy Management Program (FEMP), explains in detail the principles of life-cycle cost analysis and integrates them with the FEMP criteria.

Figure 1
Figure 2
Figure 3
Figure 4
Figure 5
Figure 6
Figure 7

2009 is coming to an end, and for most of you that means the end of your fiscal year as well. Don’t let the holiday season frenzies cause you to neglect year-end business affairs. Here is a handy checklist of some things you need to consider.

  • Schedule your annual corporate meetings for shareholders and directors; give notice in accordance with your bylaws/code of regulations; set the agenda for the meeting.
  • Review your corporate minute book to make sure it is up-to-date; are last year’s minutes in there and are they signed? Did the minutes call for certain actions to be taken during the year and have these items been accomplished?
  • Has there been a change in the officers, directors, or shareholders? Do the corporate records reflect those changes? Do others need to be elected?
  • Are there shares of stock needing to be transferred or canceled? Is your share ledger in the back of the minute book up-to-date?
  • Is the statutory agent designated to receive important papers current and on file with your state’s Secretary of State? (Check your state’s website.)
  • Is your corporation in good standing with your state? (Check your state’s website.)
  • Is the corporation doing business in any other state? Is it appropriately registered and meeting the requirements to do business in those states?
  • Is the annual financial report, including a balance sheet, statement of profit and loss and surplus, and an opinion of the financial position of the corporation being prepared?
  • Do the corporate records verify payments of salaries versus bonuses and dividends? The IRS can contend that payments to corporate officers or employees or shareholders are not deductible dividends and that payments to its officers who are not shareholders are not deductible, so you should ensure the proper classification of such payments by identifying the payments as deductible compensation and consider identifying the justification.
  • If no, or nominal, dividends are to be paid, and your corporation has a large amount of accumulated earnings, do the minutes include a statement of the reasons why the earnings are being retained?
  • Have you changed financial institutions during the year and not noted it within the corporate records? Are those authorized to sign checks still the appropriate names, and are the appropriate corporate resolutions contained in the minute book?
  • Do you have a buy/sell agreement that regulates and restricts the transfer of shares so you don’t end up with an unwanted “business partner?”
    Have you updated the valuation information that sets the price for which shares are repurchased? Has the buy/sell agreement been amended to include new shareholders?
  • Are your benefit plans—such as retirement, profit sharing, medical reimbursement, Section 125 or 401(k) plan—appropriately documented within the corporate records and in full compliance with the law? Are the summary plan descriptions you give to employees up-to-date?
  • Have you consulted with your CPA regarding year-end matters, such as tax incentives for equipment purchases that you may wish to take advantage of before year-end?
  • Have you evaluated the cost of your workers’ compensation program? Have you shopped for enrollment in a workers’ comp group that provides good savings (discounts) and effective third-party administration? Have you gone online and looked at your claims history to identify your major claims? Have you met with your workers’ comp attorney to devise a plan to eliminate costly claims from your experience and reduce your premiums?
  • For key employees hired this year, do you have employment agreements in place addressing such things as non-disclosure of confidential information and non-competition? It’s not too late.
  • Have you reviewed your general liability insurance and other business coverage with your agent to ensure proper, cost-effective coverage?
  • Are your licenses to do business in various locales current?

Dust off those corporate records and make sure that everything is ready for 2010. If you need legal assistance in your business affairs, contact Bob Dunlevey at Dunlevey, Mahan & Furry at 937-223-6003.

An in-depth insulation energy audit is a perfect service to add instant value to your company and provide immediate profits to your customers. A Certified Insulation Energy Appraiser’s audit can pinpoint areas for improvement in a plant or facility often overlooked in traditional insulation maintenance programs. These areas can provide enormous energy savings!

For example, Photos 1 and 2 show un-insulated steam valves and one 90-degree elbow. They are installed high off the ground, eliminating a personnel hazard, and condensation is not an issue, so these areas went unnoticed for years. Installing 2-inch-thick fiberglass insulation saved the customer $216 and 41,000,000 Btu per year. By itself, it may not appear that exciting, but consider how many steam valves, unions, and other fittings are un-insulated in the same facility: 50, 100, 1,000? Depending on the facility’s size, the savings quickly become impressive.

To further illustrate the benefit of insulation on the “forgotten” parts of a facility’s mechanical system, a recent audit was performed for a major university as a primer for future energy projects. One mechanical room contained 33 un-insulated steam valves. The facility managers wanted accessibility to the valves for maintenance reasons, so instead of fiberglass pipe insulation, removable insulated blankets were fabricated with ceramic insulation. In that one mechanical room, the university saved over $13,000 and 431 million Btu per year, with a payback period of 2.5 months.

Another audit performed in a maximum security facility uncovered substantial savings from just repairing insulation or adding thickness. Over 2,200 feet of steam piping from 1/2 in. to 14 in. was found to have damaged or partially removed insulation, as well as insulation not thick enough for the system. After correcting those problems, the facility is realizing savings over $24,000 and 5.3 billion Btu per year. The return on investment for this project was estimated at just under 1 year; however, follow up with the facility put the actual payback at 6 months.

At a manufacturing plant, an energy audit uncovered savings from repairing an existing steam loop 20 feet in the air with multiple drops to machinery on the floor. Most of the steam piping installed 8 feet and below was damaged from foot and forklift traffic and presented a substantial burn hazard for employees. On the high portion of the loop, simply repairing fiberglass and insulating valves was needed. Closer to the floor, calcium silicate insulation with an aluminum jacket was used to better protect the insulation from damage, also resulting in fewer hot pipes accessible to employees. The savings amounted to just over $64,000 and 9.9 billion Btu per year. Not only did this audit pinpoint and eliminate a huge safety hazard, but it also provided a 6-month payback period.

For customers in heavy industry, the savings can be amazing. An audit was performed on two large hot storage tanks with a history of problems maintaining temperature, resulting in an inconsistent product. Fiberglass 2 in. thick with aluminum jacket was figured for the sides and tops of both tanks. Each tank was over 100 feet in diameter, so the savings added up quickly. In one year, this facility’s savings was $2,300,000 and 214 billion Btu. Imagine walking into a customer’s site and being able to add $2.3 million to their bottom line year after year.

As more facilities strive to become greener, an energy audit can also help eliminate substantial amounts of greenhouse gases from production processes. In April, the Environmental Protection Agency formally declared that carbon dioxide (CO2) and five other greenhouse gases are pollutants that threaten public health and welfare. A Certified Insulation Energy Appraiser’s main tool, the 3E Plus® program, can determine emissions savings from CO2, NOx, and CE. As an example, the case studies above save over 26 million pounds of CO2 per year.

The first step to find a Certified Insulation Energy Appraiser in your area is to visit the National Insulation Association’s website (www.insulation.org). Under the “Insulation Training & Resources” title is a link to the Insulation Energy Appraisal page. From there, you can click on a prompt to search for an appraiser by state, country, name of appraiser, or company name. Certified Insulation Energy Appraisers have passed a thorough, 2-day class with in-depth training on the 3E Plus® program, conducting on-site inspections, collecting and analyzing data, and presenting the information to the customer.

Once on site, appraisers typically meet with the facility manager to discuss the audit. Topics should include:

  • System or systems to audit
  • Goal of the audit (process control, safety, pure energy savings, or a combination)
  • Safety concerns for the auditors—particularly important if the facility is operational at the time of the audit
  • Facility specifics (type of fuel, operational hours, boiler efficiency, ambient temperature, etc.)
  • Blueprints (especially useful if the system is already insulated)

A detailed energy audit can mean days of inspection and data collection. The more accurate the information gathered up front, the more accurate the data presented to the customer.

Two key tools that go above and beyond the normal instruments required to do a detailed “take-off”: a laser temperature gun and a thermal imaging camera. The temperature gun can provide the appraiser instant feedback on the true temperature of the system, as well as quickly and easily finding thin spots in existing insulation. Thermal imaging cameras can take a snapshot of an area to quickly pinpoint where the heat is escaping. Thermal imaging pictures create wonderful “before” and “after” pictures to visually prove the power of insulation.

Once all the data is collected, the appraiser starts the energy savings calculations in the 3E Plus® program. The training the appraiser has received will allow him or her to present the customer with a detailed report on:

  • Amount of Btu loss (or gain) on current versus insulated systems
  • Environmental impact, in terms of reduced greenhouse gas emissions
  • Dollars saved per year if properly insulated
  • Return on investment.

The detailed report should be well written, containing neatly labeled pictures of problem areas (with thermal images, if available). Depending on the relationship with the facility manager, the report should be sent up the chain of command, preferably to the director of capital projects or a chief financial officer. The more people with authority who see the report, the better the chances that the recommendations will be implemented.

Of course, presenting an energy savings plan can encounter obstacles, including:

  • Fluctuating cost of fuel
  • Low cost of fuel increasing payback periods
  • Customer resistance to releasing fuel costs or other information to appraiser
  • Btu and dollar savings are so high that customer becomes skeptical.

Every obstacle is a chance for the appraiser to show his or her training and experience in the insulation field, as well as how professionally obstacles can be overcome. For example, the appraiser can quickly overcome the first two obstacles listed above by creating a fillable PDF form that allows the customer to enter his own fuel cost. With the correct math loaded into the form, the payback period can adjust automatically with the rising and falling of fuel prices. The customer can put hypothetical figures into the document, making it completely dynamic, instead of a printed report with outdated information.

When the customer refuses to give specifics about the facility environment (or does not know the details), the Internet is a great resource to find average fuel costs, average wind speed and temperature, and historical averages of many other variables.

Some appraisals that uncover remarkably high savings may encounter skepticism from facility personnel, especially when the payback timeline is short. Again, with a little software knowledge, the appraiser can create a form that displays the potential Btu savings. All the customer needs to do is enter the fuel cost. The facility’s engineers can verify the math and run the calculations themselves, if need be. The ultimate skeptic may not believe the appraiser’s Btu savings calculations. If that is the case, the appraiser can provide the facility with a detailed take-off from the on-site inspection and have the engineers run heat loss calculations according to ASTM C680 (the same standard the 3E Plus program uses). Generally, if the appraiser has a good working relationship with the facility manager, and a proven track record of performance on site, such measures will not need to be taken.

The Insulation Energy Appraisal Program is a wonderful tool to offer customers. The power of insulation presented in a detailed energy appraisal can help all facilities, small or large, increase their bottom line and decrease their environmental impact.

Figure 1
Figure 2