Category Archives: Global

How insulation professionals can move from knowing their value to proving it—and persuading others

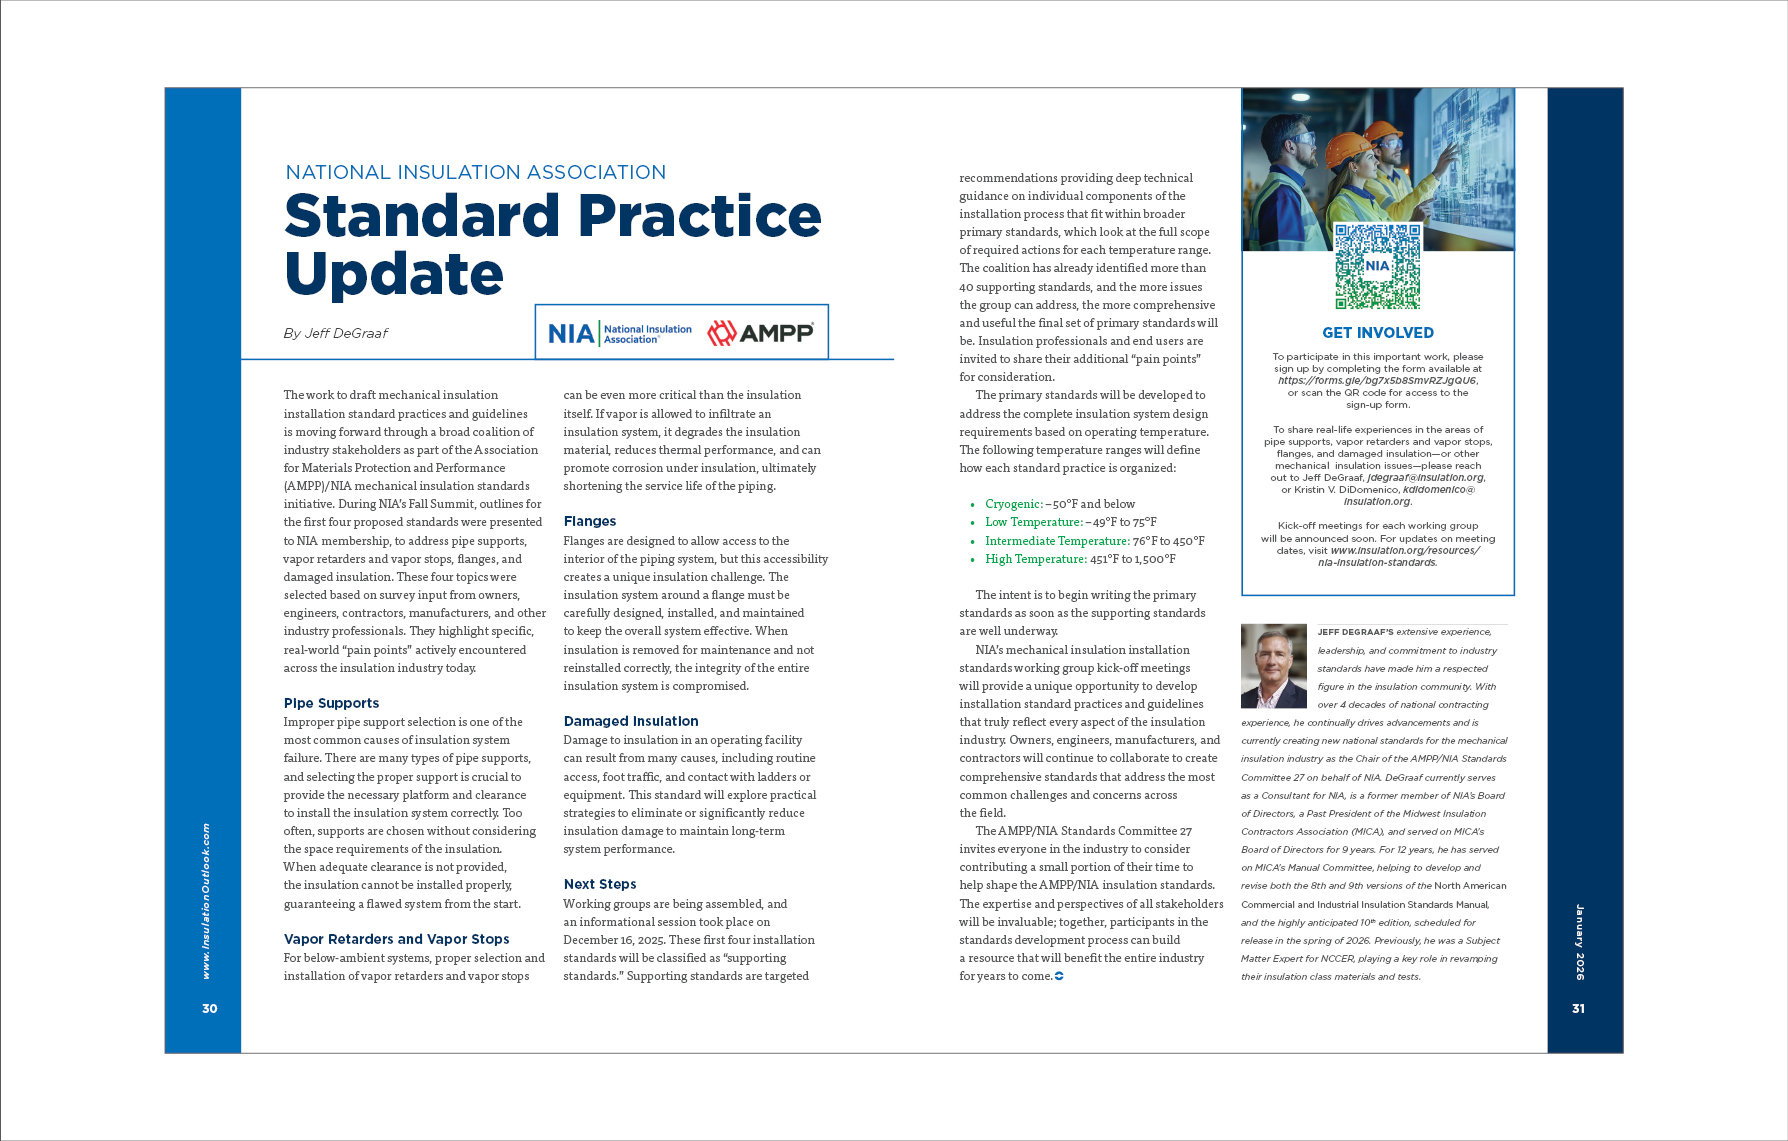
Mechanical insulation has long been one of the most effective tools for improving building performance. It reduces energy loss, controls moisture, protects equipment, and extends the service life of mechanical systems. Few building components deliver such a strong combination of energy savings, risk mitigation, and durability with such a short payback period.

Within the mechanical insulation industry, these benefits are well understood. They have been reinforced through decades of field experience, engineering guidance, and operational data. Insulation professionals know that when systems are properly insulated, buildings and systems perform better, last longer, and cost less to operate.

What is changing now is not the value of insulation, but the environment in which that value must be communicated.

Design-build delivery is becoming the dominant construction model. Energy codes are evolving into carbon-performance frameworks. Owners, investors, and regulators increasingly expect verification, documentation, and measurable results rather than assumptions. In this environment, insulation is no longer just a supporting system, quietly doing its job in the background. It is becoming central to energy efficiency, emissions reduction, risk management, and long-term asset performance.

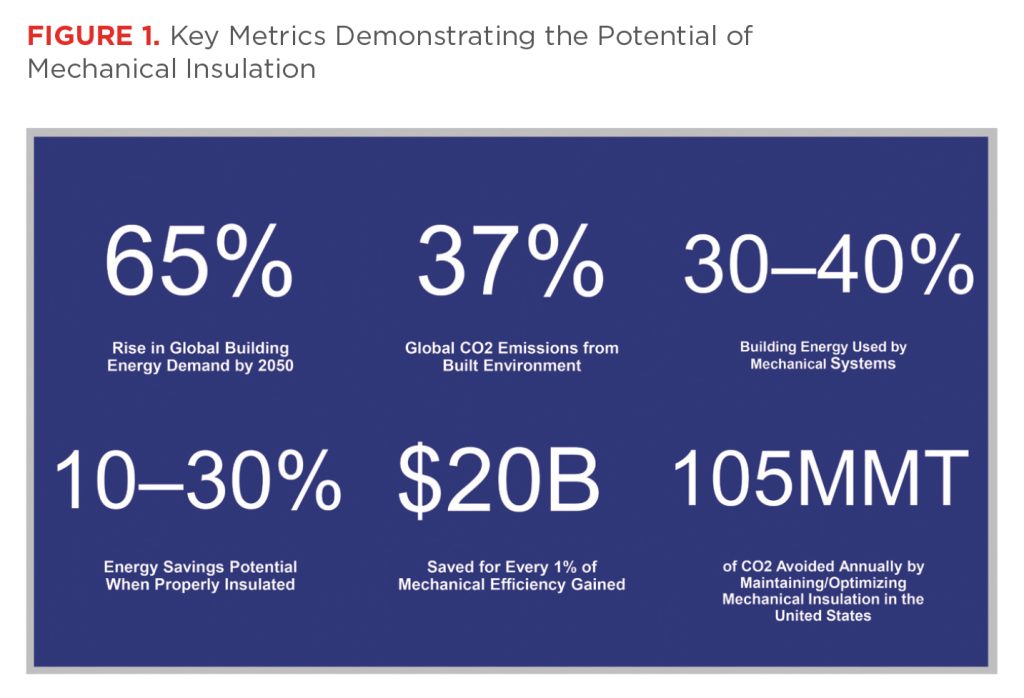
The opportunity facing the mechanical insulation industry today lies in translating the value of insulation clearly and convincingly to the people who define project priorities. This article explores how design-build delivery, decarbonization imperatives, and performance verification are reshaping the role of mechanical insulation—and how insulation professionals can carry that story into broader conversations where decisions are actually made. Figure 1 offers an overview of key trends and statistics at the foundation of the discussion.
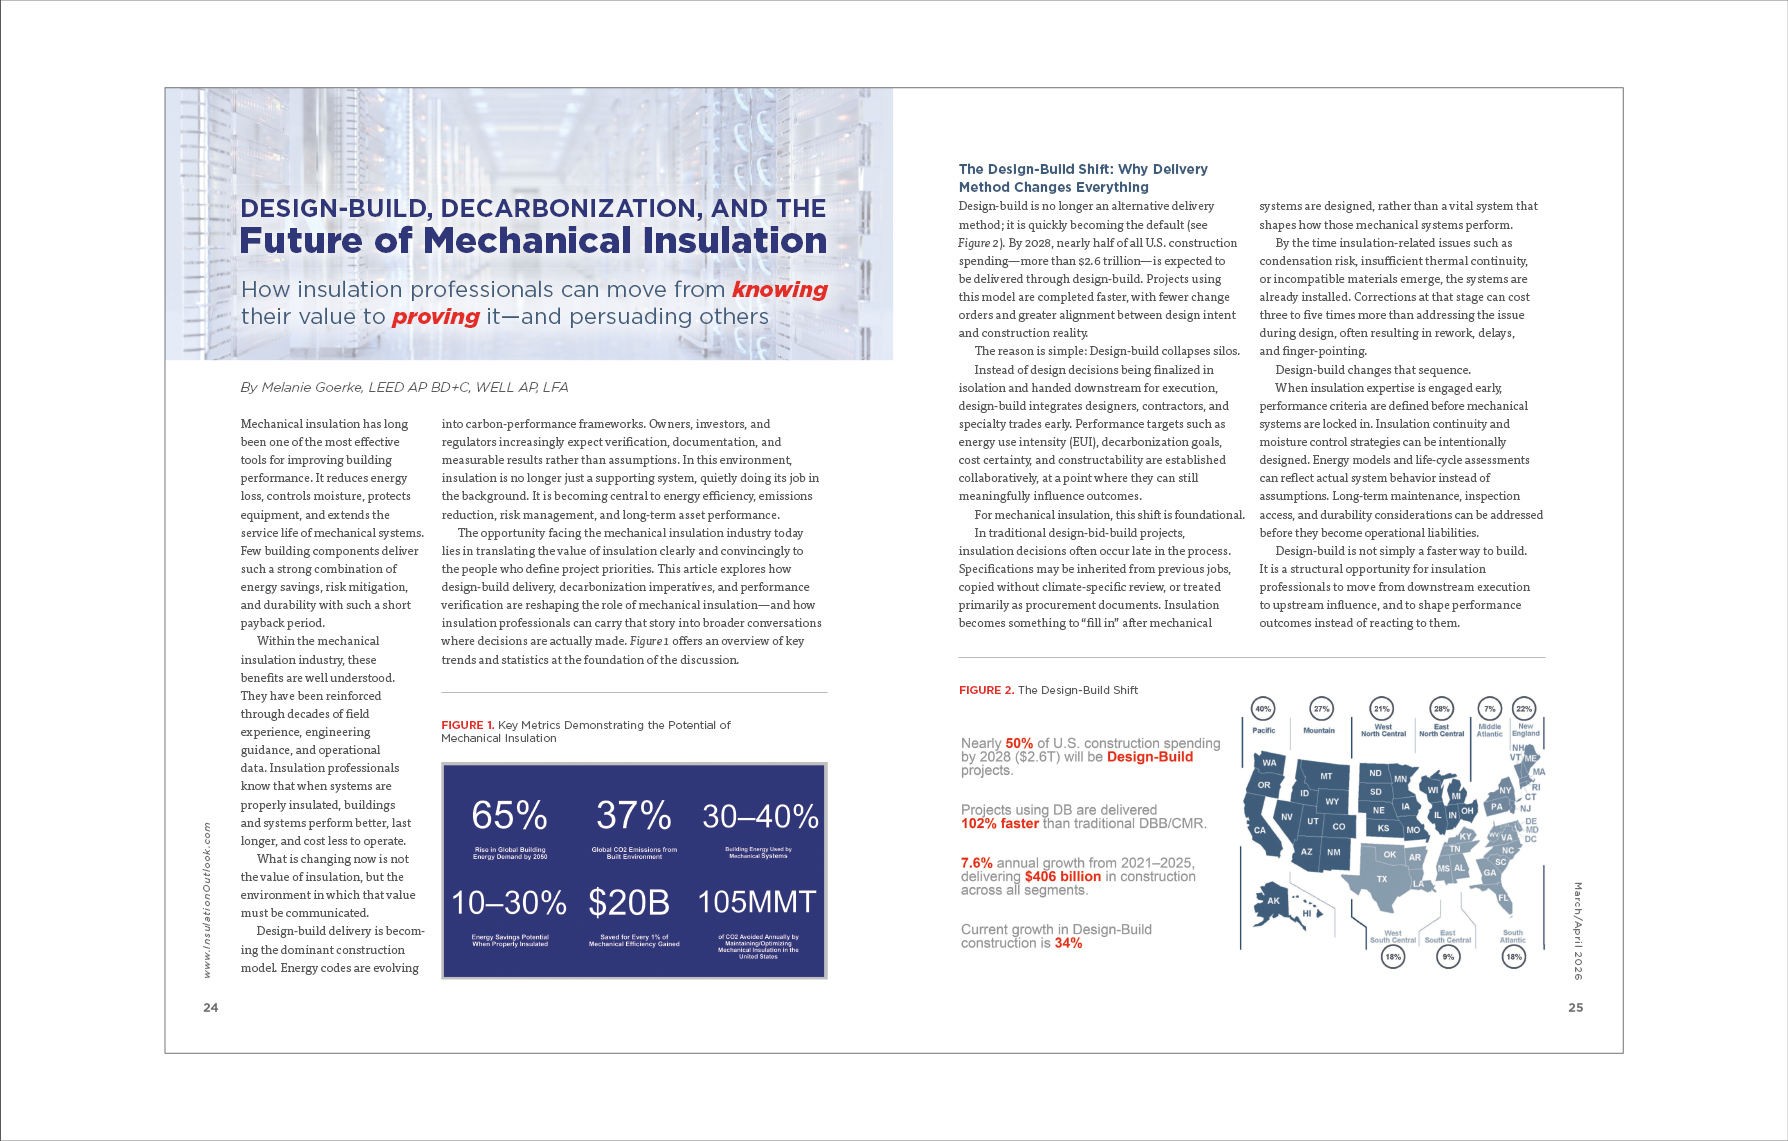
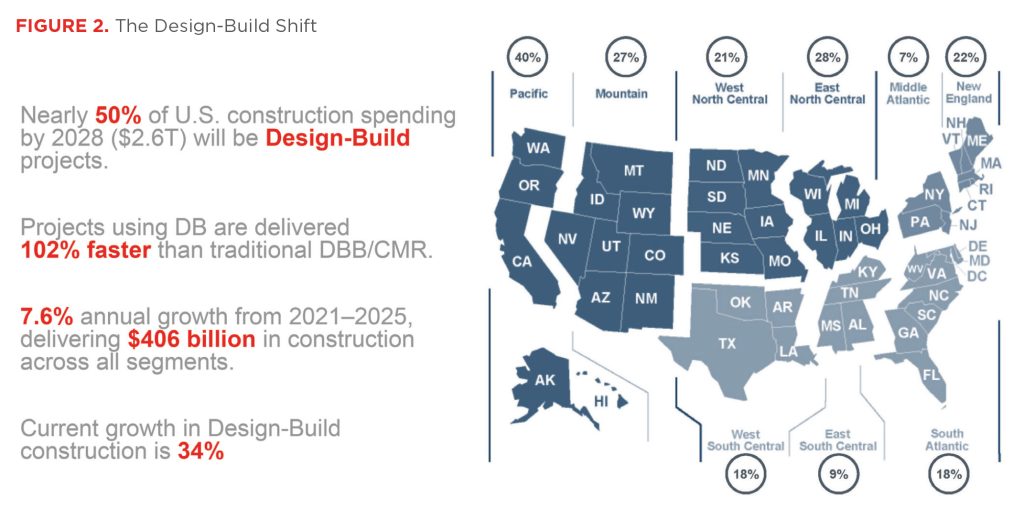
Design-build is no longer an alternative delivery method; it is quickly becoming the default (see Figure 2). By 2028, nearly half of all U.S. construction spending—more than $2.6 trillion—is expected to be delivered through design-build. Projects using this model are completed faster, with fewer change orders and greater alignment between design intent and construction reality.

The reason is simple: Design-build collapses silos.

Instead of design decisions being finalized in isolation and handed downstream for execution, design-build integrates designers, contractors, and specialty trades early. Performance targets such as energy use intensity (EUI), decarbonization goals, cost certainty, and constructability are established collaboratively, at a point where they can still meaningfully influence outcomes.

For mechanical insulation, this shift is foundational.

In traditional design-bid-build projects, insulation decisions often occur late in the process. Specifications may be inherited from previous jobs, copied without climate-specific review, or treated primarily as procurement documents. Insulation becomes something to “fill in” after mechanical systems are designed, rather than a vital system that shapes how those mechanical systems perform.

By the time insulation-related issues such as condensation risk, insufficient thermal continuity, or incompatible materials emerge, the systems are already installed. Corrections at that stage can cost three to five times more than addressing the issue during design, often resulting in rework, delays, and finger-pointing.

Design-build changes that sequence.

When insulation expertise is engaged early, performance criteria are defined before mechanical systems are locked in. Insulation continuity and moisture control strategies can be intentionally designed. Energy models and life-cycle assessments can reflect actual system behavior instead of assumptions. Long-term maintenance, inspection access, and durability considerations can be addressed before they become operational liabilities.

Design-build is not simply a faster way to build. It is a structural opportunity for insulation professionals to move from downstream execution to upstream influence, and to shape performance outcomes instead of reacting to them.

Despite advances in insulation materials, modeling tools, and codes, many mechanical insulation specifications remain outdated. It is still common to encounter specifications that predate ASHRAE 90.1-2016, rely on minimum R-values without climate zone context, or fail to address condensation risk, moisture migration, and long-term performance degradation.

Such specifications persist not because they are effective, but because they are familiar. Over time, they become institutional defaults, copied from project to project with minimal scrutiny.

The consequences are well known across the mechanical insulation industry:

  • Under-insulated systems and unnecessary energy loss;
  • Moisture intrusion, mold growth, and corrosion under insulation;
  • Disputes over responsibility when systems fail to perform as expected; and
  • Increased maintenance costs and premature equipment failure.

Ambiguous specifications frequently reinforce a lowest-bid mentality rather than performance-based decision-making. In that type of environment, insulation becomes a cost to minimize instead of a solution to optimize.

Design-build delivery offers an opportunity to reset this pattern.

Modern, performance-based specifications can reference current standards such as ASHRAE 90.1-2022, and ASHRAE 90.4 for data centers, updated ASTM testing methods, and IECC 2024 requirements. More importantly, they can articulate expected outcomes rather than just prescriptive minimums. Thermal continuity, operating temperature ranges, vapor barrier integrity, and maintenance considerations can be explicitly addressed.

This shift reframes insulation from a static section of the specification book into a living performance strategy aligned with energy, carbon, and durability goals.

Mechanical insulation consistently delivers one of the strongest returns on investment in the built environment, yet its value is often under-communicated to decision-makers.

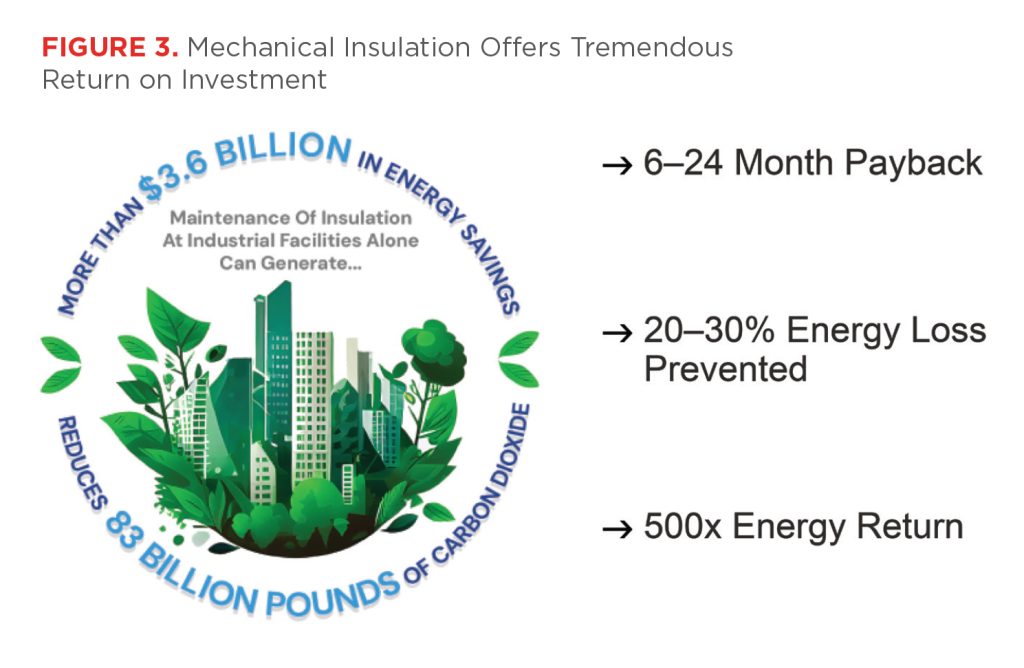
Typical insulation improvements deliver payback periods of 6 to 24 months. Properly insulated mechanical systems can prevent 20 to 30% of energy loss, particularly in heating and cooling systems where temperature differentials are high. Over the life of a building, cumulative energy savings often exceed the energy required to manufacture and install insulation by orders of magnitude (see Figure 3).

Unlike many efficiency upgrades, insulation performance compounds. Once installed correctly, it continues delivering savings every hour the system operates.

Beyond energy savings, insulation provides additional benefits that resonate strongly with owners and operators when articulated clearly:

  • Reduced maintenance and repair costs,
  • Protection of high-value mechanical equipment,
  • Improved system reliability and uptime,
  • Enhanced personnel safety,
  • Lower risk of moisture-related failures, and
  • Extended asset life and deferred capital replacement.

When insulation is framed only as a code requirement or a commodity line item, all the benefits listed above are rarely captured in decision-making. When it is framed as an operational and financial asset—one that reduces risk while improving performance—insulation becomes much harder to skim on and much easier to defend during value engineering.

The conversation around building performance is expanding beyond energy efficiency to include carbon accountability.

Recent code updates reflect this shift. ASHRAE 90.1-2022 and ASHRAE 90.4 emphasize thermal continuity and verified R-values rather than assumed performance. IECC 2024 further strengthens requirements related to insulation design and installation quality. At the same time, federal mandates, climate disclosure rules, and corporate Environmental, Social, and Governance (ESG) commitments are increasing pressure on owners to account for Scope 1 and Scope 2 emissions.

Mechanical insulation directly affects both.

By reducing energy demand, insulation lowers the emissions associated with on-site fuel combustion and purchased electricity. It also supports system longevity, reducing the frequency of equipment replacement and the associated embodied carbon impact over time.

Yet despite this influence, insulation performance is still often assumed rather than verified. Projects are closed out with modeled energy savings that may never be validated in operation. When that happens, gaps emerge between design intent and reality, representing uncounted emissions, lost savings, and missed opportunities for improvement.

Verification closes that loop.

Thermal imaging, surface temperature measurements, digital documentation, and integration with Building Information Modeling (BIM) or digital twin platforms allow teams to confirm that insulation performs as intended. Verification protects return on investment, ensures performance persistence, and provides data that owners can use for regulatory compliance, sustainability reporting, and capital planning.

In this context, insulation is no longer just a thermal control measure—it is a carbon management strategy.

Several key variables determine whether insulation delivers its intended benefits over time.

Temperature differential (ΔT) defines the magnitude of heat loss or gain across mechanical systems. The greater the differential, the greater the energy and carbon impact of inadequate insulation. Thermal conductivity (λ) determines how effectively a material resists heat flow and directly affects system efficiency.

Continuity is equally critical. Gaps, compression, penetration, and thermal bridges undermine performance and increase energy demand. Moisture barrier integrity protects insulation performance over time; once compromised, R-values degrade rapidly, eroding both energy and carbon benefits. Finally, maintenance factors ensure persistence. Even well-designed systems lose performance without inspection, repair, and upkeep.

Design-build delivery allows these variables to be addressed holistically rather than piecemeal, improving long-term outcomes and reducing operational risk.

Data centers offer a clear view of where insulation practice is headed (see Figure 4).

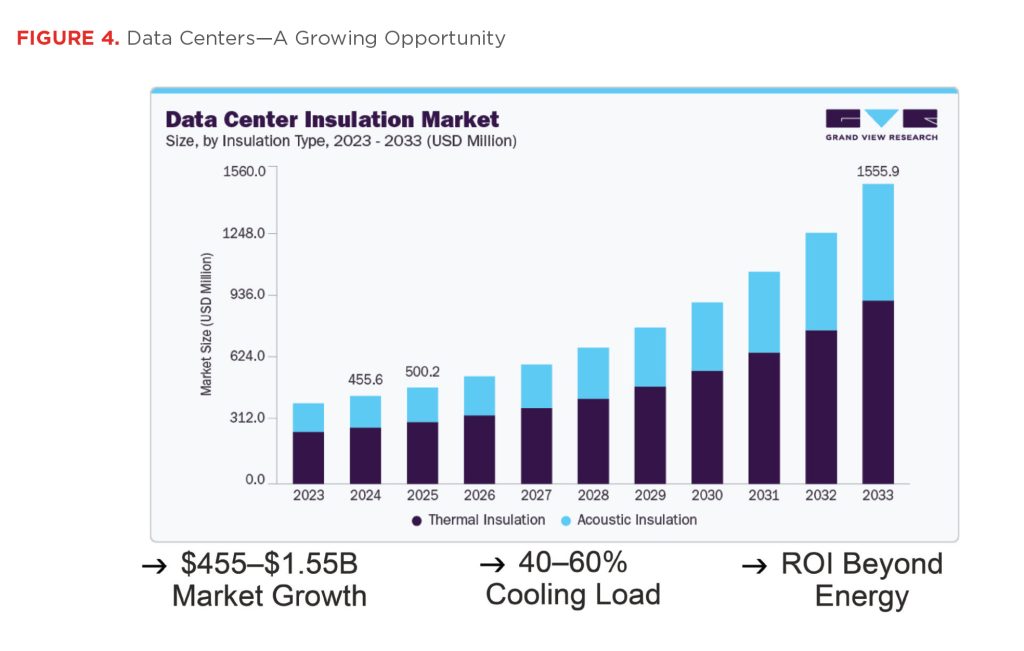
Globally, data centers consume approximately 3 to 4% of total electricity, and that share continues to rise with the expansion of cloud computing, artificial intelligence, and digital infrastructure. Hyperscale facilities can contain tens of thousands of linear feet of insulated piping and ductwork, some exceeding 30 inches in diameter.

In these environments, insulation performance is mission critical.

Condensation control, thermal precision, and reliability directly affect uptime. A single insulation failure can cascade into equipment damage, operational disruption, and significant financial loss. As a result, data center owners demand higher levels of documentation, quality assurance, and verification than owners of other building types.

These projects also highlight broader trends in reshaping the insulation industry:

  • Early insulation design for prefabricated and modular mechanical systems;
  • Insulation as a schedule-critical component rather than a finishing trade;
  • Integration of insulation data into BIM and digital monitoring platforms; and
  • Owner expectations for measurable, documented performance.

What begins with mission-critical facilities rarely stays there. Similar expectations are now emerging in health care, advanced manufacturing, and large campus projects, signaling a broader shift toward visible and verifiable insulation performance.

For many professionals reading this article, none of this information is new. The challenge is not understanding insulation’s value. Rather, it is communicating that value to people who do not live in mechanical rooms.

Owners, developers, finance teams, and even some design professionals are not dismissive of insulation, but they are focused on different metrics. They speak in the language of risk, return, compliance, and accountability. To move insulation upstream in decision-making, insulation professionals must meet those audiences where they are.

That begins by shifting the conversation from what insulation is to what insulation does.

Leading with R-values, thicknesses, or material types rarely resonates outside the industry. Leading with outcomes does. Cost savings, emissions reduction, operational resilience, and risk mitigation are universally understood.

Project workflows already provide natural opportunities to communicate insulation’s value. Early design meetings, value engineering discussions, sustainability briefings, capital planning reviews, and commissioning closeouts all create moments where insulation can be positioned as a performance lever instead of a cost.

Tying insulation decisions to what others are accountable for is equally powerful. Energy budgets, ESG disclosures, equipment uptime, maintenance costs, and regulatory compliance all intersect with insulation performance. Making that connection explicit changes how insulation is perceived.

Visibility matters as well. When insulation performance is verified and documented, it becomes tangible. Thermal images, surface temperature data, and performance reports turn insulation from an assumption into proof—and proof travels far beyond the mechanical room.

Perhaps most importantly, insulation professionals must embrace a broader role. When they show up as downstream installers, they are treated that way. When they show up as performance partners, armed with data, life-cycle thinking, and cross-disciplinary awareness, the conversation changes.

This is not about louder advocacy. It is about smarter translation.

Mechanical insulation is entering a new era: one defined by integration, verification, and visibility.

Digital tools are making insulation performance traceable. Codes and standards are embedding carbon accountability. Owners are demanding proof, not assumptions. These shifts favor solutions that are proven, durable, and cost-effective. Insulation meets all three of these points—when it is designed, installed, and communicated intentionally.

The future of mechanical insulation is not about convincing the industry of its own importance. It is about carrying that importance into conversations where priorities are set and budgets are allocated. When insulation professionals speak in the language of performance, risk, and carbon reduction, insulation moves from being quietly important to undeniably essential.

Reduce, reuse, recycle. It’s a mantra most of us know by heart. In many areas of life, these three habits are celebrated, but in the world of insulation specifications, they can be a serious problem. Old specs get pulled from the shelf, dusted off, and applied to new projects without anyone stopping to ask whether they still make sense. The result? Costly mistakes, underperforming systems, and facility owners left wondering what went wrong. But simply updating one part of an age-old specification and putting a job out to bid isn’t enough. In some cases, it may even make things worse, as when it introduces conflicting requirements, for example.

That is why the insulation industry needs a different R-word: readdress. In situations when specifications need to change—when costs get cut, when materials are substituted—someone needs to stop, readdress, and ask a few questions. Does this modified spec still perform as intended? Has the right expertise been consulted? Is the owner’s best interest still being served? The answer to those questions is too often “no.”

One of the most common ways specifications go wrong isn’t from neglect, it’s from value engineering. When costs need to come down, specifications are often among the first things modified. Architects and engineers may substitute materials or change installation requirements in ways that look like savings on paper but create problems in the field.

The deeper issue, English notes, is accountability. Once a change is made, there is rarely a mechanism to track whether the new solution worked as intended. The facility owner may never know that the insulation performing below expectations today is the direct result of a cost-cutting decision made years ago during design. “The savings don’t necessarily go back to the owner,” English says, “and often, nobody is following up on the long-term impact.”

English has seen this play out firsthand. On one sports arena project, to reduce costs, materials were substituted without full consideration of whether the replacement would perform the same way. It didn’t. The resulting problems led to a lawsuit and a payout that came to roughly 100 times the cost of the originally specified material. The “savings,” in the end, cost everyone far more.

Even when a specification starts out well written, problems can emerge when changes are made midstream without proper consultation with a subject matter expert or the manufacturer. A material substitution that seems equivalent on the surface may behave very differently in the field, particularly when installation conditions, temperature ranges, or moisture exposure weren’t fully considered.

English points to resources such as the North American Commercial and Industrial Insulation Standards and NIA’s Insulation Materials Specification Chart (www.insulation.org/about-insulation/system-design/techs-specs) as valuable tools. He also emphasizes improving communication and setting clear expectations among owners, engineers, contractors, and manufacturers. But the key, he stresses, is getting those conversations to happen before problems arise, rather than after.

His recommendation is straightforward: Any change to an original specification should require due diligence to confirm the modified spec will perform as intended. Better yet, he suggests that specifications include explicit language requiring approval from subject matter experts and engineers before any substitution is accepted. “If the spec changes, someone needs to be accountable for making sure it still works,” English says.

Underlying many of these issues is a knowledge gap. Engineers who write or approve insulation specifications may not have deep expertise in insulation performance, and manufacturers are often brought in too late, or not at all, to flag potential problems. Substitutions get made without fully understanding the downstream consequences.

English’s experience in the industry has taught him that the solution is less about blame and more about education and communication. “Ask questions when you see red flags,” he advises engineers and specifiers. “The goal is the owner’s satisfaction. That has to be the lens everything is viewed through.”

Involving subject matter experts earlier in the process can make a significant difference. Manufacturers, when consulted during the specification phase rather than after the fact, can help identify potential conflicts, suggest appropriate materials, and ensure that what gets written can actually be built and will perform as designed.

The bad spec problem is not inevitable. It persists largely because of habits—from the habit of reusing old documents to the habits of cutting costs without tracking consequences, and excluding the people with the most relevant knowledge from the conversation.

The fix requires intention: updating specifications to reflect current materials and standards, building accountability into the process, and creating space for manufacturers and subject matter experts to weigh in before a specification is finalized rather than after something goes wrong.

As English notes, “the insulation business is learned through experience and communication.” The industry has plenty of both. The challenge is making sure that knowledge gets into the room when the specifications are being written.

To help our readers stay ahead of the curve, Insulation Outlook staff has rounded up key forecasts from our strategic industry partners, putting the data that drives business decisions in one place.

By Chris Daum

As we move into 2026, understanding the trends shaping the built environment is more important than ever. The industry is entering a transition year marked by heightened uncertainty, uneven performance across sectors and regions, and the convergence of powerful macro forces. But not all sectors, business models, and geographies will experience the same outcomes, so leaders who rely on broad assumptions rather than targeted insights risk being caught off guard as conditions evolve.

Organizations that take these steps will be rewarded in 2026:

  1. Invest in people and your leadership pipeline;
  2. Establish disciplined operating systems and data frameworks;
  3. Build resilience in supply chains and business models;
  4. Accelerate adoption of artificial intelligence (AI), automation, and digital tools; and
  5. Understand sectors and geographies, and what is driving demand.

Resilience Is Now Mandatory

Many factors influence how construction demand will unfold through the remainder of the decade, including shifts in federal policy, global geopolitical dynamics, changing capital markets, and continued pressure on labor and operating costs. While no one can predict the future with certainty, several trends are already reshaping how and where investment occurs, and they will play an outsized role in determining who is best positioned for long term success.

The backdrop and demand mix are more complicated than overall construction spending totals suggest. There is still an elevated risk of a recession into 2026, given tight credit and challenges in many sectors for private development (e.g., residential). But despite this, construction overall remains stable, with extreme growth coming in data centers (a subset of the office segment), power, manufacturing, transportation, and water-related areas.

Executives who delve deeper into the headlines to truly understand their sectors and geographies will be able to best position their companies. They will also need to set aside time to develop the next generation of business and field leaders to ensure their companies remain resilient in the face of rapid change.

The following five trends are expected to shape engineering, construction, and the broader built environment in 2026 and beyond.

Trend 1: Diverging market conditions are reshaping construction demand.

The built environment is entering a period defined less by broad cycles. While overall construction activity remains supported by long-term fundamentals, performance is increasingly uneven across sectors and markets. Some private sectors are softening even as power and utilities, infrastructure, and other mission-critical segments continue to demonstrate strength.

Questions to consider:

  • Where is your backlog concentrated, and are you exposed to sector-specific slowdowns?
  • How are shifting funding sources and lending conditions influencing project timing and feasibility?
  • Are your forecasting and planning processes flexible enough to account for uneven geographic and sector performance?

Trend 2: Power, data centers, and the infrastructure that supports them are driving the next wave of growth.

In some markets, data centers account for more than 25% of total nonresidential building construction. This trend remains a critical part of what is propelling construction spending and resource allocation. Growth is heavily linked to key inputs such as power, water, and grid and fiber access.

Questions to consider:

  • How is growing demand for power impacting your markets and project pipeline?
  • Are you positioned to support large-scale, energy-intensive, and mission-critical projects?
  • How quickly can you shift resources to take advantage of large-scale public and private investments?

Trend 3: Sustainability, electrification, and resilience are becoming foundational requirements.

Sustainability and electrification are no longer driven solely by policy mandates or corporate commitments, as they are evolving into core economic and operational considerations. Rising energy demand, increasing electricity costs, and growing exposure to extreme weather events are pushing owners and public agencies to prioritize resilient, efficient, and durable infrastructure.

Questions to consider:

  • How are climate and resilience requirements changing project scope and delivery expectations?
  • Are sustainability initiatives aligned with economic performance and risk management?
  • How prepared is your organization to support resilient and electrified infrastructure at scale?

Trend 4: Labor constraints and digital transformation are redefining performance gaps.

Labor availability remains one of the industry’s most persistent challenges in 2026, with the industry adding only 14,000 net new construction jobs in 2025, setting up for tighter labor conditions over the forecast period. The November Bureau of Labor Statistics Job Openings and Labor Turnover data show construction job openings around 300,000— or 4% of total U.S. job openings—which signals a market that is cooling but remains tight for many skilled workers as project complexity grows. The gap between retiring skilled workers and new entrants continues to widen, exacerbated by shifting immigration policies that affect the roughly 30% of construction workers who were born outside the United States.

Questions to consider:

  • How resilient is your workforce strategy in a tightening labor market?
  • Are digital tools integrated into your operating model or layered on top of existing processes?
  • How are you measuring the return on investment from technology and talent initiatives?

Trend 5: Structural drivers continue to support long-term mergers and acquisitions (M&A) momentum.

M&A activity across the U.S. built environment has shifted from cautious optimism to steady execution. Despite setbacks from tariff turmoil, geopolitical risks, and labor uncertainties, the macroeconomic and structural forces that began aligning in prior years appear to be translating into sustained transaction activity. While volatility and uncertainty persist, market participants have, to some degree, recalibrated expectations around interest rates, valuations, and risks, enabling buyers and sellers to transact with greater confidence.

Questions to consider:

  • How does M&A fit into your growth and succession strategy?
  • Are you positioned to attract high-quality capital or acquisition interest at market valuations?
  • What operational or strategic gaps can M&A help address?

Executive Summary: FMI’s 2026 North American Engineering and Construction Industry Overview

Total U.S. construction put in place is estimated to decline 1% in 2025, then in 2026 rise 1% to $2.2 trillion. Growth across sectors remains uneven, with data centers and infrastructure work offsetting softer cyclical building segments including multifamily, lodging, commercial, traditional office, amusement and recreation, and manufacturing.

U.S. construction entered 2026 with a late-cycle industry backdrop and a more complicated demand mix than headline totals suggest. Recession risk remains elevated into 2026, driven by a cooling labor market and a yield curve that has begun steepening, following the Federal Reserve’s rate cuts in late 2025. Credit remains tight, and vacancies and
delinquencies in multifamily and office continue to constrain private development. Data availability was also disrupted by the federal government shutdown that delayed several key releases, which has clouded planning and budgeting.

Residential markets are where the impact of high borrowing costs and affordability constraints are most visible. Single-family construction spending is projected to decline 5% to $420 billion, as payment-to-income ratios remain near record highs. Multifamily construction spending is forecast to fall 9%, with vacancies dropping despite a large wave of inventory that was added over the past several years. Improvements spending is expected to increase 6%, as high valuations and aging housing stock and energy-efficiency incentives sustain the renovations market.

Nonbuilding structures continue to provide the industry with stability and growth, led by power, water, and wastewater investment tied to grid modernization, resilience, and capacity expansion. At the same time, nonresidential buildings remain a tale of two markets. Traditional office, retail, and warehouse construction remain constrained by vacancy, underwriting discipline, and cautious capital, while data center work is expanding rapidly and increasingly dominates the office segment. (Data center facilities are currently classified by the U.S. Census as a subsegment of the office sector.)

The most important story for 2026 is divergence. More than ever, executives need to be cautious about interpreting the industry’s broad segment labels without looking at the mix beneath them, as well as regional makeup and differences. The practical implication for strategy is disciplined selectivity. Lean into the most durable demand streams, especially power, water, and data-center-adjacent work, while staying conservative on rate-sensitive private development and managing labor, schedules, and procurement risk around megaproject delivery.

Chris Daum is the President and CEO of FMI Corp. (www.fmicorp.com). Excerpted with permission from 2026 North American Engineering and Construction Industry Overview. Daum oversees the management of all FMI businesses and services, and leads the firm’s strategic growth efforts. Visit https://fmicorp.com/insights/construction-outlook to download the full report.


From Sage Policy Group, Inc.: 2026 Economic Outlook

By Anirban Basu and Zack Fritz

2025 was, from an economic perspective, absolutely wild:

  • Longest federal government shutdown in U.S. history? Check.
  • Trade policy we haven’t seen since the 1930s? That too.
  • A massive spending and tax bill with the stranger-than-fiction name of One Big Beautiful Bill Act (OBBBA)? Why not?

In our 2025 forecast—which held up decently well, all things considered—Zack wrote:

There are two huge question marks heading into the year. First, policy uncertainty is a pain regardless of how it resolves, but a quick resolution—one way or another—would help everyone.

Second, inflation. If it speeds up-oh no. If it falls back toward 2%, well, the opposite of oh no.

Those are still big, scary questions heading into 2026, though perhaps not the biggest nor the scariest. But it is not all doom and gloom. In some ways, 2026 has the potential to be better than 2025.

An Early 2026 Turbo Boost

Many households will get chunky tax refunds in 2026, due to OBBBA deduction changes. These refunds will function like stimulus checks, albeit ones that mostly go to higher income households.

Optimistically, this could give much-needed warmth to a cooling economy. Pessimistically, this will cook the economy into a microwaved Hot Pocket—parts of it scalding hot, others so frozen you could crack your teeth on them. Sticking with the food analogies, this will likely cause a sugar rush. Expect lots of big-ticket purchases: cars, travel, other durables, etc.

Will businesses expand to meet the elevated demand? If so, this rush will provide much needed stability to a flagging labor market, at least for a while. If businesses instead respond to greater demand with higher prices (instead of more employees/production capacity), expect inflation to accelerate and growth-boosting effects to be minimal.

Policy Uncertainty

Despite concerns about tariffs and uncertainty, we were relatively optimistic about the second Trump administration’s economic policy. This was a pretty widely held sentiment in late 2024, and one that proved woefully overoptimistic.

Yes, the OBBBA has some nice tax provisions for businesses, but deregulation fell well short of expectations, specifically for construction.

And then there were tariffs, larger and more volatile than virtually anyone thought possible. Our November 2025 effective tariff rate of 16.8% (https://budgetlab.yale.edu/research/state us-tariffs-november-17-2025) is the highest since the 1930s.

The Supreme Court is probably going to invalidate* the tariffs authorized by International Emergency Economic Powers Act (IEEPA), which will drop the effective rate to an estimated 9.3%. That is better but still the highest rate since the 1940s. (*This economic outlook was published prior to the Supreme Court’s ruling, https://budgetlab.yale.edu/research/state-us-tariffs-scotus-ruling-update.)

It is impossible to tell when and to what degree tariffs will raise prices, and the economic effects of new immigration policies are just as difficult to interpret. We simply don’t have great data on undocumented workers.

What is clearer is that trade policy has put the economy into a holding pattern, with certain industries, such as manufacturing (-63,000 jobs through the first 11 months of 2025), rapidly losing altitude.

And then there is the fact that the U.S. government took a stake in 14 different companies in 2025, ending a 60+ year streak during which the government did not take a stake in even a single healthy company. This is simply not capitalism.

Will 2026 bring more policy certainty? Hopefully, but who really knows? We will get a new Federal Reserve (Fed) Chair around June, and there are concerns about how that will affect Fed independence. Mid-term elections in November will also amp up the uncertainty.

Even so, the consensus view seems to be a calmer 2026 on the policy front. We will believe it when we see it.

Inflation

Looking to 2026, inflation will probably keep plodding along in the same 2.5% to 3% year-over-year range that it has hovered in for the past 18 months, at least at the start of the year.

It is tempting to dismiss 3% year-over-year inflation as no big deal. Tempting, but wrong. The difference between 2% and 3% annual inflation is not 1%, it is 50%. If prices increase at a 2% annual rate, they will double every 34.5 years. At a 3% annual rate, every 23 years.

Stubbornly above 2% inflation also puts the Fed in a tough spot, and they are already at risk of losing their credibility as inflation fighters.

A final note: There’s decent reason to think inflation will peak in the first half of 2026, though we expect it to remain above target throughout the year.

Job Growth and Unemployment

Job growth waned throughout 2025, and the unemployment rate continued to trend higher.

We are worried about the labor market in 2026. If unemployment rises by the same amount that it did in 2025, we will be looking at a 5.2% rate by the end of the year. Outside of the pandemic-affected months, that would be the highest rate in over a decade and a pretty clear sign that we are heading for recession.

The Great Stay

Hiring (the act of a company actually hiring a person, which is different from job growth, which refers to the net change in employment) was as sluggish as a foot race between our past two presidents in 2025, slower than in any year on record other than 2009 (not a particularly pleasant year for the economy, if you will recall).

Fortunately, that lack of hiring was accompanied by a historically low quit rate and a relatively low layoff rate. As a result, unemployment did not increase by that much. It was a great year to have a job and a terrible year to need one.

This dynamic has made the economy fragile without causing that much damage—at least not yet, anyway. If hiring picks up in 2026, conditions should improve quickly. If layoffs pick up, things could get dark quickly.

Youth Unemployment

20- to 24-year-olds has increased about 3 percentage points, well above the 1.2 percentage point increase in the economywide rate.

Is this due to artificial intelligence (AI)? Maybe at the slimmest margins, but it is mostly the lack of hiring that’s pushing young adult unemployment higher. If AI were to blame, we would expect a larger increase in college educated unemployment.

For many young adults at the very start of their careers, faster hiring is an absolute imperative for 2026. Unfortunately, we think it could be another year of sluggish hiring.

Nonresidential Construction

Here is the simplest way to think about the nonresidential segment: Construction spending on data centers is up 105% over the past 2 years, while spending on all other private categories is down 6%.

Data center construction will continue to grow in 2026, but that category accounts for just 3% of total nonresidential construction activity.

We expect a slew of factors—such as higher rates, policy uncertainty, and potentially higher material prices—to continue to weigh on overall nonresidential activity, especially during the first half of the year. Nonresidential activity will hopefully begin to rebound by the end of 2026, especially if borrowing costs come meaningfully lower.

It should be noted that economists are less optimistic than contractors about the nonresidential outlook; 55% of contractors expect their sales to increase over the next 6 months, according to the Associated Builders and Contractors’ December 2025 Construction Confidence Index, while just 22% expect them to decline. For what it is worth, we hope they are right.

Anirban’s Outlook

  • 2026 will offer solid economic outcomes for the few, and mediocre-to-poor results for the many. In other words, the K-shaped recovery will continue, with corporate earnings growing strongly as AI-based productivity gains begin reshaping cost structures; the stock market edging higher as the Federal Reserve continues its efforts to lower rates; the OBBBA reducing tax liabilities, especially for upper-income households and corporations; the wealthy continuing to spend; and investment in energy production and distribution expanding due to a growing need for electricity, including from data centers.
  • There is enough there to keep the GDP expanding, particularly during the first half of the year. But many Americans and regions will feel the effects of stagflation, with the labor market continuing to struggle to create living wage opportunities and inflation remaining meaningfully above the Federal Reserve’s 2% target.
  • In my mind, the wild card is the stock market. I can imagine a scenario in which inflation readings turn out hotter than anticipated, consumer confidence declines further, corporate earnings sag, the stock market swoons, and even wealthier households pull back on spending after a tax cut-induced roaring first half of the year. So, watch out for the back half of 2026. The economy could supply plenty of drama as mid-term elections approach.

Zack’s Outlook

  • Inflation peaks in the first quarter of 2026 but still spends most of the year hovering in the mid-2% to low-3% range. This is an awkward level for the Fed. Too fast to ignore, too slow to prioritize if the labor market crumples.
  • Not that I expect it to fully crumple—more of a shuffling limp. Job growth stays slow. Unemployment keeps creeping higher.
  • Optimistically, things will improve in the second half of the year. If inflation slows, the Fed will be able to cut rates more than expected, giving a much-needed boost to growth. I expect four cuts next year (the Fed projects only one). I really hope I am right about that.
  • Pessimistically, I am still worried about policy uncertainty. I doubt I am alone, and worried business owners hold off on investments. It would really help if the pace of economic policymaking slowed.
  • Big picture, my outlook for 2026 includes neither a recession nor stellar growth. We will get a plodding economy that, with any luck, picks up toward the end of the year.

Excerpted with permission from Sage Economics. Visit www.sageecon.com for more information.

Anirban Basu is Chairman and CEO of Sage Policy Group, Inc., an economic and policy consulting firm headquartered in Baltimore, Maryland. Basu serves as the Chief Economist to Associated Builders and Contractors and as Chief Economic Adviser to the Construction Financial Management Association. Zack Fritz is Chief Operating Officer at Sage Policy Group and coauthor of the Sage Economics Newsletter.


From the American Institute of Architects (AIA): Consensus Construction Forecast

The latest Consensus Construction Forecast expects a modest 1% increase in overall building spending for 2026, rising to just 2.2% in 2027. “Spending on nonresidential building over the second half of last year was disappointing,” said former AIA Chief Economist Kermit Baker, Hon. AIA, Ph.D. “As of midyear last year, members of the AIA Consensus Construction Forecast panel were projecting that spending on buildings would be up almost 2% for 2025, followed by a similar gain this year. Now this modest forecast gain looks instead to have been a decline of a similar magnitude, with disappointing results across the board.”

While the overall outlook is flat, performance varies significantly by category. Spending on commercial facilities is expected to rise by 3% in 2026, followed by a 3.5% increase in 2027, according to the Consensus Construction Forecast. In contrast, manufacturing spending is projected to decline by 3.9% this year, with an additional 0.9% drop next year. Institutional facilities are anticipated to see steady growth, with spending increasing 2.7% this year and 2.8% in 2027.

Data centers are expected to experience strong growth over the next 2 years, while traditional office spending, excluding data centers, is projected to decline sharply during the same period. Retail facilities, including warehouses, are forecast to see minimal growth this year, with only modest gains in 2027. Institutional categories, known for more stable spending, show mixed results. Health-care facilities are projected to achieve mid-single-digit growth this year and next, while spending on education and amusement and recreation facilities is expected to remain nearly flat over both years.

Visit www.aia.org for more information.


From the Associated General Contractors of America (AGC): 2026 Construction Hiring and Business Outlook

AGC’s industry outlook shows most contractors have been affected by tariffs, and one in three have felt the impacts of enhanced immigration enforcement, yet most firms plan to add staff if they can find workers.

Construction contractors have dampened expectations for 2026, aside from surging demand for data centers and power facilities, amid broader worries about the direction of the economy, according to Dampened Expectations: The 2026 Construction Hiring and Business Outlook (Outlook), which AGC and Sage released in January 2026. In addition to lower expectations, contractors report they have been impacted by tariffs, enhanced immigration enforcement, and challenges finding qualified workers.

“While there are pockets of optimism in select private-sector markets, contractors’ overall sentiment has dampened notably compared to last year,” said Jeffrey Shoaf, AGC’s CEO. “One reason for their lowered expectations is that contractors are increasingly worried about the broader economy, the possibility of a recession, and the outlook for materials costs.”

Shoaf noted that the Outlook measures contractors’ expectations for different market segments via a net reading—the percentage of respondents who expect the available dollar value of projects to expand compared to the percentage who expect it to shrink. The highest net reading, 57%, is for data centers. Specifically, 65% of respondents expect the market for data center construction to increase, compared to just 8% who expect it to shrink. Contractors remain bullish about power projects as well, which recorded a net reading of 34%.

Contractors are moderately optimistic about hospitals, other health-care facilities, water and sewer, and manufacturing. Within health care, non-hospital facilities, including clinics, testing facilities, and medical labs, recorded a net reading of 24%, followed by hospital construction with a net reading of 20%. Water and sewer had a net reading of 16%, and manufacturing posted a net reading of 15%.

The net reading for construction of transportation structures, such as airport and rail projects, fell from 29% to 11% in 2025. The reading for bridge and highway construction dropped 14 percentage points to 10%.

Net readings declined as well—but remained modestly positive—for warehouse, federal work, multifamily residential projects, and public building. Expectations for contracts for federal agencies such as the General Services Administration, Department of Veterans Affairs, U.S. Army Corps of Engineers, and the Naval Facilities and Engineering Command fell from 22% to 5%, while the multifamily residential net slid from 12% to 4%. The net for public building dropped as well, from 14% to 1%.

The net reading for K–12 construction declined from 13% in 2025 to -1% in this year’s survey. Higher education slipped from a net of 12% to -5%. Expectations for education construction have been weakening for several years, with both K–12 and higher education showing decelerating growth since 2022, aside from a brief uptick in higher education in 2024.

Expectations for lodging, private office, and retail construction were the three most negative segments in 2026. The net reading for lodging fell 14 points, from 7% in 2025 to -7% in this year’s survey. Private office declined by 11 points to -14%, while retail dropped 13 points to -18%.

In addition to lowered expectations, many contractors also report being impacted by new tariffs and enhanced immigration enforcement. Roughly 70% of firms report being affected by tariffs. Forty percent report responding to actual or proposed tariffs by raising bid prices, and 20% of firms added price-sharing adjustments or other terms to contracts. While 35% report passing most or all tariff-related costs on to project owners, 11% say they absorbed most or all tariff costs.

One-third of firms (33%) report having been affected by immigration enforcement actions in the past 6 months. Six percent report a jobsite or other site was visited by immigration agents. Eleven percent report workers left or failed to appear because of actual or rumored immigration actions, and 24% report subcontractors lost workers.

In addition, more than three-fifths (63%) of respondents report that an owner postponed or canceled a project in the past 6 months. When asked why, 37% cite a lack of funding or uncertainty about a funding source, whether federal, state, or private. More than one in three firms (34%) say project financing was unavailable or too expensive. Just under a quarter (23%) of firms say increasing material or labor costs played a role.

Shoaf noted that respondents were asked to identify their biggest concerns for 2026. An economic slowdown or recession emerged as their most-often- mentioned concern, cited by 62% of firms. The next three most-cited concerns were workforce related: 57% of respondents cited insufficient supply of workers or subcontractors, 56% selected rising direct labor costs (pay, benefits, employer taxes), and 53% identified worker quality.

Despite their broader concerns, most firms anticipate adding workers in 2026 to meet the needs of current and planned projects. More than three-fifths (63%) of firms expect to add to their head count, compared to only 15% who expect a decrease. However, more than four out of five firms report having a hard time filling hourly craft positions (82%) or salaried openings (80%)—a higher proportion than at any point in the past 3 years.

Officials with Sage reported that construction firms are increasingly investing in technology to address productivity and labor challenges. Sixty-one percent of respondents say their firms are using artificial intelligence (AI) or plan to increase investment in it, up from 44% last year. AI is most commonly used for office and administrative functions, estimating, and preconstruction activities.

“AI is becoming an increasingly important tool for construction firms facing tighter labor markets and more complex projects,” said Julie Adams, Senior Vice President of Construction and Real-Estate Solutions at Sage. “Firms are using technology to improve efficiency, manage risk, and maintain productivity in a more uncertain environment.”

AGC officials said one of their top priorities this year will be to get Congress to pass a new surface transportation bill before the current one expires in September. They will also continue to urge the administration and Congress to address workforce shortages through expanded lawful, temporary work visa programs for construction, and increased investment in workforce development. And they are calling for greater clarity and restraint around tariff policy and for practical permitting reforms to reduce delays.

“With supportive infrastructure funding, workforce, trade and permitting policies in place, construction can continue to grow the economy, deliver essential projects, and expand access to high-paying career opportunities,” Shoaf said.

The 2026 Construction Hiring and Business Outlook survey was conducted from November 4 through December 15, 2025 and drew 951 respondents from construction firms across 49 states and the District of Columbia. Participating companies represented a broad range of revenue and employment sizes. About 30% of respondents reported employing union workers most or all of the time, while roughly 60% identified as open-shop contractors.

Visit www.agc.org for more information.

Q: What were the biggest opportunities and/or challenges for the mechanical insulation industry in 2025? How about for your sector?

WALLY: Managing supply was the biggest challenge in 2025, with elevated pipe insulation demand driven by large “mega” projects led by data centers. The industry has made strides in terms of forecasting and planning in advance, improving project management to keep projects on schedule.

KATIE: As I looked deeper into opportunities and challenges, it’s easy to talk about the same everyday problems we all face. No matter the size of your company, the challenges remain the same: cost of goods and cost of labor. The real challenges are how you overcome them and turn them into opportunities. The increased cost of raw and imported materials has both driven demand and increased price, creating our largest opportunity: efficiency. Manufacturers and suppliers dealing with allocation must increase their efficiency to meet today’s and future demands for products. The cost of labor has been and will always be a make-or-break factor of construction.

DAVID: The largest opportunities I see in the commercial and industrial sectors are tied to the expanding markets. Data centers and the energy expansion to power the sector are the main growth vertical market. In addition, there is expansion in oil and gas in the United States, specifically for liquified natural gas (LNG), and a slight uptick planned for the petrochemical sector. I also see a slight uptick in health-care construction for 2026. Supply allocation challenges in the market create opportunities for companies that can provide innovative alternatives when certain products are not readily available.

JOHN: There are ample opportunities in areas such as data centers, chip facilities, and power generation. However, the biggest challenges facing the industry include labor shortages and material shortages with long lead times.

Q: What is your greatest business lesson learned since 2020?

WALLY: The amount of change we’ve seen over the last number of years highlights the importance of being able to adapt and remain flexible to meet market demands. The ability of our people to identify and adapt to those changes is key to our success.

KATIE: Looking back to 2020, labor cost became an even larger factor, with increased social guidelines slowing workflow and, in some cases, stopping work altogether. Since the Covid era, the importance of training, communication, and education has played a growing role in overcoming a never-before-seen pandemic.

DAVID: You have to be able to move fast, predict what is ahead, and scale your business by expanding and contracting based on the market conditions. Those who do this are rewarded, and those who do not miss the opportunity. You have to “skate to the puck” and move your resources to the geographical markets that are expanding from the markets that are in a decline. More importantly, I spend a large portion of my time focused on building a culture and environment for a great place to work. Focusing on development of future leaders by building the bench is one of the many things that will set companies apart in the near future. We are entering a race for talent with an aging workforce, and the places that provide value beyond a paycheck will surpass the others.

JOHN: In the last few years, the greatest business lessons learned have been the ability to work and meet remotely, and the importance of better planning to deal with material and supply chain shortages. Perhaps most importantly, these challenges revealed the remarkable adaptability of our industry’s people.

Q: What are your predictions or hopes for 2026?

WALLY: The backlog of work in 2026 indicates a continuation of similar market demand as we experienced in 2025. We expect a broadening and strengthening of demand across traditional market segments that have lagged behind the mega projects.

KATIE: My hope for this year is that the younger generations increase their interest in the construction industry. It is our responsibility, through training and increased communication, to attract trade-driven individuals.

DAVID: 2026 will be a challenging year in the residential construction market, which continues to face headwinds. The commercial and industrial sectors are facing declining construction in several vertical markets, which is being replaced by increases in data centers, energy, LNG, and health care.

JOHN: For 2026, the economy is poised to soar to new heights, with power generation and grid improvements serving as a major driver of growth. Artificial intelligence will continue to dominate the headlines, though hopefully with a great deal of scrutiny applied to its development and impact.

Q: How important is continuous industry education? What role does NIA’s Education Center play for your team?

WALLY: Knauf’s sponsorship of NIA’s Education Center is an indication of the importance we place on providing ongoing training support. Our industry is highly technical, and the importance of proper material selection and installation is critical to a project’s success.

KATIE: A well-informed and trained workforce is the only way to achieve efficiency in today’s market. Continued education is the most important resource for preparing your entire staff for what’s to come. Education elevates knowledge and personal well-being, leading to a more productive company and culture.

DAVID: Continuous industry education is extremely important for the development of a bench. NIA’s Education Center is a world-class platform that offers unique education for a new generation for the industry.

JOHN: Just like running a business, if you and your team are not continuously growing and learning, the business is either going backwards or dying, and NIA’s Education Center provides access to specialized courses. In addition, NIA’s Thermal Insulation Inspector Certification™ and the Insulation Energy Appraisal Program™ certification equip our project managers and estimators to perform heat studies and evaluations of existing insulation systems, helping customers identify weaknesses or failures in their systems and understand the potential return on investment when repairs are made.

Q: What strategies have been most effective in attracting and retaining top talent?

WALLY: People are placing increasing importance on a company’s mission and values. Having a compelling case and the ability to clearly articulate that appeals to top talent. Retaining talent is about providing development and opportunities to achieve their career ambitions.

KATIE: Communication, recognition, and a clear path into the future are three keys to retaining your most valued employees. Creating excitement and opportunity will help you attract key hires.

DAVID: I cannot emphasize leadership enough. It is something I am passionate about, and I try to inspire others to focus on their own leadership development. I learned early in my education at Texas A&M University (TAMU) in the Corps of Cadets that leaders are made, not born. My answer to this question is not a strategy, but rather a culture and environment of leadership and development that attracts and retains all talent, not just the top. People follow those who inspire them to be better. It’s not only about fair pay and getting the work done. It’s also about investing time in a person who will, in turn, make you better. Something I learned in my Industrial Distribution classes at TAMU: As a society becomes more high tech, to be an effective leader, you need to become more high touch. When I heard those words, I did not even own a computer. It was 1990, and the course was ENTC 429 Engineering Supervision with Dr. Comstock, who was in his late 60s. These words have been a constant in my career, and I try to live this lesson daily.

JOHN: The most effective strategies for attracting and retaining top talent include incentives such as profit sharing, bonus programs, paid time off, and remote work options. Equally important is treating people with respect and integrity, making them feel like a valued part of the team.

Insulation Outlook thanks these four industry leaders for sharing their unique perspectives. Their insights and candor offer readers a valuable window into the state of the industry.

To be honest, the issues described in this article are not actually sneaky as much as they are issues that get lost in the shuffle when there are other big concerns surfacing. We are bombarded with assessments of inflation, employment, interest rates, tariffs and trade, and so on. The conversation regarding artificial intelligence (AI) is constant and intense, and one can be forgiven for being confused by what AI can and can’t do. The less headline worthy subjects covered here may yet prove more significant than those that are dominating the news cycle.

Lost Skills

At the top of the list is the issue of lost skills. We are all familiar with the workforce shortage that has been discussed for more than a decade. We know that by 2030 we face a demographic meltdown, as every single Boomer will be eligible for retirement. We also know that we lack trained people to replace them. But there is another element we don’t pay enough attention to: Those coming out of the trade schools and other institutions may be well versed in modern technology, but they don’t have experience with the old tech that still dominates most businesses. That training has to come from the people who have been dealing with these machines for years, yet too often they retire before passing on that knowledge. The vast majority of manufacturers have been accumulating machinery for decades, and most of that equipment is still in daily use. The experienced operators know their quirks by now and know what kind of adjustments have to be made. In the not-so-distant past, the “old heads” would pass along that information to new workers by example. But companies stopped hiring people to wait in the wings and gather knowledge. Now, the experienced worker retires, and the new worker is hired to replace them. There is no opportunity to share that knowledge, and the result is months of expensive trial and error.

Shrinkflation

A second sneaky issue is “shrinkflation.” We are all familiar with the higher prices that have come with inflation of around 2.7% (officially). The issue is that inflation should be somewhat higher by now, given all the tariff and trade turmoil, higher wages, and other traditional inflation drivers. The fact is there are many ways to cope with inflation if one is a producer. One can simply hike prices to reflect the higher costs of inputs—but that risks losing consumers that can no longer afford the product or service. The most common alternative strategy is “shrinkflation.” The price may stay the same, but the offering is smaller—often significantly so. The service is reduced so that there is a longer wait. Notice how slow “fast food” has become. A request for a service call now takes far longer, as staffs have been reduced as costs of hiring have gone up. In many cases people notice the reduced size, but there is little they can do about it; and when it comes to service, it is harder to point out. The consumer is deeply affected by this pattern, routinely getting less for their money. That erodes the relationship between producer and consumer. If the expectation was for a product of the same size and quality as before, and that expectation is not met, there will be strong motivation to shift to a different supplier.

Regulation

A third sneaky issue is one that has been around for a long time. Regulation has long been controversial—and for a variety of reasons. Milton Friedman was quoted as asserting that policies should be judged by their outcomes, rather than their intent. Many “good” ideas turn out to be problematic when they encounter the real world. They contradict one another as they are promulgated by different agencies with differing mandates. One problem occupies the regulator’s attention, and they pay little attention to what happens as a result of their change. It is estimated that there are over 1 million regulations at the federal level alone, and 4,500 more are issued every year. Keeping up with them easily becomes a full-time job. Lately there has been the additional stress of tariffs. More than 500 executive orders have been issued since the start of 2025. This is more than in any year in the last 3 decades. These also have changed quickly and often, and that makes it even harder to keep track of what has been affected and what hasn’t. Customs officials have admitted publicly that they no longer know what a company’s financial obligations are.

In truth, nobody wants to live in a world with no regulation at all. There are unscrupulous people, and there are ample reasons to seek protection for consumers, workers, the environment, etc. That said, there is a solid argument to be made regarding overregulation. In the vast majority of cases, the original rule or regulation made sense in the context of the original problem. It is when that rule or regulation conflicts with other goals and aims that difficulty arises. As an example, lately there have been calls to cap the interest rates set on credit cards at 10%. Given that everybody has long complained about how high these rates have been, it seems a good idea. What could go wrong? The reality is that credit card issuers are well aware that there are millions of defaults every year. The rate of serious delinquencies (90 days delinquent at least) is close to 8%. There was nearly $60 billion in overdue debt in 2024 alone. Credit card issuers absorb that loss by having higher rates that allow them to cover the delinquencies. If the rate is capped, they will respond with a much more cautious approach to issuing credit cards. Merchants have demanded that cards be widely available; but if rates are capped, those with weaker credit will be denied access. These people will be forced to less savory options, such as payday loans and outright loan sharks. The bottom line is that capping rates is a “good” idea in some respects, but it creates new problems: the infamous law of unintended consequences.

Keep in Mind

The attention this year will be focused on the usual subjects—inflation, employment, interest rates, taxation, trade, and so on. It is important to avoid losing sight of less common concerns.

NIA members attending Fall Summit voted a mission-critical facility upgrade at a power generating plant performed by JT Thorpe the first-place winner of 2025’s Insulation Project Art Gallery Showcase and Competition.

Project Description

The Pre-Cip (Precipitator) Duct Replacement Project involved meeting a complex series of requirements to accomplish a facility upgrade at the Big Sandy Power Plant in Louisa, Kentucky, owned by American Electric Power (AEP) and operated by AEP subsidiary Kentucky Power. The outlet pre-cip duct, installed in the late 1980s to address environmental concerns, connected to the Unit 1 boiler and was responsible for directing exhaust gases from the boiler to the stack. The current project addressed a significant operational issue: The severely degraded 40-year-old duct had become structurally compromised to the point of requiring replacement. It was allowing cold air infiltration, causing condensation in the stack and reducing system efficiency. Replacing it and properly insulating the new duct would remedy those concerns and provide long-term efficiency for the unit.

Efficiency is critical to the plant’s ability to comply with federal and state regulatory requirements. In 2014, the Kentucky Public Service Commission approved a plan to convert Unit 1 at Big Sandy from coal-fired to gas-fired electricity generation so the plant would comply with 2015 federal environmental standards. The conversion was completed in May 2016, and the upgraded unit went online May 30, 2016. Nearly 10 years later, the Pre-Cip Duct Replacement Project played a critical role in achieving energy and emissions savings into the future. It is also in keeping with one of the core principles described in AEP’s 2025 Corporate Sustainability Report: environmental respect.

JT Thorpe’s scope of work involved asbestos abatement to prepare for the removal and demolition of the existing duct, removing the structurally compromised ductwork, and installing new, high-performance systems designed for durability and energy efficiency. Specific sections of the new duct system would be insulated before installation, and the remaining components were to be insulated after the new duct was positioned. JT Thorpe personnel constructed and maintained scaffolding to provide safe access for all crafts throughout project performance, painted and coated all structural components and tie-in points, and ensured that all aspects of the work adhered to AEP’s rigorous safety and operational standards.

Photos 1 and 2 offer a comparison of the state of
the pre-cip duct before and after project completion.

Project Planning and Execution

JT Thorpe submitted a comprehensive scope-of-work package covering abatement, painting, scaffolding, and insulation—including a detailed timeline and schedule. To meet the objectives for the upgrade, the following project goals were established.

  • Timeline/Schedule and Budget: 12-week turnaround, with project completion on schedule and within budget.
  • Quality: All installations to meet strict quality standards for final approval.
  • Safety: Zero injuries over the course of the project.

As is common with facility replacement and upgrade jobs, the Pre-Cip Duct Replacement Project presented issues that challenged the contractor’s ability to meet the goals listed. JT Thorpe’s advance planning, risk assessment and mitigation, and deliberate execution enabled the team to overcome each challenge and meet (or better) each objective.

Timeline/Schedule and Budget

Site owner AEP’s power transmission system is one of the largest in the United States, spanning 11 states and supporting 5.6 million customers by providing approximately 29,000 megawatts of generating capacity. As part of that system, the Big Sandy Power Plant uses 2.3 million cubic feet of natural gas each hour to attain generation capacity of 295 megawatts of power.

Maintaining grid reliability and availability is paramount. AEP set the project completion date at 12 weeks to ensure the duct was operational and the plant able to return power to the market within that time frame.

JT Thorpe had to manage and overcome the following challenges, each of which had the potential to impact the schedule:

  • Specification review delays,
  • Change in installation sequencing, and
  • Poor weather conditions.

The delay in specification review meant that the general contractor and project engineers raised multiple issues regarding duct-construction specifications, including weld procedures and inspection requirements, later in the process than usual. Approval delays then pushed the date insulation installation could begin later in the schedule, which altered JT Thorpe’s original work plan. Approximately 40% of the insulation had to be installed after the duct was installed, from scaffold. Asked how the team accommodated the unexpected “in-air installation” requirement without losing any time, Project Superintendent Thomas C. (“Clint”) Hinkle gave credit to JT Thorpe’s carpentry team, led by Josh Bolin, an 18-year Local 650 journeyman carpenter superintendent. Hinkle says, “One of the great things that works for us is the [expertise of our] carpenter, Josh Bolin. As we learned we had to do it, he and his team were quick to get a scaffold just where we needed it… The carpenters really drove us home to get where we needed to, and we just rolled right along with it, so it worked out well.”

That said, Hinkle stresses that working at elevation “is a whole different ball game,” requiring its own planning and execution—and it gets more challenging the higher the elevation. The team worked in increments of 20 feet all the way up to the tie-in point at the top of the pre-cip duct at 200 feet. The secret, Hinkle says, is “good communication… We use three-way communication to make sure we understand what’s going into [each step], and exactly what we are going to do.”

Underscoring the importance of communication, John Stevens, JT Thorpe Vice President, describes the coordination involved in “getting the materials up to the elevated surfaces and making sure all that was being managed safely: the fall protection that had to be in place, and lifts—getting materials lifted up to the work access areas. It was an orchestrated challenge.” (More details on the scaffolding work are described in the section on safety)

Adding to the complexity of working at elevation, uncooperative weather threatened to disrupt the schedule. High winds along the Big Sandy River and an unusually heavy amount of rainfall during the project window had the potential to cause disastrous production delays. Hinkle notes that good planning allowed the team to compensate and avoid slippage in the project’s completion date, explaining, “We looked ahead at the weather forecasts every day and planned it all out… We had a very good general foreman. We were able to plan a lot of the inside work [such as] fabricating our metal for when the bad weather hit.”

When the customer sought to make the unit more visually appealing, asking the team to work on a section of the plant that was not being replaced so that it would match the new construction, JT Thorpe’s team was given access before the rest of the work started. As a result, the expansion of scope had no impact on the 12-week schedule.

In the end, Hinkle notes, “They fired up actually a little faster than 12 weeks.” All the planning and attention to detail got the plant back online a week ahead of schedule.

The same level of planning and communication also helped to manage cost. JT Thorpe was able to stay in budget through collaborative planning and coordination with vendors, the general contractor, and the site owner.

Quality

The team implemented a rigorous quality-control protocol, including daily inspections by the project engineer and site superintendent. All installations had to meet strict quality standards for final approval, as access for changes or repairs would be limited once the scaffolding was removed. Key inspections included:

  • Band placement–this had to be done properly to secure the insulation;
  • Placement of screws–quantity, spacing, and location were verified to ensure panel stability;
  • Quality of caulking–all cuts had to be properly made and thoroughly sealed to ensure they were watertight; and
  • Panel integrity–panels were visually inspected for dents or damage prior to approval.

Any areas of concern were tagged and re-inspected after changes were made, although Hinkle notes that because there was good communication between his team and the customer’s engineers, and with material suppliers, “we got our work approved pretty quick because the guys understood what they were asking for.” If there was a question about anything, he adds, “it was quick to get an answer. They were really easy to work with.” The open flow of communication and the well-defined quality assurance process ensured no significant rework by JT Thorpe was needed.

Safety

The project’s numerous challenges—from hazardous conditions surrounding removal of the old system to difficult weather and the need to complete work originally designed to be on the ground in air, on scaffolds at elevations as high as 200 feet—made a focus on safety critical.

A nine-time Platinum-level award winner of NIA’s Safety Excellence Award, as well as numerous other awards, on the Big Sandy project the JT Thorpe team completed 15,052 man-hours with zero injuries. This exceptional safety achievement was the result of a proactive safety culture built on a combination of well-defined processes and practices, training and certification, proprietary technology and tools, and that element recognized as the foundation of the company’s success in other areas: communication. Safety practices strictly followed on the Pre-Cip Duct Replacement Project included the following.

  • Comprehensive pre-work planning: Every task, especially high-risk scaffold/in-air installation, was carefully reviewed for hazards.
  • Daily safety briefings: Crew members were briefed on potential risks, weather conditions, and proper procedures.
  • On-site supervision: The project engineer and site superintendent maintained constant oversight, ensuring compliance with OSHA standards and internal safety protocols.
  • Tag-and-inspect system: Any questionable installation areas were tagged and only cleared after proper rework and approval, preventing unsafe conditions from going unnoticed.
  • Worker empowerment: Team members were encouraged to stop work if safety concerns arose, creating a culture where everyone felt responsible for the well-being of their peers.

The company was well-positioned to address perhaps the most obvious safety challenge: the scaffolding requirement. JT Thorpe is one of fewer than 100 companies nationwide, and one of the largest, with accreditation from the Scaffold & Access Industry Association (SAIA).

Robert Prinz, JT Thorpe Chief Commercial Officer, describes SAIA as “the NIA of scaffolding” in that they have created an industry-recognized third-party curriculum for providing scaffold user training, including competent person training for supported and suspended scaffolds. Prinz notes that JT Thorpe and its customers have confidence from knowing their team has been through standardized, rigorous training, which translates into predictable, safe performance. And predictable, safe performance is vital when people are performing complex work 200 feet above ground. Photos 3 through 6 offer a range of perspectives to give a true appreciation of the unit’s height.

JT Thorpe uses two proprietary tools to facilitate sharing of safety information and ensure a daily focus on safety is personal for every employee on the jobsite: a proprietary safety app, and FLASH (Field Level Assessment of Safety Hazards) cards.

Prinz explains that the safety app “started out on paper… Then when apps started to come around, we built it. Over the course of time, we’ve built more onto the app as digital information became much more prevalent. It’s a complete repository for our safety data and safety program.” The technology uses algorithms to analyze jobsites for possible hazards each day, and it allows input from crew members in the field to help identify targets for daily safety briefings. For example, says Prinz, “if we’re getting feedback from everybody’s pre task planning plans that there are a lot of crane lifts going on, we can focus our safety talks for that week or the next, saying, ‘hey, when you’re doing crane lifts, here’s what you need to do…’ We’re getting what’s truly happening in the field and figuring out how we can mitigate those risks.

The goal of the FLASH cards is to help each employee start the day thinking about their safety—and not only in the professional terms of conducting a jobsite hazard assessment and pre-task planning, but with a more personal daily reminder of why safety matters. Says Prinz, “The very first question is, why am I working safely today?” He says employees will put a picture of their family, for example, to see first thing. “They’re the why,” he says.

The culture of caring about safety on a personal level is further enhanced by an interesting next step—one not necessarily expected in the corporate world. Prinz explains, “When you complete your daily FLASH card, it goes to a random person in the company. They’ll read your answer and they may say, ‘Hey John, I see it’s your anniversary tonight. Have fun with your wife.’ It creates that interaction and builds a culture.” Hinkle agrees. “Doing those little safety things every day definitely helps to keep your guys in [the right mind frame]. If they see something, they tell you… We always say, ‘You’re your brother’s keeper,’ so you look out for everybody. And it might not even be people that work for our company that our guys look out for.”

Insulation System Specifications and Components

Stevens explains, “The customer here is American Electric Power, and they have, over the years…[developed] a set of standardized, engineered specifications for their different systems.” When the project went out for bid, Stevens says, “they already had the set standards and specifications for the materials… based on data that the customer collects through their processes. And they’re all the time trying to harness energy and make their units more efficient.” Table 1 shows AEP’s specifications for insulation materials and thickness for the pre-cip duct system.

JT Thorpe’s work also needed to comply with AEP-approved specification SES-4005, which addresses the standards (technical and construction) for current transformer enclosures in AEP’s metering installations.

The company collaborated with Mathias Metal to specify and configure structural elements such as stand-offs / stiffeners (see Figure 1).

Table 2 offers a summary of material types and products used, as well as the rationale for their selection.

Overall, products used for insulation system components were selected based on thermal rating (up to 1,200°F, per product data sheet) and durability under weather exposure. Metal components and fasteners met project-specific structural and environmental requirements. Component selection prioritized reliability, longevity, and compatibility with existing ductwork. Photos 7 through 10 show various insulated sections.

The only area of the system originally left uninsulated were the expansion joints, which were not insulated to keep heat emitting from the duct from compromising the material for the conveyor belt. John Stevens notes that this was an area where the customer’s engineers struggled to find a way to accommodate the natural expansion and contraction. Hinkle explains, “We came up with a solution. We had some cans that we made… Once we got them made, put them on, insulated them and everything, it really helped the project. It looks good and it holds the heat in well.” Photos 11 through 16 show the “cans” fabricated in the shop and then installed in rings around the expansion joints.

Project Takeaways

Stevens and Hinkle shared what they consider useful takeaways for those involved in every phase of a facility life cycle, and they apply to all types of mechanical insulation projects.

For Facility Owners / Managers

  • Aging facilities should be proactively inspected and any damaged insulation, piping, and other components replaced before efficiency losses escalate.
  • Timely maintenance avoids unexpected downtime and costly system inefficiencies.
  • Clear scopes of work and early planning of abatement, insulation, and structural requirements reduce risks of administrative delays, last-minute change orders, and potential environmental impacts or regulatory compliance issues.

For Designers / Engineers

  • Ensure design specifications and inspection criteria are clearly defined and approved before fabrication or installation—delays in approval can force suboptimal installation methods (e.g., “in-air” insulation installation).
  • Collaborate early with subcontractors and structural suppliers to confirm compatibility and availability of materials (e.g., metal panels, insulation rated for high-temperature applications, structural stand-offs).
  • Incorporate access and scaffold removal constraints into the design—once scaffolding is removed, adjustments may not be feasible, so first-pass quality must be guaranteed.

For Insulation Contractors

  • Communication is at the heart of project performance, efficient installations, personnel safety, quality results, and customer satisfaction.
  • Educate yourself and your teams on the most updated materials, products, applications, and best practices.
  • Think creatively and be a problem solver/consultant when solutions are needed on the fly—as when the JT Thorpe team developed the expansion joint rings.

Overall, Stevens emphasizes, “one of the big takeaways is, there’s a lot of companies that have old, outdated specifications that they still have in their engineering department or their procurement department. The owners really need to get involved with today’s insulation contractors and manufacturers to understand that there have been great advancements made and better, more efficient, easier application materials than what we used 40, 30, 20, even 10 years ago… There’s a lot of information to be had. NIA is a great resource with regard to finding the latest and greatest technologies out there.”

A Proud Tradition

The Pre-Cip Duct Replacement Project holds personal significance for the JT Thorpe team. Stevens explains, “The old system we actually installed in the late ’80s/early ’90s. I was the project manager on the job back then.” At that time, his crew included his father, his uncle, and other members of his family. “This project really went full circle from when I ran that job… To come back basically 40 years later and redo the duct system and upgrade it was pretty special.”

And the multigenerational connection doesn’t stop there. Stevens explains, “Then Clint started in the industry. His dad worked with me, and now Clint’s second generation. And for him to run the project, it’s just been a lot of personal attachment.” As many NIA members have observed at association events, the commercial and mechanical insulation industry often seems like one big family. Says Stevens, “Both my sons have been third-generation insulators, Local 80 insulators—as a matter of fact, in the same hall with Clint—and are now JT Thorpe operations managers.” He adds, “It also speaks volumes that all those years later, we’re still working with these same customers. We have built that relationship of trust, service, customer satisfaction, and a quality finished product-driven relationship… It’s pretty cool to see it run generation after generation.”

The company itself spans generations, as this year marks its 120th anniversary. Today, more than 86% of JT Thorpe’s work comes from referrals and repeat customers, expanding and continuing the interconnections.

As for the award-winning project, everyone is extremely pleased with the duct replacement project’s overall success. The customer saw results almost immediately. As Hinkle explains, “The plant talks a lot about how efficient it’s running, as far as the pressures. Before, when the old duct was there, it was very drafty. It had a lot of holes. It was getting a lot of outside air, which was not good. After this project, they’ve been bragging. It’s actually allowed them to get a few more megawatts produced out of the unit.”

For JT Thorpe, the proudest achievement is the safety record: Achieving zero safety incidents over 15,052 man-hours is a major accomplishment, particularly under such challenging working conditions.

“The main goals with every project you do is you want all your guys safe and the customer happy,” Hinkle concludes, “and both of those goals were met.”

JT Thorpe would like to recognize the following individuals for their contributions to the success of the Big Sandy Power Plan Pre-Cip Duct Replacement Project:

Clint Hinkle – 20+ Year Local 80 Journeyman Insulator, Project Superintendent

Josh Bolin – 18-Year Local 650 Journeyman Carpenter Superintendent

Sources
In addition to information obtained in an interview with JT Thorpe Vice President John Stevens, Chief Commercial Officer Robert Prinz, and Project Superintendent Clint Hinkle, as well as in the materials the company submitted with their NIA Insulation Project Art Gallery Showcase and Competition application, the following sources provided background and statistical data used in this article.

  1. Kentucky Power Fact Sheet, updated 1/5/2026, accessed at www.kentuckypower.com/lib/docs/company/about/KP_Fact_Sheet-2026.pdf.
  2. American Electric Power, “Powering America’s Future: 2025 Corporate Sustainability Report,” accessed at https://docs.aep.com/docs/sustainability/2025-AEP-Sustainability-Report.pdf.
  3. Ranie Wohnhas, Kentucky Power, “Kentucky Power Files to Convert Coal-Fired Unit to Natural Gas,” December 9, 2013.
  4. Ranie Wohnhas, Kentucky Power, “Public Service Commission Approves Big Sandy Unit 1 Conversion to Natural Gas Generation,” August 1, 2014, accessed at www.kentuckypower.com/company/news/view?releaseID=2963.
  5. Allison Barker, Kentucky Power, “Kentucky Power Completes Big Sandy Power Plant Natural Gas Conversion,” June 27, 2016, accessed at www.kentuckypower.com/company/news/view?releaseID=3326.
  6. “Big Sandy Natural Gas Conversion Project Completed,” Power Engineering Factor This, June 27, 2016, accessed at www.power-eng.com/coal/big-sandy-natural-gas-conversion-project-completed/.
  7. “PJM Selects Regional Transmission Projects to be Jointly Developed by American Electric Power, Dominion Energy, FirstEnergy,” American Electric Power News Release, February 27, 2025, accessed at www.aep.com/news/stories/view/10048/
  8. Scaffold & Access Industry Association University – Training & Education, accessed at https://saia.org/training-education/

About JT Thorpe
For 120 years, JT THORPE has been a trusted name in the industry, consistently delivering exceptional industrial services. Our unwavering commitment to safety, innovation, and superior quality has established us as a premier nationwide company, setting the benchmark for excellence. We specialize in providing top-notch softcraft solutions including fireproofing, refractory, scaffolding, insulation, and coatings—all tailored to meet the unique needs of various industries. With our extensive engineering expertise and professional project management philosophy, we ensure that every project is executed with precision and efficiency. Our work spans maintenance, capital projects, outages, turnarounds, and new construction, supported by a workforce of more than 10,000 skilled craftsmen who are ready to mobilize wherever we are needed. For more information, please visit www.jtthorpe.com/.

NIA congratulates 2025 Contractor Showcase winners:
First Place: JT THORPE
Second Place (Tie): Gribbins Insulation & Scaffolding and Insul-Tech, Inc.
We thank the entrants who helped highlight the diversity and creativity of the mechanical insulation industry: Jersey Fire Stop, LLC, Performance Contracting, Inc., and Irex Argus Contracting, LP. Watch for future articles with details on more projects.

Insulation contractors are potential targets for an I-9 audit and/or unexpected visit from
U.S. Immigration and Customs Enforcement (ICE). Whether you operate a small shop or manage multiple crews across different jobsites, your best defense is simple: Follow the law regarding I-9 compliance and prepare before ICE ever arrives.

I-9 Compliance Matters More than Ever

ICE is conducting aggressive I-9 audits, leveling steep fines, and carrying out Enforcement Actions against industries with large, decentralized workforces like those in the construction trades.

Under federal law, it is a crime to knowingly hire or continue to employ workers who are not authorized to work in the United States. Violations can result in civil fines reaching tens of thousands of dollars per worker. Criminal charges are also possible in cases of repeated or intentional violations. Here are some basic guidelines to avoid violations.

Complete every I-9 correctly and on time. Your first line of defense is to strictly follow the requirements for I-9s. Your goal is 100% compliance for every I-9. That begins on your employee’s first day. Every new hire must complete Section 1 of the I-9 on or before their first day of work, and employers must complete Section 2 within 3 days after the employee’s first day of work for pay.

Frequently, employers miss those deadlines, do not complete all I-9 fields, use outdated
versions of the I-9 form, or use the wrong verification documents. Any of those errors
can result in significant legal liability.

Follow best practices to avoid this liability. For example:

  • Never accept photocopies of verification documents. Employers must rely only on original documents to verify employment authorization. Do not accept photocopies, scans, or photos on a phone.
  • Avoid over documenting. Do not use more documents than required. As the I-9 instructions state, use only one document from List A or one each from Lists B and C. If you have a document from column A, you need not supplement it with documents from columns B or C.
  • Store I-9s separately. As a general rule, store I-9s in a file that is separate from the employees’ personnel files. If ICE wants to audit your I-9s, you will want to retrieve them quickly, without having to comb through all personnel files looking for them.
  • Conduct your own internal audits. Regular internal audits—ideally, under attorney client privilege—will help identify and correct errors before ICE finds them. This is especially important for employers with high turnover and/or multiple hiring locations. If you do find an error, draw a line through it and write in the correct information. Do not obliterate or obscure the original error. Just mark it out with a simple straight line so that it can still be read.
  • Consider using E-Verify. Some states require employers to use E-Verify. If you are in a state where its use is voluntary, using E-Verify shows your good faith intent to comply with the law and reduces the risk of hiring unauthorized workers. While it is not full proof, it is helpful.
  • Train your personnel. The I-9 looks simple, but that is deceptive. Employers should provide regular I-9 training for any employee who handles hiring paperwork. This training should cover all aspects of I-9 compliance, including acceptable documentation, identifying expired or invalid documents, correcting errors properly, and when to reverify work authorization.

Responding to an ICE Audit

An audit begins when ICE serves a Notice of Inspection. Employers typically have 3 business days to produce requested records, such as I-9s for current employees, I-9s for former employees within the retention period, payroll records, and employee rosters.

This is not the time to panic or hand over documents immediately. You have the right to consult legal counsel and organize your response. Whether ICE shows up at your office or a jobsite, stay calm and behave professionally—no running or screaming.

Every insulation employer should assign a member of management to interact with ICE and
contact your legal counsel. That individual should ask the lead agent for identification and note the agent’s name, agency, and contact information. Do this respectfully and without confrontation.

It is critical to determine why ICE is there. ICE may be serving a Notice of Inspection (an audit) or conducting an Enforcement Action (a “raid”). The responses differ significantly.

  • If it’s a Notice of Inspection, do not hand over documents on the spot. Employers should have 3 business days to respond. Call your attorney immediately and carefully collect the requested documents for ICE.
  • If ICE is there for an Enforcement Action, review the warrant or subpoena. A judicial warrant (signed by a judge) is required for ICE to enter private areas of your facility or jobsite. An administrative warrant is not signed by a judge and cannot authorize entry into non-public areas. But, it may likely list an individual to be detained. Do not harbor or hide such individuals. Respectfully point out if agents exceed the scope of the warrant, but do not physically interfere.

Final Thoughts

Compliance with the law is not optional. The best defense against ICE is a proactive, well-trained team and perfect I-9 compliance.

Author’s Note: This article is not legal advice. Please speak to an attorney for guidance.

The work to draft mechanical insulation installation standard practices and guidelines is moving forward through a broad coalition of industry stakeholders as part of the Association
for Materials Protection and Performance (AMPP)/NIA mechanical insulation standards initiative. During NIA’s Fall Summit, outlines for the first four proposed standards were presented to NIA membership, to address pipe supports, vapor retarders and vapor stops, flanges, and damaged insulation. These four topics were selected based on survey input from owners, engineers, contractors, manufacturers, and other industry professionals. They highlight specific, real-world “pain points” actively encountered across the insulation industry today.

Pipe Supports

Improper pipe support selection is one of the most common causes of insulation system
failure. There are many types of pipe supports, and selecting the proper support is crucial to
provide the necessary platform and clearance to install the insulation system correctly. Too often, supports are chosen without considering the space requirements of the insulation. When adequate clearance is not provided, the insulation cannot be installed properly, guaranteeing a flawed system from the start.

Vapor Retarders and Vapor Stops

For below-ambient systems, proper selection and installation of vapor retarders and vapor stops can be even more critical than the insulation itself. If vapor is allowed to infiltrate an
insulation system, it degrades the insulation material, reduces thermal performance, and can promote corrosion under insulation, ultimately shortening the service life of the piping.

Flanges

Flanges are designed to allow access to the interior of the piping system, but this accessibility creates a unique insulation challenge. The insulation system around a flange must be carefully designed, installed, and maintained to keep the overall system effective. When insulation is removed for maintenance and not reinstalled correctly, the integrity of the entire insulation system is compromised.

Damaged Insulation

Damage to insulation in an operating facility can result from many causes, including routine access, foot traffic, and contact with ladders or equipment. This standard will explore practical strategies to eliminate or significantly reduce insulation damage to maintain long-term system performance.

Next Steps

Working groups are being assembled, and an informational session took place on
December 16, 2025. These first four installation standards will be classified as “supporting
standards.” Supporting standards are targeted recommendations providing deep technical
guidance on individual components of the installation process that fit within broader
primary standards, which look at the full scope of required actions for each temperature range. The coalition has already identified more than 40 supporting standards, and the more issues the group can address, the more comprehensive and useful the final set of primary standards will be. Insulation professionals and end users are invited to share their additional “pain points” for consideration.

The primary standards will be developed to address the complete insulation system design requirements based on operating temperature. The following temperature ranges will define
how each standard practice is organized:

  • Cryogenic: −50°F and below
  • Low Temperature: −49°F to 75°F
  • Intermediate Temperature: 76°F to 450°F
  • High Temperature: 451°F to 1,500°F

The intent is to begin writing the primary standards as soon as the supporting standards
are well underway.

NIA’s mechanical insulation installation standards working group kick-off meetings will provide a unique opportunity to develop installation standard practices and guidelines that truly reflect every aspect of the insulation industry. Owners, engineers, manufacturers, and contractors will continue to collaborate to create comprehensive standards that address the most common challenges and concerns across
the field.

The AMPP/NIA Standards Committee 27 invites everyone in the industry to consider
contributing a small portion of their time to help shape the AMPP/NIA insulation standards. The expertise and perspectives of all stakeholders will be invaluable; together, participants in the standards development process can build a resource that will benefit the entire industry for years to come.

3E Plus is a free tool designed by the North American Insulation Manufacturers
Association (NAIMA) to help engineers and designers easily calculate the appropriate
insulation thickness for any mechanical and industrial application.

The tool features several customizable inputs to assess pipes, tubes, flat surfaces, ducts, vessels, and tank shells for both hot and cold systems. This enables users to determine the amount/thickness of insulation needed to achieve project objectives, such as protecting workers from hot piping (personnel protection) or preventing condensation on cold
piping (condensation control). Perhaps the most-used calculations are the ones that
help designers optimize projects with the most cost-effective amount of insulation to
apply (Heat Loss per Hour and Economic, Thickness tables). 3E Plus also calculates the greenhouse gas emissions avoided using insulation—a feature that is growing more
important as reporting on expected carbon reductions becomes more common.

After much user feedback, the online version of 3E Plus launched in 2022, with several
new features designed to save users time and increase productivity. It was developed for use on a laptop or desktop monitor, but it is accessible on smartphones and tablets.

New capabilities of the online version include the following:

  • Calculate over a range of inputs. The ability to perform calculations over a range of pipe/tube sizes saves users the headache of multiple iterative calculations, taking hundreds of calculations down to one click.
  • Save calculations and share projects. The new project structure saves user projects to the cloud and permits users to quickly share their project or custom materials with others via link.
  • Provide enhanced reporting and downloading data capabilities. Users can create formal 3E Plus PDF reports, and the software now includes the ability to quickly download results in a CSV file format for use with spreadsheets such as Microsoft Excel or Google Sheets. Users can still copy data directly from the results table as well.

If you haven’t revisited 3E Plus since its launch in 2022, based on feedback from users, NAIMA also has made some useful updates. New features since the original launch include:

  • Weather data. For users unsure what average outdoor weather or wind speed to use, 3E Plus has the answer. Based on project location, the tool provides a set of options for designers, depending on project specifics (e.g., temperatures not exceeded 99% of the year versus 99.6%).
  • Energy cost data. Up-to-date energy cost data is pulled from the U.S. Energy Information Administration.
  • Training videos. Training videos are available outlining all of the features of 3E Plus, so users can familiarize themselves with the software and the range of calculation options.
  • Specification tables. Users can create specification tables listing minimum insulation levels over the range of pipe sizes and temperatures. These can then be easily dropped into project specifications.

Guidance on how to get started is available at www.3eplus.org.

Building on the capabilities of 3E Plus, NAIMA developed a simple calculator for use
by non-engineers and designers to see how the use of insulation can help save money.
Key characteristics that make it beneficial for the user base include:

  • Accessible to any user. The inputs for 3E Estimator do not require technical information—anyone familiar with a facility will know them: square footage of the building, location, and fuel type used (if unknown, there are standard values available). The 3E Estimator takes that information and gives users projected cost savings, expected payback period, and emission reductions capacity (see Figure 1).
  • Designed to encourage action. The results of the 3E Estimator are easy to share with a link or report, giving users values to help decision makers rank insulation against other investments as they move forward with budgeting.
  • Useful for existing facilities as well as new construction projects. NIA estimates that 10% to 30% of mechanical insulation originally installed in facilities is missing or damaged. The 3E Estimator can assess the value of insulation repair or replacement, helping decision makers prioritize facility upgrades as appropriate.

The tool is accessible by desktop/laptop and on mobile devices. In addition to enabling users to share results via a customized link, it helps users create a report to share with other stakeholders. Access to NAIMA’s 3E Estimator is available at www.3eplus.org/estimator.

The underlying assumptions for various facility types (e.g., pipe length, size, and
temperatures) are taken from the ICF Energy Efficiency Opportunity Study published
in 2022, which is available at www.insulationadvocacy.org/insulationopportunitystudy.
A coalition of trade associations, including NAIMA, NIA, and the Insulation Contractors Association of America, the American Chemistry Council (Plastics Division), and the
Polyisocyanurate Insulation Manufacturers Association, commissioned the study, which quantifies the benefits of completing insulation retrofit projects across residential,
commercial, and industrial buildings.

Download the free 3E Plus pipe insulation thickness calculator for commercial and industrial facilities at www.3eplus.org. Download the free 3E Plus Estimator at www.3eplus.org/estimator.

The Midwest Insulation Contractors Association (MICA) publishes the
North American Commercial & Industrial Insulation Standards Manual,
commonly referred to as the MICA Manual. A helpful resource for engineers, contractors, and all mechanical insulation industry professionals, it allows all users to speak the same language when it comes to insulation specification and installation, greatly reducing the chance of miscommunication or unintended consequences. The MICA Manual contains standardized system plates that show insulation materials, installation methods, and accessory details that reflect current codes and technologies.

The 10th Edition of the MICA Manual is set to be released in June 2026, continuing MICA’s long-standing commitment to providing the most up-to-date industry guidance. The upcoming edition will include updates to existing plates, the addition of new plates requested by industry professionals to show details for specific applications, and revised information for material specifications and standards.

The manual is published as a service to contractors, engineers, designers, facility owners, and the mechanical insulation industry in general. Conceived by MICA, the first edition was introduced in 1979. Since then, the resource has grown to be recognized as the authoritative source for specifying and communicating installation details for mechanical insulation systems across the United States and internationally. It remains the definitive guide for the design, specification, and installation of commercial and industrial insulation systems.

Many engineers use the manual to help them document and outline exactly what needs to be done on a project. In turn, contractors use the MICA Manual in their submittal packages to convey insulation information and installation plans to the mechanical engineer—helping to eliminate long punch lists of items flagged later as incorrectly installed. Taking the guesswork out of a project for both engineers and contractors helps streamline project planning and minimizes problems and delays during execution.

Using the MICA Manual can save contractors time and money by providing a detailed explanation of materials and installation processes to the engineer, who can identify any desired modifications before work begins. For engineers, incorporating the MICA Manual into the submittal process facilitates clear communication with contractors and installers, preventing miscommunications and streamlining the building and installation process. Fixing and rebuilding aspects of installation can be costly; preventing errors up front is far more efficient and cost-effective.

NIA has been a decades-long partner and promoter of the manual, demonstrating its use
as part of several NIA training and certification courses. In addition, the Thermal Insulation
Association of Canada (TIAC) endorses the manual throughout Canada. Based in Ottawa, Ontario, TIAC is the national industry association in Canada for contractors, distributors, and manufacturers of commercial, industrial, and institutional thermal insulation, asbestos
abatement, and firestop.

About the MICA Manual
The MICA Manual is available for purchase in print and electronic formats, along with a bundled package that allows purchasers to buy both at a discounted rate, at www.micainsulation.org. Individual system plates are also available for purchase on the website, offering professionals convenient access to specific details they may need for projects or training purposes.

About MICA
MICA (www.micainsulation.org) is based in Dayton, Ohio, and serves the entire Midwest. Since 1956, MICA has provided its members the opportunity to be part of a professional association of commercial and industrial insulation contractors, abatement contractors, associate manufacturer/distributor and material supply firms, and affiliate firms that interact with the insulation industry. For more information, email mica@micainsulation.org, or call 888-294-0084.