This article continues our series featuring the
?Simple Calculators? from the Mechanical Insulation Design Guide (MIDG). The
calculators are part of the Mechanical Insulation Education & Awareness
Campaign (MIC), which was started by the Department of Energy’s (DOE’s)
Advanced Manufacturing Office to improve the energy efficiency of the U.S. industrial and commercial sectors. The
National Insulation Association (NIA) and its Alliance partners
collaborated with the DOE to design, implement, and execute the MIC.
The MIC seeks to increase
awareness of the energy efficiency, emission reduction, economic stimulus
potential, and other benefits of mechanical insulation. An integral component
of the MIC was the development of the Simple Calculators. The calculators,
listed on the left, provide users with instantaneous information on a variety
of mechanical insulation applications in the industrial/manufacturing and
commercial markets.
- Condensation Control—Horizontal Piping
- Energy Loss, Emission Reduction, Surface
Temperature, and Annual Return - Financial Returns
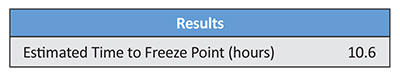
- Estimate Time to Freezing for Water
in an Insulated Pipe - Personnel Protection for Horizontal Piping
- Temperature Drop for Air in an Insulated Duct or Fluid in an Insulated
Pipe
The calculators are online as
part of the National Institute of Building Sciences’ MIDG, www.wbdg.org/midg.
You can also access them through a link on NIA’s website: www.insulation.org.
The calculators are fast, free, and functional tools that make it easy to
discover energy savings, financial returns, and other information for the
design of mechanical insulation systems for above- or below-ambient applications.
Insulation systems are often
designed to minimize variation of temperatures in processes. This article will
provide an overview and guide to use the Temperature Drop for Air in an
Insulated Duct or Fluid in an Insulated Pipe Calculators.
Temperature Drop Calculator for Air Ducts
This calculator estimates the temperature drop (or
rise) of air flowing in a duct (Reference: 2009 ASHRAE HoF, Chapter 4, Equation
48, page 4.21). The calculator requires data for 6 input variables. Results are
updated as each input variable is entered. Input information may generally be
obtained from design documents or field measurements. The impact of duct leakage
is not taken into consideration.
Following are the instructions
and additional information for each input variable. Note that the default
values for each input are highlighted in a box after each prompt.
- Line 1.
Enter the temperature of the air entering the duct, °F: 120 - Line 2.
Enter the ambient temperature (the average temperature of the air surrounding
the duct), °F: 75 - Line 3.
Enter the flow rate of the air carried by the duct in cubic feet per minute
(cfm): 500 - Line 4.
Enter the length of the duct run in feet: 50 - Line 5.
Enter the perimeter of the duct in inches: 48 - Line 6.
Enter the R-value of the selected duct insulation, ft: 6
The default value is 120°F; however, you should
enter the actual initial temperature in degrees Fahrenheit for the air entering
the duct.
The default
value is 75°F; however, you should enter the average ambient temperature in
degrees Fahrenheit for the area surrounding the duct.
The default
value shown is 500 cfm; however, you should enter the expected/designed flow
rate.
The default
value is 50 feet; however, you should enter the actual length of the duct run
in question.
The default
value is 48 inches; however, you should enter the perimeter of the duct in
question.
Enter the
R-value of the selected duct insulation. Available R-values will vary,
depending on the insulation products selected. If it is not known, it is
suggested you consult the respective manufacturer data sheet.
Based upon the information
variables provided, the Results section displays the temperature drop (°F) and
the temperature of the air leaving the duct. In this example, the results were
2.4°F and 117.6°F, respectively.
Temperature Drop Calculator for Hydronic Piping
This calculator estimates the temperature drop (or
rise) of water flowing in a pipe. The calculator requires data for 9 input
variables. Results are updated as each input variable is entered. Input
information may generally be obtained from design documents or field
measurements.
Following are the instructions
and additional information for each input variable. Again, default values
appear in bold, underlined text after each prompt.
- Line 1.
Enter the temperature of the water entering the pipe, °F: 35 - Line 2.
Enter the ambient air temperature (the temperature of the air surrounding the
pipe), °F: 75 - Line 3.
Enter the wind speed of the ambient air in miles per hour (mph): 15 - Line 4.
Enter the flow rate of the water carried by the pipe in gallons per minute
(gpm): 40 - Line 5.
Enter the length of the piping run in feet: 100 - Line 6.
Select the nominal pipe size (NPS) in inches: 2 - Line 7.
Select the nominal thickness of insulation in inches: 1 - Line 8.
Select an insulation material: Fiberglass
(to 850°F) - Line 9.
Select thermal emittance of the outer jacket material: 0.10 – Aluminium,
oxidized, in service
The default
value is 35°F; however, you should enter the actual temperature for the water
entering the pipe (in degrees Fahrenheit).
The default
value is 75°F; however, you should enter the average ambient temperature,
(temperature in degrees Fahrenheit for the area surrounding the pipe).
The default
value is 15 mph. You should enter expected wind speed. If unknown, it is
suggested you use 1 mph for indoor and 8 mph for outdoor applications.
Note:
The calculator does not screen for reasonable flow velocities; hydronic piping
is normally sized for flow velocities between 5 and 12 feet/second.
The default
value is 40; however, you should enter the expected or designed flow rate in
gpm.
The default
value is 100 feet; however, you should enter the actual length of the pipe run
in question.
The default
value is an NPS of 2 inches; however, by using the drop-down box you can select
any pipe size from ½ inch to 24 inches.
The default
thickness is 1 inch; however, you should use the drop-down box to select the
desired thickness, from 0 to 4 inches (in half- or quarter-inch increments).
Note: The
calculator does not screen for material temperature limitations.
The
default box indicates fiberglass; however, you may use the drop-down box to
select 1 of 8 insulation materials: Calcium Silicate, Cellular Glass,
Elastomeric, Fiberglass, Mineral Wool, Polyethylene, Polyisocyanurate, or
Polystyrene.
The default box indicates in service oxidized
aluminium; however, you may use the drop-down box to select 1 of 11
exterior surfaces. For a detailed discussion and definition of emittance,
please refer to the MIDG.
Based upon the information
variables provided, the Results section displays the temperature rise (°F) and
the temperature of the water leaving the pipe. In this example, the results
were 0.0°F and 35.0°F, respectively.
While the Simple Calculators may not address every insulation material
or application, they are an extremely valuable, easy-to-use tool that can
provide users with online, snapshot information on some the most frequently
asked-about benefits and design considerations of mechanical insulation
systems.
For both the novice and seasoned user, the MIDG—located at www.wbdg.org/midg—is
an excellent resource for basic insulation information and tools for designing
a complex insulation system. The MIDG is comprehensive and contains information
on every step of a project: from design, to selection, specification,
installation, and maintenance of mechanical insulation. The MIDG website is
regularly updated to bring users the most current and complete
information—including the convenient Simple Calculators,
designed to make the most common mechanical insulation calculations simple and
accessible to users of all levels. For further information
on this topic and the calculator please refer to the MIDG, Design Objectives—Process
Control section.
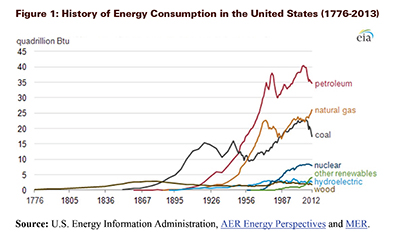
 Figure 1
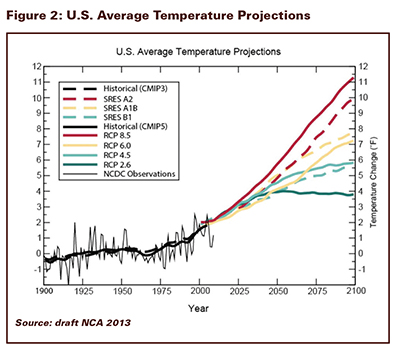
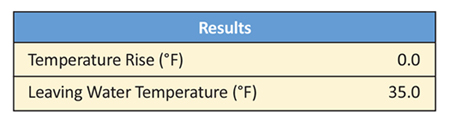 Figure 2