FMI has helped contractors plan ownership transitions since 1971. Our succession planning practice grew out of our management consulting business triggered by the familiar scenario of soldiers returning from World War II, starting a construction business, and wanting to figure a way out of the business by the 1970s.
Much of what business owners need now in planning a transition is the same as it was three decades ago. For the baby boomer generation, however, we are seeing a number of changes that make planning more complex and that require it to be more comprehensive.
Some of the changes in succession for boomers are:
- Companies are larger. Growth in the American economy has meant greater opportunity for the construction industry. The result is that successful companies are larger in revenues, profits, and asset-base and are more complicated to manage.
- People are living longer. Longer life-spans mean potentially longer retirements or longer careers.
- The industry is more complicated. There is more regulation, a more diverse labor force, and more sophisticated clients. Businesses, therefore, are more complex to manage for the next generation.
- Generation X employees require different management than boomers. Attracting people to the industry and providing effective leadership has always been a challenge.
- Boomers want to retire differently. Retirement used to involve ceasing work and perhaps moving away. Boomers may want to retire sooner, or stay and reduce their role. In addition, upon retirement, they may seek another career or activity to keep them engaged.
- Investment alternatives are more confusing. Boomers are looking for less risk and more diversification when selling their business. Stocks, bonds, cash, and real estate used to be the prime categories for investment. With the difficulties of the markets, particularly since 1999, hedge funds, international investments, and private equity, among others, have been increasingly sought as investment vehicles.
- More third parties say they want to buy construction businesses. The mergers and acquisition community is very active, and most business owners are inundated with inquiries, real and false.
- Tax law affecting ownership transition has changed. Tax rates, estate law, S Corporation, LLC, and ESOP rules have all changed, making planning simpler in some cases and more complex in others.
The changes listed above have created new challenges to succession planning. Let’s consider them one by one.
Companies Are Larger
Larger companies require more money to buy out the selling stockholders and greater management/leadership capabilities in the next generation to run the business. Some of the largest companies have developed a culture around employee ownership. For example, Kiewit and PCL maintain broad employee ownership and a detailed mechanism covering share pricing and stock offerings. Both companies serve as excellent examples for privately held companies wanting to remain private.
Making this work for Kiewit and PCL is an arguably conservative valuation for stock transactions and the ability to develop talent. A conservative valuation puts less strain on the company’s balance sheet in a transition, while developing people ensures succession and a strong management team to drive profitability.
Size and success have also attracted more exotic structures such as ESOPs (Employee Stock Ownership Plans) and recapitalizations with the help of private equity. Numerous ESOPs exist in the construction industry. For some companies, ESOPs have become a dominant owner and a culture-changing vehicle for broadly held ownership. For others, ESOPs represent a competitive buyer and may or may not be a long-term owner. At FMI, we have often seen ESOP companies sold to third parties, or bought out by the company.
Private equity for a narrow segment of companies in the industry has provided a lucrative means of transition. Companies with $3 million and greater in annual Earnings Before Interest, Taxes, Depreciation, and Amortization (EBITDA) may attract this type of capital; however, this type of investor is most interested in companies with a well thought-out growth plan, strong successor management, limited bonding needs, and high net margins. If you meet these criteria, this may be a viable means to achieve a strong valuation and reasonably quick liquidity, though you will likely be expected to continue with the company and rollover some investment.
Strategic buyers and international firms also continue to make acquisitions in the industry. Initial Public Offerings come in cycles but are an increasingly used tactic with larger firms.
In short, size has created more options for companies in need of ownership transition while demanding improved management and leadership. Larger contractors who have made a lot of money have more options to consider.
People Are Living Longer
Since people are living longer, company owners are concerned with funding a longer retirement, including health costs. Some owners define themselves closely with the business and decide to own the business longer. This can be frustrating for the next generation of family or employees who want the reins but have to wait until later in their careers.
At the other extreme, some owners want to retire early or slow down. To maximize their financial security, these owners may ask for a greater price for the business or sell stock more slowly as their role is reduced to maintain an income stream.
It is hard to predict how much money is needed or wanted to retire. Living to age 90 or even 100 is not out of the ordinary today, and health costs continue to increase. Thinking through the financial and personal issues surrounding a transition is important for owners contemplating one.
The Industry Is More Complicated
This is no surprise. Safety; federal, state, and local regulations; construction methods; technology utilization; longer distance competitors; and the changing banking and bonding industry are more complicated areas today. For boomers, this means that their successors need more time and training to learn what they need to know to operate in today’s environment.
In the past, plans may have focused more on the stock sale or transfer issues. Today, people issues are more important. Hiring the right people is critical. Hiring the wrong people causes a “double whammy”; you don’t have the right people to succeed you, and you’ve lost the time it takes for you to learn they are the wrong people when you could have been developing others. Training and development become more important since there is more to learn, and failure to provide training may result in losing the next-generation leader.
Management systems, including financial reporting, planning facilitation, and communication systems are an important part of countering complexity. In the past, you likely made some decisions based on your own experience, without consulting others. For successors taking over decision-making, management systems provide a framework for them to learn about the business and your decision-making. It also provides an opportunity to observe successors’ thinking.
Generation X Employees Are Different Than Boomers To Manage
Extensive literature exists about the differences between the “greatest” generation, who grew up in the Depression and emerged from World War II to build the modern economy, and the baby boomers, who grew up in prosperity and social turmoil. Generation Xers also grew up in the prosperity that followed boomers. While these are generalities, Generation Xers seek more out of work than a paycheck.
Just as the greatest generation was challenged to lead the boomers, the boomers are now challenged to lead Generation X. Xers have numerous career alternatives besides construction. Successful construction firms are recruiting Xers and keeping them. More and more we are seeing the development of corporate universities, increased training opportunities, and leaders seeking additional leadership training and education. Generation Xers want to be sought out, desired, and involved. The challenge for business owners is to stay on the offensive to attract the next generation and to develop and retain the current talent. Firms that understand this and work toward this will be the ones most likely to succeed.
Boomers Want To Retire Differently
Business owners are starting to discuss transition issues at a younger age. They are also less certain about what they want to do. Typically, these owners have made a lot of money by mid-career and are at the peak of their earning-years. Yet, they see other things they want to do, such as spending time with family, pursuing other business opportunities, and traveling. Others are tired of the cell phone ringing at all hours and the resulting constant demand for attention. While these owners may be “away” more, they don’t feel “away” since they are always reachable and their clients and employees know it. Boomers often don’t want to retire outright as many of the greatest generation did, but instead want to change the dynamic of their working life. This might mean taking a lesser role within the company (a non-CEO chairman versus a CEO), starting a new venture, or becoming a philanthropist. Many of these owners try retirement and don’t like it. Other owners fear retirement.
Retiring-while-not-retiring is neither simple nor easy. Paying less attention to a construction business you own can be dangerous, and selling too soon can mean giving up income and value. Empowering the next generation may put you in their way. Deciding what to do next after making the transition is not easy, and whether you will like your next endeavor is unknown. Therefore, the process of going from a successful, engaged business owner to the “next step” requires some soul searching and experimentation. There is no one-size-fits-all answer.
Investment Alternatives Are More Confusing
Conventional wisdom once was to put your nest egg in a combination of cash, real estate, and stocks and bonds. Two things make some business owners hesitant to follow this logic. First, private ownership of a business usually provides better returns than an owner’s diversified investments. Second, market volatility has made diversification more complicated as a protection for your nest egg.
Private companies outperform most investment vehicles for two reasons. First, entrepreneurs are driving the business, and there is no substitute for enterprising individuals motivated by ownership. Second, private construction companies are typically valued at three to six times pre-tax earnings in acquisitions and other valuations. In a low-growth business, three to six times earnings implies a return of 17 percent to 33 percent pre-tax return on the value of your investment. Contrast that with the stock market, where price-to-earnings ratios average over 20 on after-tax earnings. That implies a multiple of about 12 times pre-tax earnings or about an 8 percent return, excluding growth. For real estate, capitalization rates are typically in the range of 8 percent to 10 percent, meaning investors will pay 10 to 12 times cash flow.
That’s why investors offered a 17 percent to 33 percent return like most industry business owners effectively receive would gladly take the higher anticipated return. Indeed that is exactly the logic that private equity funds use—buying private companies for their investment funds. The difference is that if you own private businesses through a private equity fund, you are paying tremendous fees to fund managers and buying businesses you do not know.
Following this logic, why would anyone want to own anything but a private business? The answer is risk. Any business can turn upside down for any number of reasons. Hence, diversification protects your wealth, while a healthy investment in your own business provides tremendous
opportunity to achieve above-market returns.
FMI generally counsels owners to continue to invest in their own business since that is usually where the best returns are. In addition, we recommend allocating some assets to diversified investments to protect the owner’s nest egg. In other words, have your “get-rich money” seeking high returns and the remainder of your money in a diversified portfolio to keep you rich.
Regarding the second point above that causes business owners to hesitate to diversify their nest egg, market volatility has always existed. But two events have hit boomers. The first was the real-estate meltdown in the early 1990s. This put many developers out of business and hurt many boomers with real-estate investments. Since the early 1990s, real estate has been one of the best places to invest money. The second event was the bursting of the technology bubble in 1999. The NASDAQ fell by half, and the stock market went flat for several years. These two events sent investors looking for other investment vehicles. Most investors did not abandon real estate and the stock market entirely, but they sought other ways to earn returns that were not correlated to real estate and stocks.
Asset allocation became a prevalent strategy. Historically, a stock and bond portfolio might have earned 9 percent to 10 percent per year, on average over the last 80 years. Simply put, investors started looking for other ways to make 10 percent per year. Since the stock market fluctuates from year to year, investors sought alternatives so they would show positive returns during a down year or flat period in stock or real estate. Large investors such as university endowments, pension funds, and high net-worth individuals were the first to go into alternative asset classes. In the last 10 years, investment has greatly expanded in international stocks, hedge funds, and private equity. Strategies within each of these categories vary tremendously, providing a diversity of vehicles to achieve returns at varying correlations. Asset allocation is used by investors to protect against any downside while seeking the upside.
Some business owners have shunned the asset allocation strategy for two reasons. First, as previously outlined, owners have achieved better returns in their privately owned business, and second, they understand their business or local investments, such as real estate, better. The problem with this strategy is the risk involved. The business could have a problem or the local real-estate market could turn upside down. Further, in construction, these two events could be correlated.
The take-away for boomers is to diversify assets outside your business in areas you understand or invest with a knowledgeable advisor. Continue to hold onto your private investment as long as prudent and productive. It is prudent as long as you can limit your liability from personal signatures on bonds and bank lines. It is productive if you are not driving off management that drives future profits by keeping your stock away from them.
More Third Parties Say They Want To Buy Your Business
Most business owners we talk with receive regular letters and calls from people saying they want to buy their business. This type of solicitation has increased dramatically in recent years with the increase in merger and acquisition activity in the industry and the expanding number of private equity firms. It is flattering, and sometimes the interest is real. However, much of the time the contacts are from business brokers trying to drum up business, or inquiries from people that do not understand your business.
Until recent years, inquiries in the industry were fewer and probably easier to sort out. Now it is easy to operate under the assumption that there is a buyer out there when there is not, or alternatively, to ignore a serious buyer.
The difference today is that the odds of a strategic buyer having the resources and interest to purchase your business has increased, and if you fit a private equity firm’s criteria, you may have the opportunity to take significant money off the table while retaining an interest in your business. This changes an owner’s thinking. If an internal sale is the only option being considered, lining up the next generation or contemplating a shutdown is more dominant in an owner’s mind. If a third-party sale is possible, the owner may hesitate to prepare the internal sale option even though it may be needed.
Tax Law Affecting Ownership Transition Has Changed
It may be hard to believe, but tax law has, in many ways, become friendlier to ownership transition in recent decades. The big change was when Ronald Reagan cut tax rates in 1981, followed by the 1986 overhaul that substantially cut personal rates. The drop in personal rates in 1986 to below corporate rates caused many owners to change their corporation from C corporations to S corporations, removing the problem of double taxation. It also led to more companies using the Limited Liability Company (LLC), a pass-through entity for taxes like an S corporation, for their business structure.
ESOP tax law has also become friendlier over the years as Congress has sought to increase its use. One of the most beneficial changes to contractors came in the 1990s when S corporations were allowed to have an ESOP as an owner.
Tax rates have crept back up to 35 percent since Reagan left office, but planning has not become more complicated since more firms are using S corporations and LLCs. One area that is more complicated is transfers of stock among family members. There are IRS Chapter 14 rulings that require transfers to be done at fair market value, which does add compliance costs to a transfer.
What Is A Boomer to Do?
Given all these changes, FMI’s advice to the boomer owner contemplating future ownership is as follows:
- Pay more attention to leadership in your business. Spend more time understanding and developing your leadership skills. Spend more time hiring the right people to work for your business and more time understanding how Generation Xers think. Finally, spend more time and invest more money training your next-generation leadership. Use your management systems. Know your costs. Have business planning sessions involving next-generation leadership. Communicate with your team in order to manage your risk, and develop your successors.
- Manage your personal balance sheet and indemnifications. Grow your business, but also grow your balance sheet outside the business. If you need help for investment outside the business, get help.
- Control your exit strategy. Don’t be forced to sell when you are not ready. Develop the next generation; don’t run them off. You need them whether you sell to them or a third party.
- Wrestle with how you want to retire, if you call it that. Do you want a clean break? Do you want to transition slowly? Do you want to go out with your boots on? Is your spouse ready for your retirement? What are your other interests? Is the nonprofit world fulfilling or tedious for you? Put your toe in the water.
Wrestling with the personal transition is probably the least comfortable piece of the puzzle. Do you really want to have more free time? What would you do? Will you like it? Do you have enough in your nest egg to give up your compensation and returns from your business? How much do you want? How will you shift your energies? Succession for a successful business is a good problem to have, but not easy.
Reprinted with permission from FMI Corporation, 919-787-8400. For more information, visit www.fminet.com or call Sarah Vizard at 919-785-9221.
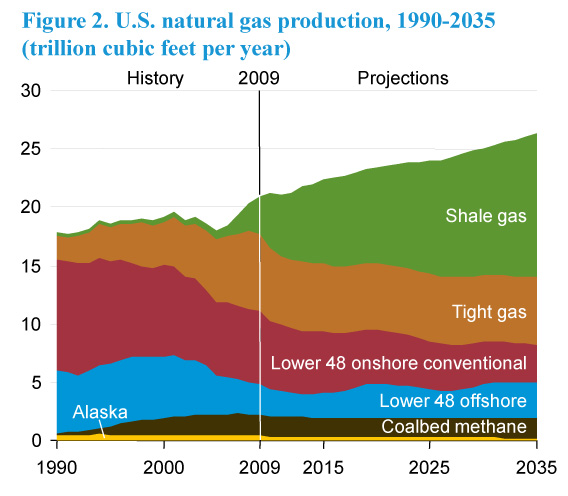
 Figure 1
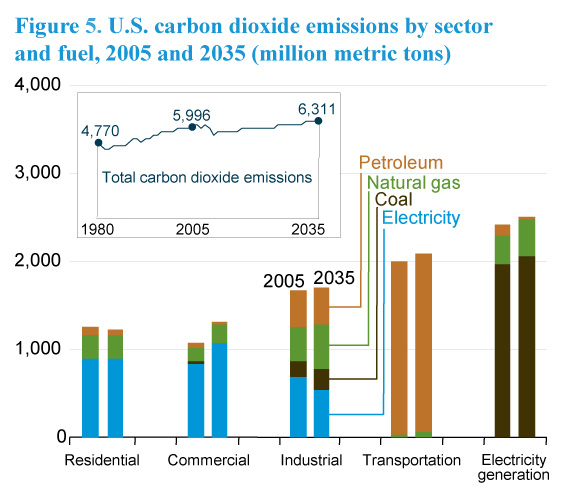
 Figure 2