Category Archives: Global

What Makes Buildings Green?

The beginning of the twenty-first century has ushered in the era of green buildings. According to some estimates, there are approximately 81 million buildings in the United States.1 Most of these buildings use energy inefficiently, generate large amounts of waste in their construction and operation, and emit large quantities of pollutants and greenhouse gases. In contrast to conventional buildings, green buildings seek to use land and energy efficiently, conserve water and other resources, improve indoor and outdoor air quality, and increase the use of recycled and renewable materials. While green buildings still constitute a tiny subset of existing buildings, their numbers are increasing rapidly. In November 2006, the U.S. Green Building Council, the nonprofit group responsible for the creation of the Leadership in Energy and Environmental Design (LEED) green building rating system, announced that 623 buildings had achieved some level of LEED certification.2 As of December 2009 this number had grown to more than 2,400, and over 35,000 buildings were in the process of achieving some level of LEED certification.3

While the definition of what constitutes a green building is constantly evolving, the Office of the Federal Environmental Executive offers a useful working definition. This agency defines this term as:

the practice of (1) increasing the efficiency with which buildings and their sites use energy, water, and materials, and (2) reducing building impacts on human health and the environment, through better siting, design, construction, operation, maintenance, and removal—the complete building life cycle.4

Similarly, the Environmental Protection Agency (EPA) defines green building as follows:

The practice of creating structures and using processes that are environmentally responsible and resource-efficient throughout a building’s life-cycle from siting to design, construction, operation, maintenance, renovation, and deconstruction. This practice expands and complements the classical building design concerns of economy, utility, durability, and comfort. Green building is also known as a sustainable or ‘high performance’ building.5

Both of these definitions mention life cycle assessment (LCA). LCA is the investigation and valuation of the environmental, economic, and social impacts of a product or service. In the context of green buildings, LCA evaluates building materials over the course of their entire lives and takes into account a full range of environmental impacts, including a material’s embodied energy; the solid waste generated in its extraction, use, and disposal; the air and water pollution associated with it; and its global-warming potential. LCA is an important tool because it can demonstrate whether a product used in a green building is truly green.6

The Most Important Element:
The Efficient Use of Energy

Buildings can incorporate many green features, but if they do not use energy efficiently, it is difficult to demonstrate that they are truly green. In fact, given that the term “green building” can be somewhat vague, some people prefer to use the term “high-performance building.” A high-performance building is a building whose energy efficiency and environmental performance is substantially better than standard practice.7

Although green buildings, on average, use less energy than conventional buildings, energy efficiency remains elusive. In fact, there is a growing debate whether buildings that achieve some level of LEED certification are more efficient in their use of energy than regular buildings.8 Fortunately, there are numerous ways to improve a building’s energy efficiency, from insulating walls to installing automatic shutoff switches for lights. Energy efficiency can be and often is mandated by local and state energy codes, which require that new and substantially renovated buildings comply with increasingly stringent energy efficiency requirements.9 It suffices to say that if a building is not energy-efficient, it cannot be said to be green.

The Reality of the Built Environment: The Problem of Existing Buildings

Although green buildings represent the next phase of buildings, the reality is that the vast majority of buildings are not green, and these buildings will continue to be used for many years to come. Improving the energy efficiency of existing buildings typically involves a process called retrofitting, which can mean anything from installing more energy-efficient fixtures to increasing the amount of insulation in a building. The U.S. Green Building Council has a rating standard specifically focused on existing buildings, referred to as LEED-EBOM (EBOM stands for “existing buildings operation and maintenance”). While greening existing buildings does not receive the attention that new green buildings do, it is certainly more important when looking at reducing the environmental impacts of buildings nationwide.

Impacts of Conventional Buildings
That Green Buildings Seek to Rectify

The environmental impacts of buildings are enormous. Conventional buildings use large amounts of energy, land, water, and raw materials for their construction and operation. They are responsible for large greenhouse gas (GHG) emissions as well as emissions of other harmful air pollutants. They also generate large amounts of construction and demolition (C&D) waste and have serious impacts on plants and wildlife. An analysis of these issues demonstrates the scope of the problem.

Energy Use in Buildings

Worldwide, buildings consume massive amounts of energy. The United Nations Environment Programme has reported that 30–40 percent of all primary energy produced worldwide is used in buildings.10 In 2008, the International Energy Agency released a publication that estimated that existing buildings are responsible for more than 40 percent of the world’s total primary energy consumption and for 24 percent of global CO2 emissions.11

The picture in the United States is strikingly similar. In 2004, EPA found that buildings account for 39 percent of total energy use and 68 percent of total electrical consumption.12 According to the U.S. Department of Energy (DOE), in 2006 buildings in the United States used 74.2 percent of all electricity generated.13 A report by the U.S. Energy Information Agency (EIA) estimated that 60 percent of the nation’s electrical production is utilized to operate commercial buildings, which include those used for education, mercantile, office, storage, and warehouse purposes.14 By any measure, buildings are responsible for using much of the energy produced today.

In addition, energy consumption is rising. In 2007, DOE projected that energy use in the United States will increase by approximately 19 percent by 2025.15 But that is only half of the problem. Not only does this country use a lot of energy, it does so inefficiently. America uses twice as much energy per unit of economic output as Germany, and nearly three times as much as Japan.16

Fortunately, there are many ways to improve a building’s energy efficiency. Simple measures such as weatherstripping, maintaining entry door closers, and installing storm windows as a low-cost alternative to replacements are usually the low-hanging fruit in weatherization. In addition, adding insulation materials to new and existing frame construction buildings is a proven and relatively inexpensive way to improve building energy efficiency with respect to heating and cooling. New innovations in insulation can reduce the energy used in manufacturing insulation and allow insulation to be recycled or biodegradable. Mineral, fibrous, and cellulose-derived materials are now available for insulation purposes.

Another large user of energy is a building’s heating, ventilation, and air-conditioning (HVAC) system. Properly designed and installed HVAC systems can reduce the amount of energy used for heating and cooling a building. An HVAC system includes a heater, air conditioner, and fan in one system and operates at a partial load nearly all the time. The design of the HVAC system as a whole-system mechanism saves energy by monitoring airflow and keeping the indoor temperature fairly constant. An HVAC system must have a correctly designed distribution system to minimize the amount of airflow (and thus energy) necessary to heat and cool the building. In addition, allowing building occupants to individually control heating and cooling in their living or working spaces is an effective way to reduce energy use.

Electric lighting consumes about one-quarter to one-third of the energy in a typical commercial building.17 Lighting also generates heat, so reducing the amount of energy consumed for lighting through effective and efficient lighting also reduces the size of a building’s air-conditioning plant. Building information modeling (BIM) enables building design and construction teams to draw and test the building’s operating systems, such as electricity or hot water, in one computer model. Modeling buildings with BIM can aid in quantitative energy analysis, connecting complex systems and allowing more precise analysis for better energy use.

Greenhouse Gas Emissions and Indoor Air Pollution

Given that buildings use large amounts of energy, and given that most of this energy comes from the burning of fossil fuels, it is not surprising that buildings in the United States are responsible for many millions of tons of GHG emissions annually. DOE has estimated that in 2006, buildings in the United States emitted 630 million metric tons of GHG emissions, approximately equal to the combined emissions of the United Kingdom, France, and Japan.18 U.S. buildings by themselves emit more GHGs than any other country in the world except China.19 On a percentage basis, buildings in the United States are responsible for approximately 40 percent of the country’s total GHG emissions.20

Unfortunately, greenhouse gases are not the only harmful pollutants that buildings emit. Indoor levels of air pollution may greatly exceed outdoor levels. Indoor air pollution is particularly important given that we spend most of our time indoors. The EPA has estimated that indoor levels of pollution may be two to five times higher, and occasionally more than 100 times higher, than outdoor air pollution levels.21 This pollution can come from a wide variety of sources.

One way to reduce the presence of these toxins is to ensure that indoor air is frequently replaced by outdoor air and to ensure that this outdoor air is properly filtered.22 Unfortunately, buildings are often poorly ventilated and do not sufficiently filter the air that is recirculated, leading to air that is potentially harmful to building occupants’ health. It has been estimated that the annual cost of building-related sickness is $58 billion.23

A primary consideration of green buildings is the health and well-being of their occupants. Many older buildings suffer from what is commonly referred to as “sick building syndrome.” According to the EPA, this term is used to describe situations in which building occupants experience acute health and comfort effects that appear to be linked to time spent in a building, but no specific illness or cause can be identified.24 Causes of sick building syndrome typically include inadequate ventilation, chemical contaminants from indoor and outdoor sources, and biological contaminants such as mold. The first step in eliminating the causes of sick building syndrome is carefully choosing the materials that are used in the building. Construction materials and interior finish products should be chosen that emit zero or low levels of volatile organic compounds (VOCs), which are harmful to humans and can vaporize at room temperature in a process called “off-gassing.”

Another important step in eliminating the causes of sick building syndrome is the building’s design. Green buildings are typically designed to provide adequate ventilation of air into them as well as filtration of this air to remove hazardous particles. Ventilation provides for the dilution of indoor air pollutants. In general, increasing the rate at which outdoor air is supplied to a building decreases the effect of these pollutants. Building ventilation can be done by natural or mechanical means. Air moves into and out of naturally ventilated buildings through windows, doors, vents, and other openings incorporated into the building design. Mechanical ventilation is accomplished by using HVAC systems to ventilate buildings.

Construction Materials

Building construction is a multibillion-dollar industry and requires the constant production and harvesting of millions of tons of a variety of raw materials to meet worldwide demand. By any measure, the amount of raw materials used in buildings is mammoth. Worldwide, construction activities consume 3 billion tons of raw materials each year, and it has been estimated that the construction industry consumes half of all products produced by volume.25 In the United States, buildings account for 40 percent of all raw materials used by volume.26

A crucial part of green buildings is the material that is used in their construction. Although definitions vary, green building materials are generally composed of renewable rather than nonrenewable resources and are environmentally responsible because their impacts are considered over the life of the product. In addition, green building materials generally result in reduced maintenance and replacement costs over the life of the building, conserve energy, and improve occupant health and productivity. Green building materials can be selected by evaluating characteristics such as reused and recycled content, zero or low off-gassing of harmful air emissions, zero or low toxicity, sustainably and rapidly renewable harvested materials, high recyclability, durability, longevity, and local production.

Construction, Operation, and Demolition Waste

Building C&D waste in the United States totals approximately 136 million tons annually, accounting for nearly 60 percent of total non-industrial waste generation. By way of comparison, the entire amount of municipal waste generated in the United States every year totals 209.7 million tons.27 According to some estimates, four tons of waste are typically deposited into a landfill during the construction of a new 2,000-square-foot home.28 Construction waste consists primarily of lumber and manufactured wood products (35 percent), drywall (15 percent), masonry materials (12 percent), and cardboard (10 percent). The remainder is a mix of roofing materials, metals, plaster, plastics, foam, insulation, textiles, glass, and packaging.29 Although much of this material is recyclable, most of it is deposited into landfills.30

Green buildings generally seek to minimize the amount of C&D waste they generate. One way they do this is by recycling or reusing C&D waste, such as by using inert demolition materials as base material for parking lots and roadways. For sites that include the demolition of existing structures, plans can be developed early in the design process to manage and reuse as much material as possible through the deconstruction, demolition, and construction processes. Demolition generates large amounts of materials that can be reused or recycled—principally wood, concrete and other types of masonry, and drywall. Rather than demolishing an entire building, all or part of a building can be deconstructed. Building deconstruction is the orderly dismantling of building components for reuse or recycling. In contrast to building demolition, deconstruction involves taking apart portions of buildings or removing their contents with the primary goal being reuse.

The Role of Lawyers in Green Building

Because green buildings are a relatively new phenomenon, there have been relatively few reported decisions that involve green building–related disputes.31 However, there are a number of issues unique to green building that are likely to become the subject of litigation in the near future. For example, what party is responsible if a building loses green building tax credits because of construction delays? On a more fundamental level, are laws that mandate certain green building standards unconstitutional if they delegate legislative functions to non-legislative branch entities?

Perhaps the most common issue faced by contractors, design professionals, and owners is that they fail to understand that there is a difference between a normal construction project and a green construction project. Consequently, parties often rely on standard contracts that do not necessarily address the risks unique to such projects. Failure to recognize such risks creates the potential for disputes and litigation at some point in the process.

Many legal issues involving green buildings will likely be familiar ones—e.g., drafting and negotiating of contracts and leases for green buildings, advising clients regarding applicable green building laws and incentives, and litigating liability issues, to name a few. However, many legal issues will be entirely new. For example, how will buildings be affected by economy-wide cap-and-trade greenhouse gas regulations that may be adopted in the near future? How will buildings adapt to the effects of climate change, and what laws will need to be put into place to ensure that building infrastructure is properly protected? What laws and regulations will need to be adopted to ensure that buildings will continue to become more energy-efficient and more reliant on renewable sources of energy? These and many more issues have yet to be fully addressed, and attorneys will play a crucial part in answering them.

Notes

1. U.S. Dept. of Energy Buildings Technology Program, Obama Administration Launches New Energy Efficiency Efforts (June 29, 2009), available at www1 .eere.energy.gov/buildings/news_detail.html?news_id=12607.

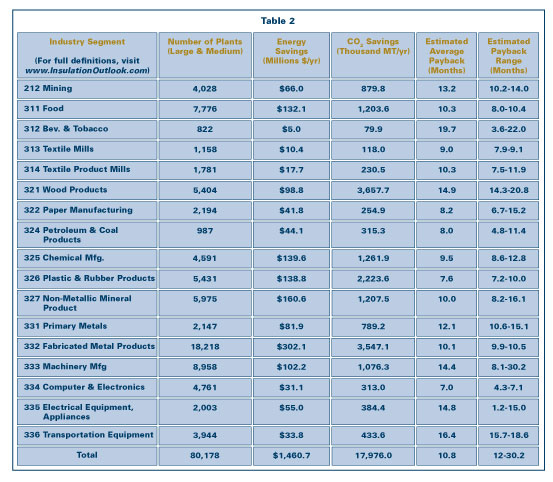
2. Jerry Yudelson, Where Are All the LEED Projects?, Table 2 (July 12, 2007), available at www.sustainablefacility.com/Articles/Leed/BNP_GUID_9-5-2006_A_ 10000000000000134921.

3. See U.S. Green Building Council, About USGBC, available at www .usgbc.org/DisplayPage.aspx?CMSPageID=124.

4. OFFICE OF THE FEDERAL ENVIRONMENTAL EXECUTIVE, THE FEDERAL COMMITMENT TO GREEN BUILDING: EXPERIENCES AND EXPECTATIONS, available at www.ofee.gov/sb/fgb_report.asp.

5. EPA, GREEN BUILDING, available at www.epa.gov/greenbuilding/pubs/about.htm.

6. In May 2008, the International Organization for Standardization (ISO) released a set of principles for evaluating building products throughout their life cycle. The standard, referred to as Sustainability in Building Construction—General Principles (ISO 15392:2008), is available for purchase at www.iso.org/iso/iso_catalogue/catalogue_tc/catalogue_detail.htm?csnumber=40432.

7. See U.S. Department of Energy, Office of Energy Efficiency and Renewable Energy, About High Performance Buildings, available at www.eere.energy.gov/buildings/highperformance/design_approach.html.

8. See, e.g., HENRY GIFFORD, A BETTER WAY TO RATE GREEN BUILDINGS: LEED SETS THE STANDARD FOR GREEN BUILDING, BUT DO GREEN BUILDINGS ACTUALLY SAVE ANY ENERGY? (2008). In the new update to the four primary LEED rating systems (new construction, existing buildings, commercial interiors, and core and shell), energy efficiency now accounts for more than one-third of all possible points. In addition, the LEED rating systems have upgraded to a more current energy efficiency standard—the American Society of Heating, Refrigeration, and Air-Conditioning Engineers (ASHRAE) Standard 90.1-2007.

9. For example, The New York State Energy Conservation and Construction Code, otherwise known as the State Energy Code and most recently updated in April 2008, encompasses commercial provisions based on the text of the International Energy Conservation Code (IECC) 2003 and ASHRAE 90.1-2004. All building-related codes in New York are currently reviewed and updated on a three-year cycle.

10. U.N. Environment Programme, Buildings and Climate Change: Status, Challenges and Opportunities 4 (2007), available at http://smap.ew.eea.europa.eu/media_server/files/R/S/UNEP_Buildings_and_climate_change.pdf.

11. INTERNATIONAL ENERGY AGENCY, PROMOTING ENERGY EFFICIENCY INVESTMENTS: CASE STUDIES IN THE RESIDENTIAL SECTOR, at 2 (2008).
12. U.S. Environmental Protection Agency, Buildings and the Environment: A Statistical Summary (Dec. 2004), available at epa.gov/greenbuildings/pubs/gbstats.pdf.

13. U.S. DEPT. OF ENERGY, 2008 BUILDINGS ENERGY DATA BOOK (Sept. 2008), available at buildingsdatabook.eere.energy.gov/docs%5CDataBooks%5CSEP_2008_BEDB.pdf.

14. See U.S. Energy Information Admin., Commercial Buildings Energy Consumption Survey, available at www.eia.doe.gov.

15. U.S. Dept. of Energy, Energy Information Administration, Annual Energy Outlook 2008 (Dec. 2007).

16. U.S. Dept. of Energy, Energy Information Administration, Annual Energy Review 2005 (June 2006).

17. See ENERGY STAR, LIGHTING (Energy Star Buildings Manual), at 1, available at www.energystar.gov/ia/business/BUM_lighting.pdf.

18. Annual Energy Outlook 2008, supra note 15. See generally GLOBAL CLIMATE CHANGE AND U.S. LAW (Michael B. Gerrard ed., Am. Bar Ass’n 2007).

19. KINZEY, THE FEDERAL BUILDINGS RESEARCH AND DEVELOPMENT PROGRAM: A SHARP TOOL FOR CLIMATE POLICY, 2000 ACEEE Proceedings, Sec. 9.21.

20. U.S. ENVIRONMENTAL PROTECTION AGENCY, BUILDINGS AND THE ENVIRONMENT: A STATISTICAL SUMMARY (Dec. 2004), available at epa.gov/greenbuilding/pubs/gbstats.pdf. In 2008, the International Energy Agency released a publication, Promoting Energy Efficiency Investments: Case Studies in the Residential Sector, which estimated that existing buildings are responsible for more than 40 percent of the world’s total primary energy consumption and for 24 percent of global CO2 emissions. The publication is available at iea.org/w/bookshop/add.aspx?id=326.

21. M. BAUM, GREEN BUILDING RESEARCH FUNDING: AN ASSESSMENT OF CURRENT ACTIVITY IN THE UNITED STATES 1 (2007). See also ENVIRONMENTAL LAW PRACTICE GUIDE, ch. 17C (M. Gerrard ed.) (LexisNexis Matthew Bender).

22. It should be mentioned that filtering air significantly increases building energy use.

23. See Green Building in North America: Opportunities and Challenges (Comm. for Env. Cooperation 2008), available at www.cec.org/files/PDF//GB_Report_EN.pdf.

24. INDOOR AIR FACTS NO. 4 (REVISED): SICK BUILDING SYNDROME (EPA Feb. 2008), available at www.epa.gov/iaq/pubs/sbs.html.

25. O. Hansen, Green Buildings: Small Business Innovation Research Special Solicitation Workshop (EPA March 2004).

26. Autodesk, Inc. 2005, Building Information Modeling for Sustainable Design, available at www.federalnewsradio.com/pdfs/BuildingInformationModelingfor SubstainableDesign-white%20paper.pdf.

27. BUILDINGS AND THE ENVIRONMENT: A STATISTICAL SUMMARY (EPA Dec. 2004), available at epa.gov/greenbuilding/pubs/gbstats.pdf.

28. ECO-WISE 2008, CONSTRUCTION WASTE: A SOURCEBOOK FOR GREEN AND SUSTAINABLE BUILDING, available at http://www.greenbuilder.com/sourcebook/ConstructionWaste.html.

29. Nebraska Energy Office, Construction Waste Minimization Methods, available at www.neo.ne.gov/home_const/factsheets/const_waste_min.htm.

30. Sustainable Sources, Construction Waste Recycling, available at constructionwaste.sustainablesources.com.

31. One such decision is AHRI v. City of Albuquerque, 2008 U.S. Dist. LEXIS 106706, *2 (D.N.M. Oct. 3, 2008)

When the U.S. Department of Energy’s National Renewable Energy Laboratory in Golden released its 506-page RFP for a non-negotiable LEED-Platinum-certified office building, it wasn’t clear how something jammed full of sustainable elements would take shape.

The RFP laid out not what the building should look like but how it should perform; it was up to the design-build team to come up with the rest. At 222,000 sq ft, the Research Support Facility, completed in June, is the largest net-zero-energy building in the nation, and is supported by a matrix of innovative features, most of which were designed by NREL scientists.

To select the design and construction team for the project, NREL developed a performance-based, design-build procurement process, which required prospective teams to develop a concept design and substantiate how they would achieve the 23 requirements set forth for the project and stay within the $64-million budget, says Greg Collette, DOE project officer.

“Requirements for the building included LEED-Platinum certification leading to net-zero operation, demonstrate active alternative-energy technologies, and serve as a model for construction, operation, and financing communities,” he adds.

But before there could be a design, or even a concept, there had to be a team. The project required an integrated design-build team of big brains and small egos that would work together to achieve a remarkable goal.

After reviewing qualifications, NREL invited three teams to compete by providing in 10 weeks a design addressing the agency’s performance-based RFP.

Haselden Construction of Centennial, Colorado, and RNL of Denver, which had joined forces as one of the three teams, quickly deduced that the only way to meet the client’s green requirements was to derive the building’s form and layout from them, and secondly, that the mechanical/electrical engineer would have to lead the way.

They determined to bring a leading mechanical contractor to the project and, though neither had worked with Stantec Inc.’s San Francisco office before, they asked the firm to join based on its solid reputation for innovation.

Stantec Principal John Andary and his team immediately started energy modeling, passive design simulations, and other related studies. It was not until a few weeks later, after the heating and cooling and lighting systems had already been selected, that the design team met in person for the first time.

“By the time we had that first meeting, the design competition had only 6 weeks left for design and price,” Andary says. “We couldn’t get off on the wrong foot.”

The entire team, including structural engineer KL&A out of Golden and civil engineer Martin/Martin Inc. of Lakewood, convened for an extended, 3-day charrette, where members confirmed their belief that the mechanical and electrical systems would be the linchpin of the design.

Joe Hall, KL&A’s lead structural engineer, says, “We knew that the mechanical and electrical drove the shape, the height—all of the building. The rest of the team worked from that point.”

More specifically, the team agreed that to achieve a net-zero energy building on this scale, building orientation, sun control, daylighting, and natural ventilation were all imperative. To realize it within the client’s inflexible budget, the design had to be simple, constructible, and repeatable.

Craig Randock, design principal for RNL, says of the initial charrette, “It was very collaborative, with all ideas and thoughts on the table. Usually people stick to their own expertise, but John [Andary] was thinking about this not as systems, but as a holistic building. We were on the
same page.”

Design-Build on Steroids

The Haselden-led group was the only team to actually put forth a concept for a net-zero building, and it won the competition. “There was so much jubilation about winning the job, but then the tough realization of, ‘How the heck are we going to do this?'” says Martin/Martin lead civil engineer Matt Schlageter. “It was a remarkable opportunity to make the industry understand that this type of building is possible, but then there was that little fear that it might not be.”

Part of the trepidation centered on the fact that the project was done completely at risk. The RSF is the first application of a new project-delivery model called progressive, performance-based design-build created by the DOE to address both sustainable and fast-track requirements.

“Because of the scale and the client, and the uniqueness of the project, working within the boundaries of a [set] fee was a little challenging,” Andary says.

Hall adds: The incentives “helped, especially since we were completely at risk. There were no more dollars. It makes the design-build team play differently because any change comes out of pocket.”

Schlageter calls the team one “of all the best minds, with everyone participating in what was almost an internal competition. Everybody came up with designs that challenged themselves. Everybody had new ideas, new things.”

A savvy and engaged client was another key to the team’s success.

“NREL did such a good job of explaining,” Randock says. “Yes, they are demanding because they want superior performance by the design team. They gave us feedback, rating us constantly on our performance. A demanding client makes everybody perform to a higher level.”

Path to Sustainability

Even though the RSF building is complete, the project itself isn’t over. One of NREL’s requirements was creation of a manual that could be used to guide future projects.

“Some of it had to be retrospective,” Andary says of the document. “We had to stop at several points and compile things to help us remember everything, but the real effort is yet to come. We have to strip away all the specifics of this project and recognize a process and a plan that could be applied to other projects.”

Schlageter adds: “You have to be able to replicate the process and the building. If it can’t be done twice, it’s a failure. It’s an evolutionary process. The next 50 buildings can take lessons learned from this one.”

Andary maintains that the most compelling lesson of the RSF was also the first: that engineering and performance goals can result in a project that is successful both aesthetically and programmatically. “Engineering-driven and energy-driven design, this is where the industry is going,” he says.

Figure 1
Figure 2

Find Incentives for Your Industrial Plant by City or Zip Code

The U.S. Department of Energy’s Industrial Technologies Program’s State Incentives and Resource Database contains nearly 3,500 programs that provide energy assessments, grants, rebates, loans, training, and other tools to help manufacturers identify and implement energy-saving projects. Information can be quickly accessed by city or zip code and searched by region, state, type of resource or energy system, and more. The recently updated database can be found on the Save Energy Now State and Regional Partnerships page or at www1.eere.energy.gov/industry/states/state_activities/incentive_search.aspx.

Federal Agency Purchasing Decision Makers Say Energy Efficiency Among Most Effective Ways to Meet Energy Needs, Reduce Costs, Lower Greenhouse Gas Emissions

Seventy-nine percent of U.S. federal government leaders charged with making recommendations or final decisions on agency purchasing believe that energy efficiency is among the most effective ways to meet energy needs, reduce energy costs, and lower greenhouse gas emissions, according to a Zogby International poll sponsored by the Alliance to Save Energy and Schneider Electric.

The independent survey of 201 government leaders asked participants to rate the importance of energy efficiency within their agencies, rate the agencies’ ability to comply with federal energy efficiency requirements, identify obstacles to that compliance, and identify attitudes towards energy efficiency within the agency.

The poll, released in conjunction with the GOVgreen Conference in November 2010, also found that:

  • Two-thirds (total of 66 percent) of the decision makers see either cost savings (36 percent) or environmental benefits (30 percent) as the major driver of their agencies’ energy efficiency efforts.
  • Approximately two-thirds (64 percent) of these federal agency decision makers believe that the current national economic environment and potential tightening of their agency’s budget might have an impact—presumably negative—on their ability to pursue energy efficiency projects. A third (32 percent) think the biggest obstacle to achieving their agency’s federally mandated energy efficiency goals is a lack of funding.
  • Roughly two-thirds (65 percent) of decision makers believe their agency has a culture that encourages energy efficiency practices throughout all levels and across all departments; and about half (49 percent) report that the significance of energy efficiency in their operations has increased in the last 2 years.
  • Sixty-six percent of respondents reported that cost savings and environmental benefits are the most important reasons driving their agency’s efforts to become more energy efficient.
  • Roughly 53 percent of government leaders say their agency has metered and audited all or most of their facilities to understand their energy consumption trends, benchmark building energy use, determine energy efficiency investment priorities, and measure and verify the impact/success of those investments.
  • In the last 2 years, half of those surveyed (49 percent) report that the significance of energy efficiency in their operations has increased, while 35 percent reported the significance was about the same, and 11 percent said it has decreased.
  • Roughly two out of five (38 percent) respondents said improving their agency’s energy efficiency is among its top five priorities, while more than a third (36 percent) say it is a second-tier priority. Only a fifth (21 percent) report that improving their agency’s energy efficiency is a low priority.
  • About two-thirds (65 percent) agreed that their agency “has a culture that encourages energy efficiency practices throughout all levels and across all departments, and employees have an understanding of their role in achieving agency energy efficiency goals.” Only 16 percent disagreed with that statement.
  • One in three (32 percent) think the biggest obstacle to achieving their agency’s energy efficiency goals is a lack of funding, while about a fifth (18 percent) think it is the lack of internal enthusiasm to execute, and another 18 percent see organizational barriers, such as procedures, as a major obstacle.
  • Thirty-seven percent report their agency is going to great lengths to apply practices like continuous monitoring, recommissioning technologies, and maintenance to ensure energy savings are maintained and improved throughout their facilities’ life-cycle, while a sixth (17 percent) say their agency is not making a great effort to apply such practices.

The survey of 201 U.S. federal agency decision makers with purchasing authority was conducted from October 12?19, 2010. The margin of error is +/- 7.0 percentage points.

For more information about The Alliance to Save Energy, visit www.ase.org. For more information about Schneider Electric and the company’s energy efficiency strategies for the government market, visit www.schneider-electric.us/go/government.

International Code Council Takes Action on ASHRAE Proposals

International building codes will incorporate requirements from a new inspection and maintenance standard from the American Society of Heating, Refrigerating, and Air-Conditioning Engineers (ASHRAE) and Air-Conditioning Contractors of America (ACCA), as well as match requirements from Standard 90.1, under several proposals recently approved by the International Code Council (ICC) membership.

Final action hearings took place during the last week of October to determine the final disposition on ASHRAE proposals to the ICC, which develops model codes that may be adopted by code jurisdictions in the United States or internationally. The actions taken will next appear in the 2012 I-Codes, due out in April 2011.

Under a proposal to the International Mechanical Code (IMC), inspection and maintenance of HVAC systems will be required by ANSI/ASHRAE/ACCA Standard 180-2008, Standard Practice for Inspection and Maintenance of Commercial Building HVAC Systems. The standard establishes minimum requirements for inspection and maintenance of HVAC systems to ensure proper functionality, which will save energy and money for the building owner in addition to preventing potential accidents by failing systems.

Also approved were proposed changes regarding energy stringency based on requirements in ANSI/ASHRAE/IES Standard 90.1-2010, Energy Standard for Buildings Except Low-Rise Residential Buildings. These changes include:

  • Modifying the piping insulation requirements.
  • Modifying equipment efficiency requirements for heat rejection and heat transfer equipment, including open and closed circuit cooling towers, chillers, unitary air-conditioning and condensing units, unitary and applied heat pumps, singe package vertical air conditioners, and packaged terminal air conditioners.

Also related to 90.1 was a proposal that rewrote the majority of the commercial chapter of the IECC. This proposal maintained the reference to the prescriptive requirements of Standard 90.1 and made the following requirements consistent with 90.1-2010: fenestration leakage, demand control ventilation, energy recovery, economizer efficiency, lighting controls, lighting system functional testing, and building area and space by space lighting power densities.

The proposal calls for an additional path of compliance for water-cooled chillers and consolidation of and new requirements for some of the existing categories.

For more information, visit www.ashrae.org.

Coalition of State Officials Agree to
Collaborative Approach on Regulating Energy Sector

A broad coalition of state energy, utility, and environmental officials agreed to conduct an ongoing dialogue on clean air and energy-related issues as the federal government moves forward with new environmental regulations. Of particular interest is implementing these environmental initiatives and reaping the associated benefits while not compromising energy reliability.

After their first meeting on December 2, 2010, representatives of the National Association of Clean Air Agencies (NACAA), the National Association of Regulatory Utility Commissioners (NARUC), and the National Association of State Energy Officials (NASEO) determined that strong communications among the three associations and their respective memberships is a necessity as the nation transitions to a clean-energy economy.

NACAA is the association of air quality agencies in 52 states and territories and more than 165 metropolitan areas across the nation. NARUC represents the state regulators who regulate essential utility services. NASEO represents the 56 State and Territory Energy Offices.

The December 2010 meeting in Washington was an informal gathering of approximately 50 state regulators and energy officials from all around the country, representing geographic and political diversity. The meeting served as a forum for participants to get acquainted and learn more about their peer agencies. Discussants made presentations on the critical issues facing environmental regulators, utility regulators, and the energy offices in their roles as governors? policy advisors. The participants recognized that studying more closely the interrelated nature of their work and sharing “best practices” would benefit not only the respective efforts of each group, but the entire nation as well.

“State and local air pollution control agencies are proud to partner with our energy and utility counterparts to collaboratively chart a course that allows all of us to fulfill our obligations to the citizens we serve,” said NACAA Executive Director S. William Becker. “The substantive discussions that we have just begun will enable us to understand and, therefore, be more sensitive to one another’s roles and responsibilities. Moreover, this initiative will facilitate our ability to explore ways to achieve critical environmental goals while ensuring the reliability of energy supplies.”

“As has always been the case, state agencies will continue leading the way in developing the country’s clean-energy infrastructure,” said NARUC Executive Director Charles Gray. “Bringing our members together with our colleagues from the air and energy offices is critical, particularly as the federal government considers new environmental rules. The agencies we represent perform essential functions on many of the same issues. Building common understanding between these organizations will help our states and, as a result, our country move forward.”

“States are key to moving energy issues forward in a way that balances energy, environmental, and economic development priorities. The meeting of the three key organizations representing state energy and air interests is a valuable way to better inform each groups’ members about these critical issues, and find means to collaborate with relevant federal agencies,” said NASEO Executive Director David Terry.

For more information, visit www.naseo.org.

Two New Green Building Offerings from USGBC: LEED for Retail and LEED Volume Program

The U.S. Green Building Council (USGBC) has launched LEED for Retail, its newest green building rating system, and the LEED Volume Program, a program designed to meet the certification needs of high-volume property developers. The programs were unveiled at the USGBC’s Greenbuild International Conference & Expo in November 2010.

The LEED for Retail rating system recognizes the unique design and construction needs of this market sector, enabling forward-thinking retailers to integrate green building design, construction, and operation into ground-up construction, retail interior, and build-out projects. Nearly 100 national and independent retailers and franchisees, including Bank of America, Best Buy, Chipotle, Wells Fargo, Citigroup, Kohl?s, LL Bean, McDonald?s, Pizza Fusion, Starbucks, and Target, have participated in the pilot program since its launch in 2007, providing valuable feedback to inform the rating systems’ development.

Also launched at Greenbuild was the LEED Volume Program, a certification program that was created to streamline and make the LEED certification process faster and more manageable for high-volume property developers such as national retailers, hospitality providers, and local, state, and federal governments. Utilizing a prototype-based approach, the program enables large-scale organizational builders to deliver a consistent end product, thereby earning LEED certification faster and at a lower cost than would be possible with individual building reviews.

Acknowledging that organizations can best identify the uniformity and similarities of their projects, the program was designed to be flexible, allowing owners to define the criteria for grouping similar buildings and the prototype LEED credits they plan to pursue. The Volume approach also facilitates bulk purchasing and advance ordering of materials, reduced consultancy requirements, more efficient internal processes, greater speed to market, and more precise documentation of corporate sustainability efforts.

In 2011, USGBC will introduce Volume certification for Existing Buildings: Operations & Maintenance. To learn more about LEED for Retail and the LEED Volume program, visit www.usgbc.org/leed/retail and www.usgbc.org/LEEDvolume.

The closure of the Flambeau River Papers in 2006 was not surprising. The mill’s enormous dependence on fossil fuel and its use of antiquated machinery had crippled the company in the face of rising energy costs. A fresh approach to energy management implemented by its new owners, however, changed the course for the company. The company has seen an increase in paper production by 11.9 percent since 2006, benefiting from an initial Energy Savings Assessment (ESA) offered by the U.S. Department of Energy’s Industrial Technologies Program (ITP), conducted in 2007, and subsequent changes at the mill. Steps such as fuel switch and energy efficiency improvements in the plant’s steam systems, combined with a grassroots approach that relies on its employees for recommendations, have all made it happen for Flambeau River Papers.1

Flambeau River Papers has been a major force of the economy for the city of Park Falls, a small town in northern Wisconsin with a population of roughly 2,262.2 Originally opened in 1896, the mill has been one of the largest employers of Prince County in Wisconsin, producing a variety of paper products, such as printing, cover stock, tag, reply card, index, freesheet, envelope, and laser bond paper. Park Falls was thus hit hard when Flambeau River had to shut down its mill in 2006 due to its exorbitant energy costs and antiquated machinery. The mill’s closure had left approximately 13.2 percent of the city’s residents unemployed.

Flambeau River, however, received a fresh lease on life under a new ownership led by Butch Johnson. All its previous employees were offered their jobs back at the same salary and benefits prior to the mill’s closing, an offer which was accepted by approximately 92.0 percent of them.3 The reopening of the mill also provided a unique opportunity to revise the company’s business model and identify what needed to be in place for the company to thrive.

The Mill’s Energy Challenges

Pulp and paper mills, traditionally large consumers of energy in the United States, are affected by rising energy costs if their processes are not using modern standards of efficiency and are heavily dependent on fossil fuels.

In 2006, paper mills throughout the United States consumed 2,354 trillion Btu of energy, approximately 11 percent of total energy consumed by the entire U.S. manufacturing industry.4 Between 2002 and 2006, the average industrial electricity price in Wisconsin rose 18.7 percent from $.0493 to $.0585 per kilowatt hour (Figure 1),5 while the average industrial natural gas price rose from $5.23 to $9.40 per thousand cubic feet—a much steeper increase of 79.7 percent (Figure 2).6 The climbing energy prices heavily impacted the operational costs of Flambeau River Papers.

Prior to the Flambeau River plant’s bankruptcy and closing in 2006, the plant consumed 1.3 trillion Btu in 2005 from fossil fuel. Although down significantly from the 1.5 trillion Btu from fossil fuel consumed the prior year, the mill’s energy consumption, coupled with skyrocketing electricity and natural gas prices, had a severe impact on the plant. The company was spending $11.0 million on energy.7 Controlling energy bills was thus a priority when the company came under new management after its purchase.

The New Energy Management Approach

Once the plant reopened and stabilized, Flambeau River Papers established energy efficiency and fossil-fuel-independence goals for the company and devised an energy management plan to ensure that these goals are met. In shaping its plan, the company management sought advice from employees for what could be done to improve the company’s energy situation and profitability.

The company aims to achieve its goals through energy trending, fuel switch, and continual process improvements. Most importantly, the company management decided to take a bottom-up approach, encouraging recommendations from plant-level staff for improved operations. The company believes that its goals will only be met if every employee commits to making energy efficiency a priority and through education. Based on the input received and other factors, the company’s Energy Committee updates a project prioritization spreadsheet each month—a tool that the plant uses to determine which energy efficiency improvements to implement next.8 As an Energy Committee rule, a minimum of 10 projects are on the prioritization list at all times, and committee members must identify funding sources for six projects while trying to have at least three projects going at any given time.

Further, in an effort to be energy independent, the company also plans for a biorefinery to come online by 2013. The company estimates the plant will consume 660 billion Btu from fossil fuels in 2009. The planned biorefinery is expected to produce 8.0 million gallons of Fischer-Tropsch mid-distillate, “green diesel,” and 8.0 million gallons of paraffinic wax each year that can be sold for candles and box lining among other uses. The green diesel will be sold for blending or “as is” use during warmer months.

Flambeau River’s energy management approach has been paying off in expanding the mill’s operations ever since. It has enabled the company to maintain a steady annual energy cost while increasing its production 11.9 percent from 135,000 to 151,000 tons of paper each year.9 These measures have also led to reduced labor costs.

Additionally, the company estimates to grow from its current 315 employees to 355 when its planned biorefinery comes online in 2013.10 The biorefinery will also serve an emissions goal set by the company—to make the mill carbon neutral by 2013.

Participation in an Energy Savings Assessment and Implementations

To help with the plant’s transformation, Flambeau River participated in August 2007 in an ESA. ESAs are a valuable resource for manufacturers provided by ITP to help identify ways plants can consume energy more effectively.

At the time of its ESA, the company was most concerned with reducing its natural gas consumption and opted to participate in a 3-day steam assessment of its natural gas boiler. The Energy Expert used a two-part process to complete the ESA. First, ITP’s Steam System Scoping Tool was used to profile and score steam system operations. The plant’s steam system scored 65.3 percent, which is rated as average. Next, the Steam System Assessment Tool was utilized to analyze potential energy and cost savings if the plant managers were to implement certain recommendations.

The ESA had identified several near- and mid-term opportunities (near-term is less than 2 years and mid-term is 2 to 4 years) to improve the plant’s steam system efficiency. The plant weighed all the recommendations in consultation with Focus on Energy, a state-based program that provides resources for energy efficiency projects, and decided to implement the following measures.

Energy Efficiency Improvements

The mill has improved its efficiency through the purchase, installation, and use of variable frequency drives, new pumps, lighting upgrades, and process improvements in the plant’s steam systems. The plant has also implemented heat recovery systems through the hood exhaust in the mill and biomass dryer and stack in the boiler house.

Additionally, a wastewater treatment system has been installed in the mill. The plant prioritized these recommendations after participating in the ESA and prioritization spreadsheet to determine which projects should be implemented next.11

Management implemented the hot water heat recovery system and installed pipe rerouting projects first because they required a plant shutdown. This action proved to be very economical because these projects were implemented before the employees came back to work.

Fuel Switching

Flambeau River Papers plans to no longer use coal as a base for its electricity, replacing it with other fuels such as pulp, bark, tree tops, branches, logging residue, and damaged wood as feedstocks for biomass. The company will also utilize wood tar from liquid smoke, red liquor, and industrial pellets to meet this goal. These feedstocks will be used to make ethanol at the plant’s biorefinery when it opens in 2013. Through the Fischer Tropsch process, the biorefinery will produce Fischer Tropsch second generation alternative fuel and paraffinic wax. The biofuel will also supply the mill with 150 psi steam for paper-making along with residual hot water.12

Implementation Support from Organizations and Programs

Overall, Flambeau River Papers invested $15 million on energy efficiency and alternative energy improvements. These improvements have been a collaborative effort where the state of Wisconsin and DOE helped provide consultation and a $5 million loan for implementing the recommendations (with $5 million from the state in matching funds). Focus on Energy and CleanTech Partners also provided technical support for the projects. (Focus on Energy is a state program that provides financing and resources to help Wisconsin residents and businesses implement energy efficiency projects. CleanTech Partners is a non-profit private organization also helping Wisconsin businesses invest in energy efficiency technologies.) To date, Flambeau River Papers has achieved $10.5 million in savings as a result of these projects.13

Energy and Financial Impacts

The mill has traditionally been heavily reliant on fossil fuels to meet the plant’s energy needs. However, Flambeau River Papers is steadily moving toward its commitment to reduce fossil fuel consumption each year until 2013 when the company aims to become energy independent.

In 2009, fossil fuels accounted for 48.0 percent of the plant’s purchased energy, 4.2 percent of which was used for building heat and steam systems and 37.0 percent for combined electrical generation. The mill will reduce its fossil fuel energy consumption 100.0 percent between 2007 when the mill was re-operational to 2013 when the biorefinery is scheduled to come online.14

Over the last 3.5 years, Flambeau River Papers has spent $15.0 million in energy projects and earned a total of $10.0 million through annual savings. If their annual savings stay level, the payback period will be 5.25 years.15

Conclusion

Flambeau River Papers’ energy management approach has resulted in $2.6 million in annual energy savings and increased the production by 11.9 percent since 2006, when the mill was shut down as a losing business. Tasking the plant-level staff with the responsibility of making energy improvements may be an effective strategy and a natural approach, given that the workers on the floor are the most familiar with the plant processes. Flambeau River’s energy management approach underlies a successful business model for manufacturers looking to improve their profitability and competitiveness.

Notes

1. Discussion with Butch Johnson on November 2, 2009.

2. U.S. Census Bureau. “Population Finder: Park Falls, Wisconsin.” http://factfinder.census.gov/servlet/SAFFPopulation?_event=Search&_name=park+falls&_state=04000US55&_county=park+falls&_cityTown=park+falls&_zip=&_sse=on&_lang=en&pctxt=fph. Accessed November 6, 2009.

3. Flambeau River Papers. “About: The Mill?Flambeau River Papers.” www.flambeauriverpapers.com/about/the-mill html. Accessed November 9, 2009.

4. Energy Information Administration. “First Use of Energy for All Purposes (Fuel and Nonfuel), 2006.” www.eia.doe.gov/ emeu/mecs/mecs2006/pdf/Table1_2.pdf. Accessed November 10, 2009.

5. Energy Information Administration. “Table 8. Retail Sales, Revenue, and Average Retail Price by Sector, 1990 Through 2007.” www.eia.doe.gov/cneaf/electricity/st_profiles/sept08wi.xls. Accessed November 10, 2009.

6. Energy Information Administration. “Wisconsin Natural Gas Industrial Price (Dollars per Thousand Cubic Feet).” http://tonto. eia.doe.gov/dnav/ng/hist/n3035wi3a.htm. Accessed November 10, 2009.

7. Presentation from Flambeau River Papers on November 6, 2009.

8. Correspondence from Randy Stoeckel on November 23, 2009.

9. Discussion with Butch Johnson on November 2, 2009.

10. Correspondence from Randy Stoeckel on November 23, 2009.

11. Presentation from Flambeau River Papers on November 6, 2009.

12. Ibid.

13. Correspondence from Randy Stoeckel on November 23, 2009.

14. Presentation from Flambeau River Papers on November 6, 2009.

15. Correspondence from Randy Stoeckel on November 23, 2009.

Figure 1

Average Industrial Electricity Price in Wisconsin

Figure 2

Average Industrial Gas Price in Wisconsin

Figure 3

Actual Annual Energy Efficiency Savings

In a day filled with leaking valves, failed pumps, corroding tanks, HVAC equipment failures, and an unlimited number of other crisis items, plant and maintenance managers have many issues to address before worrying about mechanical insulation. Mechanical insulation is often forgotten or pushed to the back burner either because it is seen as unnecessary or because cost overruns have used too much of the maintenance budget. In fact, one maintenance manager of a Kansas hospital cited his number one frustration with his job as “budget access, issues, and the paperwork required to tap into it.”

The truth of the matter is that proper and regular insulation maintenance can save a fortune in the long run. An un-maintained insulation system can lead to substantial energy loss, corrosion, safety issues, mold growth, and property damage.

Energy Loss

Insulation that has been stepped on, compressed, ripped, deteriorated by ultraviolet light, or saturated with water loses some, if not all, of its insulation value. Figure 1 clearly shows that the bottom pipe’s insulation is severely damaged and needs replaced, while the top lines need insulation and jacket on the fittings. What is harder to identify is that the insulation on the upper pipe is completely saturated with water. This wet and damaged insulation provides almost no insulation value at all on this low-pressure steam line.

Unfortunately, this system has spent many years damaged and exposed to the elements and has cost the facility a tremendous amount of losses in both dollars and Btus. The good news is that with a reputable insulation contractor, the proper material, and qualified installers, this system can be stripped, reinsulated, jacketed, and sealed and then last for years or decades.

A case study published at www.pipeinsulation.org stated that if the Inland Paper and Packaging Company in Rome, Georgia, replaced damaged insulation on their 150 psig steam process and added insulation to un-insulated tanks, “…then the savings per year would be approximately $230,000.” In any economic environment that would be significant; in today’s it is absolutely critical to take advantage of those opportunities.

Corrosion Under Insulation

Corrosion occurs when moisture is introduced under the insulation and comes in contact with the metal surface of a tank or piping (see Figure 2). The moisture can come from many sources, including rain, snow, mist from nearby systems, and wash-down equipment. When the pipe is too warm for the moisture to freeze and too cold to burn off the moisture, corrosion under insulation (CUI) can occur.

CUI is typically difficult to identify until it becomes a serious issue. How serious? A 2002 study by the U.S. Department of Transportation and Federal Highway Administration estimates that the direct cost for corrosion in the production and manufacturing industry is $17.6 billion.

It is essential that repairs to piping and tanks be reinsulated as soon as possible to eliminate the possibility of moisture entering the insulation system. It is equally important to specify and use the proper material for the repair. On below-ambient lines such as chilled water, the insulation contractor must first cut away any damaged or wet insulation before installing the new insulation. Great care must also go into properly sealing the insulation and forming an adequate vapor barrier to prevent moisture from penetrating into the new insulation.

On exterior lines of any temperature range, the proper insulation jacket must also be selected according to the facility conditions. In high abuse areas where a metal jacket is needed, seams must be positioned where wind cannot easily drive rain into the jacket, and caulking must be applied on end caps, valve stems, penetrations, fitting seams, and any other location that could allow moisture into the insulation. On tanks and vessels, the metal jacketing must be installed using techniques to properly shed water, and any penetrations of the jacket must be caulked and sealed.

Maintaining caulking is also important to maintain the original water-tight seal. Selecting an insulation with a corrosion inhibitor, properly painting the pipe, or coating it with ant-corrosion gel can help keep corrosion at bay.

Issues to watch for that could lead to CUI include:

  • damaged metal jacketing or exposed insulation
  • ice build-up (see Figure 3)
  • broken seals or missing caulking (see Figure 4)
  • large variations in surface temperature of the insulation, which may indicate saturated insulation
  • floods or unusually severe weather affecting piping or equipment not normally impacted by weather.

Safety

Burn hazards are one of the most common maintenance issues encountered in an industrial facility. Exposed flanges, valves, damaged insulation, and other insulation problems can provide ample opportunity for plant personnel to burn exposed skin. It takes just a matter of seconds to receive a significant burn from an exposed steam line.

Consider the steam connections on the heat exchanger in Figure 5. The facility could eliminate the burn hazard for a few hundred dollars by installing removable insulation blankets over the flanges; instead, the flanges sit exposed approximately 30 in. off the floor.

As with other insulation applications, insulation selection is just as important in removable blankets. In another facility, a removable blanket had been built for a 600 lb. steam valve. At first sight it appeared adequate, but on further inspection the material was browning and brittle and the surface temperature was still too high to be safe. Selecting the right insulation and blanket material up front would have saved time, money, and a potential accident.

In addition to burn hazards, safety hazards that could result in personnel getting cut or poked are often overlooked when it comes to insulation. If pipes or tanks have a metal jacket installed over the insulation, care must be taken to ensure there are no sharp edges, missing end caps, tie wire, loose bands, or other exposed hazards. A poorly cut seam can leave jagged edges that could slice a finger or an arm of anyone walking by. A missing end cap could leave hot pipe exposed or make it easier for a worker to catch a shoulder or forearm on the exposed metal joint that remains. Loose bands or tie wire can create tripping hazards or, if elevated, result in an eye injury.

Mold and Property Damage

Typically, chilled water is one of the biggest culprits in mold growth and property damage. Problems with chilled water can lie undetected for months or years, depending on the length of the cooling season.

For example, if the insert material for a PVC fitting cover was not installed properly, condensation can build up in that fitting. If the fitting is taped correctly on the outside, it can hold that condensation and cause it to wick down the line. After some time the condensation will settle in the lowest portion of the pipe. This author has seen some condensation problems so bad that the owner thought it was a pipe leak.

The downside of all this moisture is mold growth. In Figure 6 the chilled water insulation was damaged and never repaired properly, resulting in mold growth. All the chilled water insulation in this area had to be stripped and replaced.

In Figure 7, the chilled water pump was at one point properly insulated; however, after the last pump maintenance, the insulation was never repaired. There is continuous condensation, and mold has developed on the pipe insulation. By not re-insulating this chilled water pump, the owner allowed the condensation problem to become so bad that water runs under the equipment pad and seeps into the offices below. It has slowly saturated ceiling insulation, sheetrock, and ceiling tile in the offices, resulting in an even bigger mold issue.

The costs to fix this quickly escalated, and instead of hiring a qualified insulation contractor for
1 day to fix the pump after maintenance, the facility will have to relocate offices, have the mold professionally removed, hire a sheetrock and ceiling company to make repairs, and finally hire an insulation contractor to re-insulate the pump and the piping associated with it. Putting off a 1-day repair is now going to cost a week.

Entire books could be written on the maintenance topics above; this article has barely scratched the surface of the benefits of a proactive insulation maintenance program. As much of the country heads into the coldest part of the winter, the risks of waiting to properly repair damaged insulation should be considered.

Proper insulation maintenance is easier when the original installation was performed by a qualified insulation contractor. Don’t be afraid to ask for work history, references, and even pictures of previous installations, which any professional contractor will be happy to provide. To find an insulation contractor in your area, visit the National Insulation Association’s Membership Directory at www.insulation.org/membership.

Figure 1

Missing insulation and jacket on low pressure steam

Figure 2

Corrosion on a pipe and flange

Figure 3

Ice build-up on an ammonia line

Figure 4

Smashed aluminum elbow, resulting in broken end cap and caulking

Figure 5

Exposed flanges on a heat exchanger

Figure 6

Moldy pipe insulation

Figure 7

Missing pump insulation and moldy pipe insulation

Mechanical insulation in commercial buildings is often hidden behind walls, above ceilings, and in mechanical rooms where only a few have access. In manufacturing or industrial facilities, it is more often exposed to the view of all who venture by. Yet, it seems invisible when energy conservation initiatives are investigated, and it is seldom considered from a return on investment perspective. An investment opportunity that can provide over a 100 percent annual return, help reduce our dependency on foreign energy sources, improve our environment, and stimulate our economy by creating thousands of “shovel ready” jobs is hidden in plain sight.

Industry has been estimating for years that between 10 percent and 30 percent of all exposed mechanical insulation becomes damaged or missing within 1 to 3 years of installation. Over time, and depending on the operating environment and exposure to the elements, that percentage is likely higher. Those estimates have been confirmed by recent data in the industrial sector, and there is no reason to think the commercial sector fares better.

A modest increase in the use of energy-efficient mechanical insulation would allow the United States to quickly generate significant energy demand reductions in the industrial sector, create tens of thousands of green jobs, and help cut the nation’s greenhouse gas emissions.

Assessing the Potential

In 2009 the National Insulation Association (NIA) worked with Oak Ridge National Laboratory (ORNL) and the U.S. Department of Energy’s (DOE’s) Industrial Technologies Program (ITP) to assess possible gains in large and medium industrial facilities. NIA relied on data from DOE’s Save Energy Now program, which conducts energy audits of industrial facilities, to determine the energy and environmental benefits in large and medium plants from mechanical insulation and other initiatives. The assessments identified missing, damaged, or un-insulated areas—maintenance opportunities for mechanical insulation systems. Working again with the ITP, ORNL, and Project Performance Group (PPC), NIA examined a database that included an 83 percent increase in assessments through May 2010. The increased database added to the statistical significance of the data extrapolation and allowed analysis across multiple industry sectors. The 2010 study confirmed the energy and emission reduction, annual rate of return, and job creation opportunities that increased focus on and implementation of mechanical insulation maintenance would create.

NIA and its partners in this effort estimate that mechanical insulation could deliver annually $3.7 billion in energy savings and reduce 37.9 million metric tons of carbon emissions, with a return on investment in 11.3 months (106 percent annual return) from simple maintenance of mechanical insulation in industrial/manufacturing plants. NIA estimated this maintenance work would create more than 27,000 jobs per year for insulation contractors, of which 90 to 95 percent are small businesses, in all 50 states. Those 27,000 jobs support other industry channels with job opportunities of more than 13,000, bringing the total job creation opportunity to 40,000. NIA also noted that 95 percent of materials required for these opportunities are made in the United States, with most of the balance made in Canada.

The Save Energy Now assessments were primarily focused on process heating and steam systems and did not include potential efficiency gains achievable in small industrial plants, the power/utility sector, or the commercial sector (hospitals, schools, government buildings, etc.). Nor do the estimates consider energy efficiency improvements from increased use of mechanical insulation in new industrial or commercial facilities. Using the Save Energy Now assessment data, NIA estimated the maintenance potential in small industrial plants and the power/utility sector.

Said Jef Walker, Supervisor, Partnership Development and Deployment for ITP, “Many of the large and medium plant energy assessments sponsored by the U.S. Industrial Technologies Program have identified mechanical insulation improvements as an important savings opportunity. Improvements in mechanical insulation in large and medium U.S. industrial plants are often a cost-effective opportunity for reducing energy use and energy costs and should be seriously considered.”

These findings confirm once again that mechanical insulation is truly an overlooked and undervalued technology.

The Analysis Approach

The plants were segregated into three size categories:

  • Large Plants, using >500 BBtu/yr, in which the assessments were conducted by independent assessors approved within the SEN program. The Power/Utility industry segment was not included in the scope of the assessments.
  • Medium Plants, using 26-500 BBtu/yr, in which the assessments were conducted by the ITP’s Industrial Assessment Centers.
  • Small Plants, using <26 BBtu/yr, which were not included in the scope of the ITP assessments.

The numbers of plants within the size categories were determined from the 2002 Energy Information Administration Manufacturing Energy Consumption Survey (EIA-MECS). Those plants were then subdivided into two areas: the plant categories or type that were included in the scope of the ITP assessments and those that were not (Apparel, Leather and Allied Products, Printing, and Furniture). (See Figure 1.)

The assessment results were then extrapolated to the total number of plants in the large and medium size categories.

Figure 2 shows the number of large and medium plants by industry segment and their potential energy cost savings, CO2 reduction, and estimated payback for investing in mechanical insulation maintenance.

Using the Medium Plant category findings, NIA estimated the Small Plant category to resemble the Medium Plant findings but limited the savings to 50 percent of Medium Plant totals. Some may believe that is conservative, given that the number of small plants is 75 percent of the Medium Plant total and in many cases small plants pay less attention to energy efficiency than larger facilities do. Others may have a different opinion of that estimate.

Consistent with the 2009 report, NIA estimated there were 6,483 utility plants not included in the scope of the Save Energy Now assessments. The number of Public Utility/Power plants was determined by examination and extrapolation of data from the Energy Information Administration’s 2000 Existing Capacity at the U.S. Electric Utilities & 2007 Energy Capacity by Existing Source. (Hydroelectric and wind units were not included.) NIA then estimated the opportunity for those plants to be of similar magnitude to the opportunities identified in the Large Plant assessments.

The Bottom Line: Mechanical Insulation Maintenance is a Proven Investment Opportunity Hidden in Plain Sight

By extrapolating from the results of more than 1,100 assessments and insulation recommendations from the Save Energy Now independent assessments of Large and Medium size plants, it is estimated that mechanical insulation could:

  • Deliver annually $3.7 billion in energy savings
  • Reduce 37.9 million metric tons of carbon emissions
  • Provide a return on investment in 11.3 months (106 percent annual return)
  • Create more than 27,000 jobs per year for insulation contractors, of which 90 to 95 percent are small businesses, in all 50 states.

Those 27,000 jobs support other industry channels with job opportunities, bringing the total job creation opportunity to 40,000. Of materials required for these opportunities, 95 percent are made in the United States, with most of the balance made in Canada.

Even more impressive, these estimates are based primarily on the results of assessments on process heating and steam systems. They do not include manufacturing processes or other opportunities in the industrial or manufacturing sector or any opportunities in the commercial sector. Just how big is the total opportunity: $5, $7, or $10 billion? The answer is not known, but it is large, with a phenomenal return.

Barriers to Implementing an Aggressive and Continuous Mechanical Insulation Maintenance Process

Insulation can reduce energy consumption and greenhouse gas emissions, increase available carbon credits, be an important part of sustainable design initiatives, be part of a safety program, increase manufacturing productivity, eliminate or reduce corrosion under insulation, control condensation and mold growth, and provide an unrivaled return on investment. So why is it a “forgotten technology”? Following are some common reasons.

  • Many decision makers lack detailed knowledge about mechanical insulation systems, their benefits, and the risk of not maintaining them in an effective and timely manner.
  • Every plant, facility, or company needs a mechanical insulation “champion.”
  • Good or best practices in one unit/plant need to be widely diffused within and between organizations.
  • Decision makers need motivation to allocate attention and resources. Financial modeling should be considered as part of the decision process.
  • Timely and effective insulation maintenance is an investment, not an expense. The damage or cost caused by reduced focus on mechanical insulation is often not identified in technical and/or financial terms until it may be too late.
  • There is usually pressure from competing and often more “glamorous” initiatives. Mechanical insulation is not “sexy” to many. But, a 100 percent annual return is sexy in any language.

This 2010 updated study confirms that the cost of a good insulation system can be easily calculated. The cost of an underperforming insulation system is an investment opportunity that should not be overlooked.

To take full advantage of this forgotten technology, it is essential to begin thinking differently about mechanical insulation. While mechanical insulation maintenance is neither sexy nor an exciting topic of discussion, it is an opportunity hidden in plain sight. When all the benefits are considered, the decision should be easy.

Acknowledgements and Information about the Mechanical Insulation Education and Awareness Campaign

The information in this article is a direct result of the DOE-ITP’s Mechanical Insulation Education and Awareness Campaign (MIC). Appreciation is extended to all who have worked and continue to work to develop this type of information and provide education about all aspects of mechanical insulation in all industry segments.

The MIC is a program to increase awareness of the energy efficiency, emission reduction, economic stimulus, and other benefits of mechanical insulation in the industrial and commercial markets. Mechanical insulation’s potential to play a significant role as a tool to reduce energy intensity is immense. However, the lack of sufficient data to support its energy efficiency potential, combined with a deficient understanding of what mechanical insulation is and how it could be used, impedes policy makers and actors in industrial and commercial sectors in making a supportable case for increased use and maintenance of mechanical insulation. While current uncertainties hinder mechanical insulation from playing a larger role in energy efficiency decisions, the Mechanical Insulation Education and Awareness Campaign was created to meet two key initiatives:

  • Educate industry on and promote the benefits of mechanical insulation by providing practical data and case studies outlining potential energy savings provided by mechanical insulation installation;
  • Launch an aggressive public education and awareness campaign on the heels of President Obama’s call to combat climate change and improve energy efficiency.

As part of efforts by the DOE-ITP to improve energy efficiency of the U.S. industrial and commercial sectors, Project Performance Corporation and NIA, in conjunction with its alliance with the International Association of Heat and Frost Insulators and Allied Workers, are working together to design, implement, and execute the MIC. Save Energy Now is a national initiative of the ITP to drive a 25 percent reduction in industrial energy intensity in 10 years. For more information, visit www1.eere.energy.gov/industry/. To learn more about NIA, visit www.insulation.org. To learn more about the International, visit www.insulators.org.

Figure 1
Figure 2

Brown University is a school of 8,700 students and 700 faculty members in Providence, Rhode Island. The University operates a hot water and chilled water distributed energy system run off a co-generation plant. The hot and chilled water is distributed in pipes running through a system of tunnels and manholes. The existing piping was insulated and jacketed with aluminum about 30 years ago and had sustained human and mechanical damage over time. Any insulation system needs regular maintenance, but insufficiently trained personnel can inadvertently damage it (see the “Maintenance at a Glance” sidebar).

The conditions in the tunnels are humid, damp, and wet—typical of many campus underground utility-piping systems. Age, rainwater and snow melt, condensation from the chilled waterlines, and humid air raised concern about pipe corrosion. Due to the damage, varying degrees of moisture were detected in the existing insulation, and water on piping is a corrosion risk.

Project Specification and Changes

The specification called for removal of existing insulation, brushing the pipe surface clean for inspection, and applying new insulation and jacketing. The project to remove and re-insulate the hot and chilled water lines was issued to Anchor Insulation Company, Rhode Island.

A site visit was conducted at the selected area on a campus city street. Two manholes about 80 feet apart exposed what looked like four 6-foot 8-in. pipe runs through the dark, 18-foot-deep tunnel. The existing insulation and jacketing were damaged from 30 years of moisture, foot damage from repairmen, and insufficient maintenance. Two of the lines were 345°F high-pressure hot water, while the other two were 40°F chilled water pipes. The manholes contained vertical risers of each pipe in addition to the horizontal runs.

A rigid insulation was originally considered. The confined space in the tunnel, illustrated in Figure 4, would be challenging for the crew transporting long segments of any rigid insulation through the tunnel, which had barely enough room for the men to crawl through. In tight spaces, the uninstalled insulation would be in the way, potentially obstructing an emergency exit or rescue. Climbing over and around the stock in such tight quarters would be a drawback. Access to the tunnel was limited and required advanced planning (as explained in the safety overview).

After Anchor Insulation evaluated the unusual circumstances and the cramped conditions 18 feet under the road in the tunnel, they considered their insulation material options. Their customer understood the obstacles in these difficult conditions and was open to discussion of options, since many different types of insulation could be used. Together the project team decided on flexible silica aerogel blanket insulation.

Silica Aerogel Insulation

Silica aerogel is a nanoporous form of amphorous silica that exhibits unique physical properties, including extremely low thermal conductivity. Although silica aerogel is a fragile material and difficult to install in monolithic form, a composite material of silica aerogel material impregnated into a nonwoven batting material shares the properties of a flexible batting material and the thermal resistance of aerogel.

Because aerogel has a good thermal conductivity, it requires less thickness to reach the equivalent thermal resistance. This feature was particularly helpful at Brown when dealing with the narrow clearances for the lowest pipe in the pipe rack, where mud had collected in the tunnel. The final insulated pipes could be significantly thinner in profile than the original specification.

Installation Overview

The first step was cutting required pieces outside the confined space. One insulator cut pieces, rolled them up, and passed them into the manhole. A substantial number of cut pieces could be lowered into the workspace without blocking egress. The material then was maneuvered down the tunnel without fear of breakage.

The silica aerogel pieces were fitted onto the pipe sections by wrapping around the circumference of the 6 in. NPS. Adhesive and tape were used to hold the wrapping in place and seal circumferential and longitudinal seams on the chilled water lines. Finally, the embossed aluminum jacketing was wrapped over the installation.

Safety Overview

The project presented a variety of safety challenges. First, all the work was conducted in confined space and required full-body protection, Tyvek suits, and full-face respirators. In addition, each man had to be in full fall protection to facilitate rescue if needed. Continuous air monitoring was required, and an exhaust and supply air fan were on site to control airflow and temperature. Additional construction lighting was added to increase the workers’ visibility.

“Confined space” does not always equate to a tight area, but this tunnel space was extremely tight. With multiple associates working in the same space, as the work required, strict production rules had to be established and maintained to avoid interruption of work flow and, more importantly, to maintain a safe environment for the demanding work. Site access and traffic control, along with hole monitoring and standby rescue, made the job even more complex.

Results

The difficult and unusual conditions involved in working in a cramped tunnel 18 feet below a campus road called for innovative thinking, planning, and safety awareness. The contractors involved needed to understand the unique circumstances, modify the insulation specification, and research the proper insulation for the job.

After the completion of the installation, the Anchor Insulation and Brown University workers had an easier time maneuvering and a safer environment, and therefore they were more efficient and spent less time in the tunnel. Future maintenance, which all insulation systems require, also will be facilitated by the expanded space for passage of personnel in the tunnel due to reduced pipe insulation thicknesses. Additionally, this work earned Anchor Insulation the 2010 “Excellence In Construction” award from the Rhode Island chapter of the Associated Builders and Contractors (ABC) association for outstanding performance in the following areas: safety, complexity, timeframe, and challenges that needed to be overcome.

To learn more about insulation products, visit www.insulation.org. To submit a case study, e-mail editor@insulation.org.

Figure 1

Conditions prior to project.

Figure 2

Insulation degraded by age and moisture.

Figure 3

Evidence of pipe corrosion that needs inspection.

Figure 4

Limited tunnel working space.

Figure 5

Wrapping of silica aerogel insulation on pipe, followed by jacketing and banding.

Figure 6

Example of field-cut “lobster-tail” allows insulation material to conform to elbow.

Figure 7

Manhole confined space access point.

Figure 8

Confined space access ladder and piping.

Figure 9

Work underway with insulator dressed in full personal protective equipment.

Figure 10

Photo of tunnel before insulation replacement.

Figure 11

Photo of tunnel after insulation replacement. Note increased spacing between pipes and improved view and available room for routine maintenance.

Legislation has been pending in Congress since April 2009 to significantly amend the Occupational Safety and Health Act of 1970. An Occupational Safety and Health Administration (OSHA) reform bill was introduced to the House of Representatives in the spring of 2009. A similar piece of legislation, the Protecting America’s Workers Act (PAWA), was introduced into the Senate by Edward M. (Ted) Kennedy in early August 2009.

Recently, the House of Representatives attached much of PAWA as an amendment to the Robert C. Byrd Miner Safety and Health Act of 2010, H.R. 5663. On July 21, 2010, H.R. 5663—with OSHA remedial legislation attached—was voted out of the House Education and Labor Committee on a party line vote of 30 to 17. While Republicans sought to scale back the bill through several amendments, all the amendments were defeated. It next goes to the full House for a vote, not yet scheduled as of the writing of this article.

Whistleblower Protection Extension

The amendments to H.R. 5663 will enhance whistleblower protections under OSHA considerably. Even without the proposed amendments in H.R. 5663, a significant increase has been observed in the number of complaints filed by employees terminated or laid off from their employment alleging that they have been discriminated against because they engaged in some protected activity under the law. With regard to OSHA discrimination or whistleblower protections, OSHA already reads the definition of “protected activity” broadly. The proposed amendments to whistleblower protection in the current law will greatly expand the “protected class” under OSHA.

Protected activity under the Occupational Safety and Health Act of 1970 is defined in Section 11(c), which states “no person shall discharge or in any manner discriminate against any employee because such employee has filed any complaint or instituted or caused to be instituted any proceeding under or related to this act, or has testified or is about to testify in any such proceeding, or because of the exercise by such employee on behalf of himself or others of any right afforded by this act.” As one of the rights afforded to employees by OSHA is the right to be provided a safe place of employment, this phrase in Section 11(c)(1) is intended to cover employees who make safety complaints to their employers related to their working conditions.

Under the proposed amendment, this definition will be extended to include any employee who has been discharged or in any way discriminated against for reporting any injury, illness, or unsafe condition. This will extend whistleblower protection to any employee who files a workers’ compensation claim with the employer. Because OSHA now investigates any complaint of discrimination by an employee under the Act, it is conceivable that an employee who filed a workers’ compensation claim (reported an injury or illness) in 2009 and was terminated for tardiness or absenteeism in 2010 could complain to OSHA that he or she was terminated because he/she filed the workers’ compensation claim in 2009. This may seem a stretch, but this is one area in which OSHA currently finds against employers unless the conditions prove otherwise.

If OSHA responds as it currently does when receiving a whistleblower complaint, it will undertake a full investigation of the allegations raised by the employee immediately upon receipt. If the proposed language becomes law, employers will have to take a hard look at their current disciplinary procedures to be sure that they have sufficient documentation to protect themselves against frivolous claims.

The amendments also establish a separate adjudication system for whistleblower complaints and a new schedule of damages and settlement procedures. The amendment under the section for relief provides that, in addition to reinstatement without loss of position or seniority, the complaining employee would be entitled to receive “compensatory and consequential damages sufficient to make the complainant whole (including back pay, pre-judgment interest, and other damages); and expungement of all warnings, reprimands, or derogatory references that have been placed in paper or electronic records or databases of any type relating to the actions by the complainant that gave rise to the unfavorable personnel action….”

In addition to these damages, there is a provision for attorneys’ fees and costs: “if the secretary or an administrative law judge, review board, or court grants an order for relief?the secretary, administrative law judge, review board, or court, respectively, shall assess at the request of the employee against employer reasonable attorneys fees; and costs (including expert witness fees) reasonably incurred, as determined?in connection with bringing the complaint upon which the order was issued.” Thus, in addition to returning the employee to his/her prior position of employment with back pay, the employer would be liable for pre-judgment interest and any attorneys’ fees the employee might incur in bringing or pursuing the complaint against the employer.

Victim’s Rights Created

The OSHA amendment also contains, in Section 702, language amending Section 9 of the Occupational Safety and Health Act of 1970 creating a body of victim’s rights for any employee injured on the job whose injury results in an OSHA investigation, as well as for the immediate family members of any employee killed on the job whose death results in an OSHA investigation. These rights will permit victims to meet with the Secretary (area director) regarding the inspection or investigation prior to the Secretary’s decision to issue a citation or to take no action. They also will receive a copy of any citation or report issued as a result of any such inspection and be informed of any notice of contest or addition of parties to the proceedings after the citation is issued.

Victims will be provided notification of the date and time of any proceedings, service of pleadings and other relevant documents, and an explanation of the employer’s rights under the Occupational Safety and Health Act. They also will have the right to be notified of the time and date of any proceeding before the Review Commission and to receive copies of any pleadings or decisions relating to the proceeding before the Review Commission, as well as an opportunity to appear and make a statement before the Administrative Law Judge hearing the matter or before the full Review Commission hearing arguments on the case in accordance with whatever rules the Review Commission establishes to permit such a statement to be made. Finally, prior to entering into any agreement to withdraw or modify a citation issued as a result of an inspection, the victim or his/her representative will be provided an opportunity to appear and make a statement before the parties conducting settlement negotiations. To facilitate this language under the amendment, the Secretary shall designate at least one employee in each area office of OSHA to serve as a family liaison.

Abatement Period Changes

Section 703 of the amendment will affect Section 10 of the Occupational Safety and Health Act of 1970. It will be subject to interpretation (and probably litigation), but here is a look at how some of the language in the amendment might be applied to employers.

First, the amendment states that for each violation the Secretary designates as serious, willful, or repeated, the abatement period will begin to run upon receipt of the citation. The amendment also states that the filing of a notice of contest by the employer will not operate as a stay of the period of abatement. Currently, when a notice of contest is filed, the period to abate the citation is stayed or tolled pending the outcome of the notice of contest. Under the language of the amendment, the employer will have to begin abatement immediately upon receipt of the citation.

In other words, if the abatement period set out in the citation is “immediate,” the employer will have to correct the alleged problem even if the notice of contest is filed immediately upon receipt of the citation. This does not account for situations where citations have been incorrectly issued by compliance officers and later vacated either prior to or as a result of litigation. Under the amendment, even if the employer is right, he/she will have to expend resources to take what may prove to be unnecessary corrective action unless he/she spends other resources to use the one alternative the amendment offers: There is a provision in the amendment for the employer to file a motion with the Commission for a stay of the abatement period. The employer must demonstrate a substantial likelihood of success in the notice of contest, that the employer will suffer irreparable harm absent a stay of the abatement period, and that a stay will not adversely affect the health and safety of workers. In practical terms, these conditions likely will eliminate filing a notice of contest to stay abatement to negotiate a settlement of the citation unless the employer can demonstrate substantial likelihood of success in defending the citation if the notice of contest goes forward.

The Review Commission is instructed under the amendment to develop rules of procedure to conduct a hearing on such a motion for a stay on an expedited basis. The amendment provides that a hearing before the Administrative Law Judge on motion for such a stay shall occur not later than 15 days from the filing of the motion for a stay unless extended at the request of the employer. The decision on the motion for the stay must occur not later than 15 days following the hearing. There also is provision for objecting to a decision of the Administrative Law Judge on an employer’s motion for a stay by any party aggrieved by such a decision. The amendment does not address, however, whether the abatement dates are stayed until an employer’s motion for a stay has been adjudicated. At minimum, the motion for the stay could take 30 days from the time it is filed until a decision is issued, yet there is no indication what action, if any, the employer will have to take while its motion for a stay is pending on abatement dates that provide fewer than 30 days from the date the employer receives the citation to correct an alleged violation.

Additional language in the statute amends Section 17(d) of the Occupational Safety and Health Act of 1970. This amendment extends failure-to-abate violation penalties to apply to any citation in which the corrective action indicated has not been abated by the date stated in the citation unless a stay has been issued. Again, this creates an awkward situation for cases in which the compliance officer or area director issues a citation with an abatement period within 30 days of the date the employer receives the citation and the Administrative Law Judge hearing a motion for a stay takes the full 30 days to issue the stay. Failure-to-abate citations under this bill can be fined at up to $12,000 a day.

Civil Penalties

In addition to increasing civil penalties by approximately 72 percent on the high end, amendments to the penalty structure designate new categories for criminal penalties and criminal sentencing. Under the existing Occupational Safety and Health Act of 1970, an employer convicted of a willful OSHA violation that resulted in a fatality can, in addition to civil penalties, be imprisoned for up to 6 months. Under the proposed amendment to the Act, in a similar situation, an employer who “knowingly violates any standard, rule, or order promulgated under Section 6 of the Act or of any regulation prescribed under the Act (willful violation), and that violation caused or contributed to the death of any employee, shall, upon conviction, be punished by a fine in accordance with Title XVIII of the United States Code and/or by imprisonment for not more than 10 years.” The same amendment to the Occupational Safety and Health Act of 1970 provides that for a repeated offense the potential period of prison time is up to 20 years. Both amendments include the possibility of a substantial fine in addition to the prison time.

While potential prison sentences are spelled out for other possible actions by an employer, the amendment also creates a new criminal sanction for a willful violation that results in serious bodily harm to but does not cause the death of an employee. This penalty is a fine in accordance with Title XVIII of the United States Code or by imprisonment for up to 5 years or both. Serious bodily harm is defined as “bodily injury or illness that involves (A) a substantial risk of death; (B) protracted unconsciousness; (C) protracted and obvious physical disfigurement; or (D) protracted loss or impairment either temporary or permanent of the function of a bodily member, organ, or mental faculty.” Under this definition, a large number of workers’ compensation claimants would qualify as having suffered serious bodily harm, which could result in criminal prosecution if their employers were alleged to have committed a willful violation of the Occupational Safety and Health Act that resulted in that harm.

Timing of Amendments

The effective date of the amendments to the Occupational Safety and Health Act of 1970 is stated to be 90 days from enactment of the amendment. State plan states would have to enact the provisions of the amendment within 12 months of the enactment of the amendment by the federal government.

Field Operations Manual Amendments

Amendments to the Field Operations Manual are now in place. While waiting to see how the proposed legislation in H.R. 5663 is resolved, OSHA Administrator Dr. David Michaels has issued amendments to the Field Operations Manual announced on April 22, 2010, in a memorandum to regional administrators. Dr. Michaels indicated that these changes will become effective over the next several months. It is hard to gauge which of the changes are in effect now and which may only be in effect at some future point, but some of the procedural changes are currently being implemented.

One of the more significant changes is a prohibition concerning informal conference considerations. Dr. Michaels has restricted area directors’ ability to offer settlements of pending OSHA citations at an informal conference to a 30-percent penalty reduction. Area directors must now have approval of the regional administrator to offer a reduction greater than 30 percent. Area directors are authorized to offer an additional 20-percent reduction to employers with fewer than 250 employees who agree to retain the services of an outside safety and health consultant—the cost of which may be significantly higher than a 20-percent penalty reduction, however.

Dr. Michaels has made several other significant changes to the existing penalty structure in his memorandum and through changes to the Field Operations Manual. His announced intention is to increase the average penalty for a serious violation from the current reported amount of less than $1,000 to a goal amount between $3,000 and $4,000.

Amendments to the Field Operations Manual do not have to proceed under the Federal Administrative Procedures Act, nor do they have to work their way through Congress. They are in place the day the Administrator of OSHA announces them as such.

Severe Violator Enforcement Program

On June 18, 2010, OSHA unveiled its Severe Violator Enforcement Program (SVEP). The program was announced through OSHA Instruction CPL 02-00-149 and is designed to apply to employers who have demonstrated indifference to their OSHA obligations by committing willful, repeat, or failure-to-abate violations. If an employer is classified as a severe violator, OSHA instruction requires mandatory follow-up inspections following the issuance of citations, increased corporate awareness of OSHA enforcement, and corporate-wide agreements and federal court enforcement under Section 11(b) of the Occupational Safety and Health Act. Criteria limit the application of the instruction as it applies to willful, repeat, and failure-to-abate violators.

Conclusion

Readers can judge for themselves how this legislation will impact their businesses. While the amendments to the Field Operations Manual and the Severe Violator Enforcement Program are already partially or totally in effect, at the time this article was written there was still an opportunity to modify the pending legislation.

All members of the NIA are committed to providing a safe workplace for their employees. Because regulatory enforcement does not always equate with practical safety, however, employers who are providing their employees a safe place to work may find themselves spending thousands of dollars to fix things that are not really broken.

Many NIA members have taken NIA’s Insulation Energy Appraisal Program (IEAP) training course and become Certified Insulation Energy Appraisers in the past few years. This class is filled with fantastic information, equipping insulation professionals with all the information they need to show customers how to save significant energy costs by insulating un-insulated or under-insulated piping.

With all the emphasis placed on energy efficiency by the stimulus and government initiatives, some amazing opportunities have opened up for contractors to put the IEAP to use. For instance, L & C Insulation of LaCrosse, Wisconsin, has teamed up with Focus on Energy of Wisconsin to help customers obtain funding for energy savings identified through energy appraisals.

L & C Insulation has supplied hospitals and manufacturing plants with energy appraisals on their steam, steam condensate, and heating hot water systems. This includes identifying un-insulated valves, valve bonnets, traps, strainers, pumps, and other equipment in a thorough plant survey. Once all these items are identified, the company develops the energy appraisal report for the customer, as well as a quote to supply insulation for the items identified through the appraisal.

L & C Insulation has also worked with Focus on Energy of Wisconsin to identify information (in this case, therms saved) necessary to secure government funds used to give the customer energy credits toward their fuel cost. Focus on Energy of Wisconsin will fund between 0 and 30 percent of the project cost.

Finally, the appraisal data is put into the Simple Payback, Rate of Return, and Emissions Calculator in the Mechanical Insulation Design Guide to run the numbers out to 20 years and show the customer how much their investment will save their facility, just as if it were an investment in a piece of equipment. This is the deal maker. (Coming soon is the Financial Calculator, which will provide simple payback, internal rate of return, net present value, and annual and cumulative cash flow for an overall project or a small investment such as insulating a valve.)

Previously, the customer representative would usually take the information from the energy appraisal and submit it to the “higher ups,” and the process ended. They are always bombarded with projects that will “pay for themselves.”

The difference now is that the customer is getting free money to help pay for the project and also can see how their investment grows over the years. Once they find this out, the project has a new life.

For L & C Insulation, this has turned into a new type of work. There are many organizations like Focus on Energy throughout the country; every state has some type of energy savings program available to customers. Contractors should research these opportunities and work with these organizations, which will enable them to also develop another line of work. This is an untapped market available only to companies with energy appraisers on staff.

To become a Certified Insulation Energy Appraiser, visit www.insulation.org/training/ieap or contact training@insulation.org. To locate a Certified Insulation Energy Appraiser in your area, visit www.insulation.org and click on “Find a Certified Insulation Energy Appraiser” on the left-hand menu.

The U.S. Department of Energy’s Industrial Technologies Program’s (ITP’s) Save Energy Now program is a national initiative to drive a 25 percent reduction in industrial energy intensity over 10 years, which will enhance U.S. industrial manufacturing competitiveness. Since its inception in 2006, Save Energy Now has completed more than 2,400 plant energy assessments to identify energy efficiency measures and realize cost savings. Over 2,200 plants have participated in ITP-sponsored Energy Savings Assessments (ESAs), which have identified more than $1.3 billion in potential cost savings per year. In addition to assessments, Save Energy Now provides software tools, information, training, technical assistance, and other resources that are helping plants identify opportunities for energy savings and develop a “green” workforce with expertise in energy management.

Saint-Gobain, a global supplier of building materials, has paved its expansion and progress by developing solutions that prioritize energy performance and environmental protection. Keeping these criteria in focus, six of Saint-Gobain’s U.S. plants have participated in ESA offered by the ITP and are reaping significant benefits in energy savings, as well as emissions reductions.

Saint-Gobain has also joined with ITP’s Save Energy Now initiative to assist other companies with their ESAs so they are productive. The company has developed a generic approach to guide companies on preparing their plants for ESAs in a manner that can maximize their value and ensure implementation of recommendations.

Saint-Gobain and Save Energy Now

Established in 1665, Saint-Gobain is a world leader in the manufacture of construction materials and glass products. Headquartered in Paris with operations in 64 countries, the company is made up of about 190,000 employees and boasts 84 different nationalities. In 2009, the company reported international sales of $53 billion, with 46 percent of those sales generated from renovation, 31 percent from new construction, and the remaining 23 percent from other markets, including automotive and residential.1,2

Saint-Gobain has acquired world leadership in the habitation market by offering innovative solutions that meet the fundamental global challenges of growth, energy, and the environment. Saint-Gobain demonstrates this corporate philosophy of energy efficiency throughout the company—from the construction of energy-efficient buildings to making the plants that produce materials for those buildings consume energy more effectively, while reducing related carbon dioxide emissions. The company even implemented a program to train contractors on energy-efficient construction and how they can apply those techniques when building new facilities.

With energy efficiency as a priority in its operations, Saint-Gobain received ESAs at six of its U.S. plants from May 2006 to September 2009. Many of those facilities were formally recognized as Energy Saver and Energy Champion plants by ITP for making significant progress in implementing the identified energy-savings opportunities. Energy Champion award winners are plants that have achieved 15 percent total energy savings, and Energy Saver award winners are plants that have achieved 7.5 percent total energy savings.

Additionally, Saint-Gobain was named the U.S. Environmental Protection Agency’s ENERGY STAR Partner of the Year in both 2009 and 2010. The company received the honor in 2010 because it reduced its North American energy consumption 2.2 percent and lowered its carbon dioxide emissions by more than 70,000 metric tons.3

Assisting Other Companies with ESAs

In keeping with the LEADER Pledge, Saint-Gobain has stepped forward to assist other U.S. facilities with their ESAs by developing an approach that can be broadly applied to other companies regardless of industry type. This approach assists companies in preparing for and participating in energy assessments and was designed to ensure that the recommendations identified during the assessments are implemented.

The approach was unveiled during the January 2010 Save Energy Now LEADER Webinar delivered by Saint-Gobain’s Energy Manager Brad Runda. During the webcast, Runda discussed key tips that will help other companies achieve the same success Saint-Gobain has seen with energy efficiency project implementation. The DOE strategy lays out five main steps that will help companies realize efficient assessments and implementation: Plan, Prepare, Corporate Buy-In, Capital Budgets, and Staff. Saint-Gobain’s suggestions cover the Prepare part of the overall strategy.

Preparing for ESAs

Saint-Gobain’s strategy emphasizes the Prepare phase as key to a successful ESA and a successful implementation process afterward. This phase categorizes the items that should take place prior to an assessment as:

  • Safety
  • Internal approval
  • Confidentiality agreement
  • Physical space and personnel assistance
  • Fuel consumption
  • Metering
  • Equipment and processes.

Safety. Safety should be a primary focus for any industrial plant. Therefore, it is no surprise that it should be a factor in preparing for an assessment. It is recommended that special thought be given to visitors who will be coming to the plant, because they may be required to travel through areas that not everyone in the plant is familiar with or specifically trained to be in. Additional safety equipment should be planned out, and special training sessions for unique sites must be considered. Safety should be the first topic of discussion when anyone new will be arriving at a facility.

Internal approval. It is important to obtain the necessary support before conducting an assessment. This will be essential when it comes to allocating the necessary resources to accommodate the visiting team performing the assessment. Additionally, senior-level staff will play a key role when setting priorities after the assessment is complete and when corporate buy-in is needed. It is valuable to note that individual expectation levels can greatly influence the ultimate outcome of the assessment: project implementation. Therefore, recommendations from the assessments should comply with internal guidelines for project returns.

Confidentiality agreement. While Save Energy Now has a confidentiality agreement, it is important to highlight confidentiality with anyone accessing the plant as a reminder. Energy auditors may come into contact with sensitive equipment, processes, or trade secrets. Remember to provide up-front notice regarding pictures or video requirements that may be used during the assessment.

Physical space and personnel assistance. Assessments can last anywhere from 1 to 3 days or longer, depending on the plant size and availability. It is important to have a secure location for people to perform their work, discuss topics, and retreat to when not on the plant floor. This location (or locations) should include a computer, phone, network access, and table space. Also, because auditors are foreign to the facility, it is suggested that plant personnel be assigned to assist them. These people should be knowledgeable about the plant, specifically the area where the assessment is taking place. They should also be accessible throughout the site visit. Personnel who are knowledgeable about the process can speed things up significantly.

Fuel consumption. Understanding how the company pays for energy is important to the overall outcome of an assessment. Without this knowledge, it is impossible to focus an assessment on the biggest energy opportunities in the facility. If site personnel are not knowledgeable about how the plant’s energy is purchased, contact a utility representative. These representatives will often come out to the facility, go over previous energy bills, and explain to management how the plant uses energy. It is highly recommended that facilities communicate with their utility representative prior to an assessment, as it can help provide ideas for the assessment to focus on. According to Runda, “There’s a big difference between high demand charge and high energy charge.”4 Knowing which type of charge a plant incurs more often will greatly impact future savings potential.

Metering. Past energy bills will provide information on how much and what type of energy is consumed by the plant, but a plant load profile will provide details on how that energy is used throughout the plant. Assessments break down how a plant works into smaller segments, which makes energy savings easier to isolate. Each of these segments contains a sub-meter location. The sub-meter location is simply where measurements or readings are taken. Many newer facilities already have sub-metering locations in place, but older plants often do not.

It is important to prepare new or existing locations for the assessment team. It is suggested that plant personnel perform a walk-through of existing sub-meter locations to make sure they are functional, clear of debris, and still accessible. Communicate with the assessor prior to adding new sub-metering sites within the plant to make sure the addition is relevant to the assessment. Collecting reliable data during the assessment will be a huge factor in its success.

Equipment and processes. Assessments often focus on equipment. When purchased, this equipment frequently comes with original equipment manufacturer (OEM) documentation, such as performance tests, technical information, and operation guidelines. This information is critical because it provides the baseline performance characteristics for that piece of equipment. Comparing how a pump currently operates to how a pump should perform is the best way to calculate possible energy savings.

It is not always feasible to analyze each piece of equipment. In these cases, it is better to review the process the plant uses. In this occurrence, it is necessary to have process diagrams that the assessment team can refer to when performing the assessment. It is recommended that personnel have both sets of information available during the assessment.

Benefits of Being Prepared

Saint-Gobain’s suggestions, based on its successful experiences with ESAs, can help plants of any type prepare effectively for ESAs. Focusing on the Prepare phase will help relieve some of the anxiety that plant managers and energy managers deal with when it is time for an assessment, and paying close attention to all items under this phase can help plants ensure a successful and productive ESA. A successful assessment will not only be a huge advantage to the facility, but will also allow the company to replicate the success across its other facilities and bring in more energy savings.

While Saint-Gobain is assisting other companies to achieve success in their energy reduction goals, the company is set for major energy savings of its own. Through the Save Energy Now initiative, Saint-Gobain is now equipped with the skills and management experience to administer its energy-intensity-reduction goals at its other facilities throughout the world.

Save Energy Now is a national initiative that aims to drive a reduction of 25% or more in industrial energy intensity in 10 years. To achieve this ambitious goal, ITP is partnering with Save Energy Now LEADER Companies and Save Energy Now ALLY Organizations. For more information, please visit http://www1.eere.energy.gov/industry/saveenergynow.

Notes

1. Saint-Gobain. “Saint-Gobain at a Glance.” www.saint-gobain.com/en/press/saint-gobain-glance. Accessed April 29, 2010.

2. Saint-Gobain. “Saint-Gobain Our Employees.” www.saint-gobain.com/en/group/our-employees. Accessed May 17, 2010.

3. ENERGYSTAR. “Saint-Gobain: ENERGY STAR Partner of the Year.” www.energystar.gov/index.cfm?fuseaction=pt_awards. showAwardDetails&esa_id=3656. Accessed April 29, 2010.

4. Phone conversation with Brad Runda on April 23, 2010.