Category Archives: Global

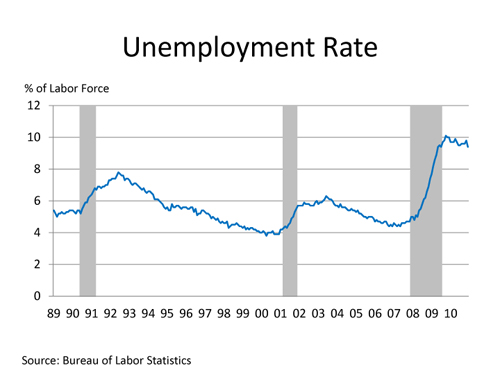
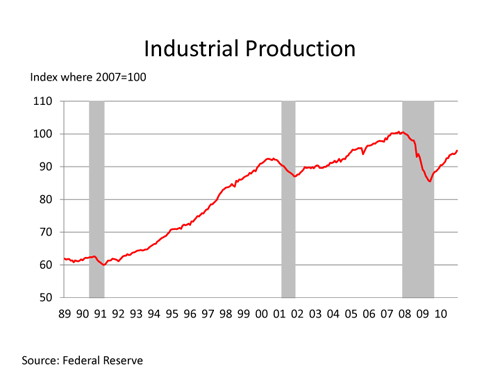
The mechanical insulation industry certainly felt the impact of the sluggish, recessionary economy in 2010, which did not produce any significant rebound from 2009. National unemployment hovered around 10 percent, while the rate for the construction industry, including the mechanical insulation industry, ranged between 20 and 25 percent. Confidence in the economy recovering in the short term was weak. The low confidence level and fear of what the future holds resulted in companies sitting on large cash reserves. Securing financing remained difficult, which resulted in a low level of new construction starts and retrofits, and a decrease in maintenance activities. The gridlock on Capitol Hill did not help and may even have hindered our nation’s recovery efforts.

It is not possible to discuss the State of the Industry without including the economy and politics. However, there are so many moving parts to the equations, and “expert” opinions, that it is wiser to focus on what we can influence. Our industry should continue actively participating in influencing positive changes in Washington, D.C., as well as state capitals and local jurisdictions. Change sometimes is slow and challenging, but without it tomorrow could look like yesterday. Most industry participants want to see 2009 and 2010 through the rear view mirror, not the front windshield.

When thinking about the economy and its complex components, it is easy to be pessimistic. However, I prefer the optimistic view that the momentum is growing to deliver a slow, steady recovery for the general economy and the mechanical insulation industry.

Finding the Exit

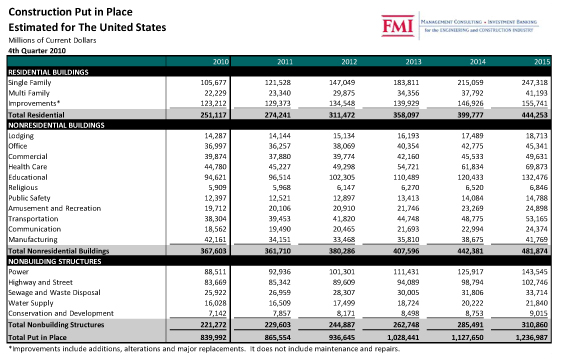
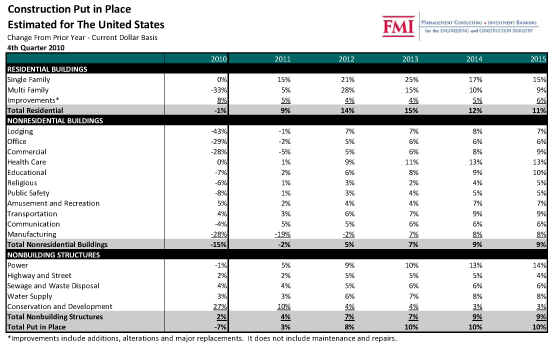
The economy is showing signs of recovery. Many forecast commercial and industrial construction activities to increase by moderate double digits in 2011. While that is great news, remember that those projections are based on current levels obtained after 3 years of decline.

Where does the mechanical insulation industry fit in the recovery cycle? The industry is historically one of the last sectors to feel the impact of a downturn and, unfortunately, one of the last to reap the benefits of a recovery. With a slow recovery, the industry may only notice substantial benefits from a longer-term perspective versus year-over-year comparisons. That said, some areas—and certainly individual companies—may enjoy bursts of recovery driven by project securement, mix of business among market segments, specific stimulus activities, and an array of other unique or localized events.

The mechanical insulation industry is not without its challenges. But it is also uniquely positioned, and the future is filled with opportunities. We need to go after them, not wait for them to come to us.

With national and international efforts focused on increased energy efficiency and improving the environment, the mechanical insulation industry should continue to educate all direct and indirect channel participants and promote the benefits of mechanical insulation. Providing local and industry-specific practical data and case studies that outline potential energy savings and emission reduction opportunities provided by mechanical insulation installations is vital to that education effort.

Mechanical insulation has the potential to greatly reduce energy intensity and emissions. However, the lack of data to support the case for increased use and maintenance of mechanical insulation has penalized the industry. Policy makers in the industrial and commercial sectors need hard data to make their case. The industry must gather this data and make it available.

In addition, the industry should participate in the development of new processes, such as building information modeling, to ensure our role in future projects. That will require change, and the challenge of change can be difficult.

The following are a few of the developing areas the mechanical insulation industry should pursue.

Energy Codes: A Path Forward

In the past several years, energy codes have moved from the fringes of energy efficiency policy to center stage. Policy makers, energy agencies, and environmental groups have realized that energy codes are one of the simplest, most effective tools to reduce building energy use. That realization has resulted in a push for faster adoption of code increases through both state-level legislation and formal policy initiatives of the U.S. Department of Energy and other major organizations. However, there is apprehension that unrealistic expectations—”stretch goals”—are being set without addressing some basic changes in code implementation and transition, not to mention measurement and enforcement processes.

There are numerous efforts in the United States and internationally to develop comprehensive, performance-based energy metrics. According to a draft of a National Institute of Building Sciences Consultative Council (NIBS-CC) report, “If we are to achieve net-zero-energy performing buildings, it will be important to arrive at a greater understanding of the cost/benefit variables that will allow the building community to make informed decisions regarding which technologies to prioritize, develop, and implement. The transition away from prescriptive-based specifications towards performance-based metrics should also include goals for the incorporation of systems that allow for real-time user monitoring of building energy and water use that will work to ensure ongoing performance. Such systems will provide a built-in feedback system for continuously improving actual performance and informing the underlying metrics.”1

Where does that leave the mechanical insulation industry? The industry has long touted the energy benefits of mechanical insulation on a prescriptive basis. Prescriptive codes or strategies generally describe specific components or features required in a building. Most codes focus primarily on prescriptive compliance strategies, considered the simplest and easiest to implement and enforce. However, history has proven that individual prescriptive codes may not be indicative of holistic building performance.

For new construction, performance-based compliance typically means that energy modeling software is used to show that a building’s predicted energy consumption or cost is equal to or lower than a specified baseline or target. The baseline targets are generally a combination of prescriptive requirements that may or may not be covered under existing or proposed codes.

For existing buildings, performance normally implies comparison to historical holistic building energy usage. That sounds simple, but many facility owners are not willing to share historical energy usage/cost data, which—without mandated compliance—may make performance codes difficult to enforce.

The focus on reducing energy consumption in new and existing buildings and manufacturing facilities is increasing in virtually all circles. The opportunities for mechanical insulation in this arena are clear. The question is how the industry will respond to ensure mechanical insulation is at the core of the code development and implementation process.

The industry should take an active role in establishing the value of mechanical insulation with both individual prescriptive and holistic performance codes, including building simulation and modeling. This is clearly an area where adopting a “wait-and-see” approach, or assuming someone else is addressing these areas, will be a mistake. All facets of the industry—manufacturers, contractors, and distributors—need to contribute in a unified effort. This opportunity may be comparable to the U.S. Green Building Council’s Leadership in Energy and Environmental Design (LEED) program. The industry did not have a seat at the table with the initial development, and now we are playing catch up. Let’s not make that mistake again.

Insulation and the Energy and Water Nexus

In addition to saving energy, mechanical insulation can also play a role in saving water. The term “water-energy nexus” is increasingly used to indicate the relationship between water and energy due to how society uses water. Water efficiency in many respects is more important than energy efficiency. Put energy and water together, and you have a topic that is vital to our nation’s economy and security. According to the NIBS-CC:

“Energy is consumed in the conveyance of water from the source to the point of treatment, the treatment process itself, the distribution of water to the point of use, the heating of water during use, and the wastewater treatment process. Water heating alone accounts for an average of 13 percent of the total energy consumed in U.S. residential buildings. These values indicate the huge potential of achieving significant energy efficiencies through improved water efficiency measures.

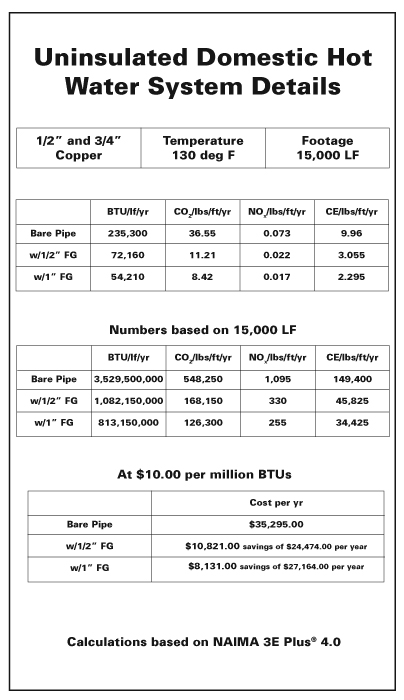
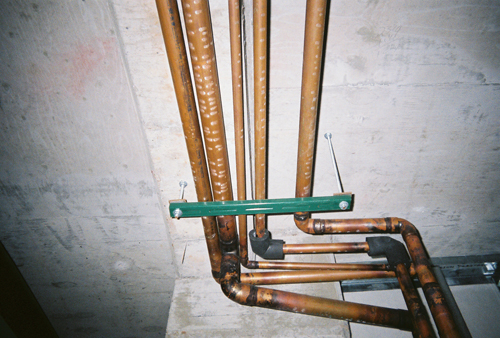
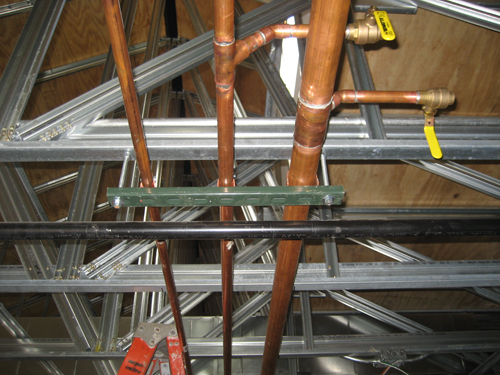
“Plumbing distribution systems within buildings need to be designed with a greater focus on water and energy efficiency in residential, commercial, and industrial sectors. The distance between the sources of hot water, generally the water heater and the various points of use within a building, should be minimized in the design phase. Where this is not possible, the use of on-demand or timer-controlled hot water circulation systems and increased use of pipe insulation materials on hot water lines will greatly improve both water and energy efficiency levels within the building.

“The need to improve indoor and outdoor use of water in buildings is profound. The U.S. Environmental Protection Agency reports that 36 states expect to experience local, regional, or statewide water shortages by 2013….”2

Water is, and will continue to be, a precious resource. This is clearly an opportunity for the mechanical insulation industry. While it is generally accepted that increased use of insulation on hot water piping reduces energy costs, how much water could be saved is not normally considered. Our industry needs to understand the relationship and develop data on the energy and water nexus from the mechanical insulation perspective.

Making Mechanical Insulation
a “Core Competency”

Buildings and facilities are the result of a complex system of ideas, experiences, technologies, and practices brought together by different disciplines, users, and needs. To achieve high-performance buildings or facility objectives, we must understand the cost/benefit variables that the building community uses to make decisions about which technologies to prioritize, develop, and implement.

Education and training in the building professions should be aimed at facilitating the entire life cycle of buildings, including concept, design, construction, commissioning, occupancy, modification/renovation, and deconstruction. In each phase of the building’s life cycle, particular segments of the building community must have the requisite knowledge to address needs specific to that phase. Historically, the primary education has been in universities, colleges, and trade schools (although in the case of mechanical insulation, those efforts have been minimal).

Mechanical insulation is a proven technology key to achieving high-performance objectives. It should be nationally recognized as a “core competency” in the design and management phases. For years, a deficient understanding of what mechanical insulation is and how it could be utilized has impeded policy makers, design professionals, facility management, and other participants in industrial and commercial sectors in making a supportable case for increased use and maintenance of mechanical insulation. To those in the industry it is a “no-brainer,” and the frustration level with others’ lack of understanding or appreciation continues to increase.

The only way to change that is by educating all individuals and groups that have an impact on the performance of the building or facility during its life cycle, including:

  • owners
  • commissioning agents/code authorities
  • general and mechanical contractors
  • engineers and architects
  • installation and service contractors
  • facilities management
  • users/occupants.

While initial education in a particular career or trade is essential, education must be continual. Best practices go stale; equipment systems and processes change; and new regulatory requirements are enacted.

Without doubt, an increased focus on mechanical insulation in higher learning institutions and the facility management field will provide long-term benefit to the industry. In addition, certification or similar programs on core competencies required in building operation will be the wave of the future for building/facility management. How can one expect facility owners, whether in the public or private sectors, to achieve high performance levels if those managing and operating the facilities do not have a good understanding of their building’s core competencies and their interrelationship?

The industry must step up and support educational efforts, such as the Mechanical Insulation Education and Awareness Campaign (see “Mechanical Insulation in the Spotlight”) and efforts to include mechanical insulation as a core competency under the Federal Buildings Personnel Training Act of 2010.

The Road Ahead

The world in which the industry competes is much different today than it was 10 years ago—or even 1 or 2 years ago. This article has discussed just a few of those changes. Many more could be added to the list of future trends or changes, including insulation contractor state or local licensing requirements; the need for federal and state or local incentive programs to support energy, environment, and education initiatives; and continual technology improvements.

All of these create opportunities. The mechanical insulation industry must accept and embrace whatever the economy provides, but we can also positively influence the industry’s role in the future economy.

Implementing and maintaining an aggressive, meaningful, and sustainable education and promotional campaign in today’s economy is not easy, given bottom-line and resource demands. But if the industry wants to influence positive change and long-term sustainable growth, it cannot afford to sit on the sidelines. We can easily predict the outcome if we simply take whatever the economy allows us to have.

The industry’s time to influence the increased use of mechanical insulation is now. Your participation has never been more critical. Watch for calls to action and check
Insulation.org for ways you can make
a difference.

Notes

1. National Institute of Building Sciences–Consultative Council Topical Committee pre-publication draft report.

2. Ibid.

When someone needs a master of a specific trade, such as mechanical insulation, an expert is called. This expert is expected to know everything there is to know about the craft and be technically competent in installation and maintenance. But for a contractor today, being the expert is not enough.

Contractors now need to be not only the expert at their specific craft, but also top-notch business development professionals building strong relationships upfront, assisting potential clients with design and specifications. Contractors need to be business savvy and understand how to manage the financials of their organizations, analyze market segments and trends, and conduct strategic planning. A deep understanding of information technology is needed to most competitively utilize applications such as project management software and 3-D modeling. An understanding of contract law is necessary to review increasingly complicated contracts and protect the organization. There is also LEED, Minority Business Enterprise (MBE), surety, Public-Private Partnership (PPP), human resources, and a myriad of other things to be competent in. Being the master of a specific trade is not enough any longer.

This trend is expected to continue in the future. FMI publishes the U.S. Markets Construction Overview annually and reports on trends and forecasts for the short and long term. For 2011, the publication outlined 12 topics that will have an impact on the future of the construction industry and how it operates:

  • business development
  • productivity
  • state of capital and credit markets
  • embracing change
  • succession planning
  • adoption of BIM
  • sustainability and green building
  • ethics
  • attracting people to the industry
  • new energy trends
  • improvement and renovation market
  • globalization trends.

Although these topics may not have an effect on every contractor, they are certainly going to create a different contracting environment. Combine this with the economic forecasts for construction, and a new skill set will be needed to manage a successful contracting company in the future.

Two of the hottest topics for the future of contracting are business development and productivity. When economic times were robust, contractors could pick and choose whom they worked for. A daily glance at the fax machine or a morning review of voicemail and e-mail might be enough to bring in more business than the company could handle. With a lack of competition, margins began to rise to a point that projects had enough “fluff” built in to cover any inefficiencies in the operations. Those days are no longer, and with the market not forecasted to return to 2007 levels until at least 2014, it will be a long time before the market dynamics of 2007 are seen again.

Strategic Business Development

The trend for a greater emphasis on business development has been driven by increased competition, commoditization around price, and a decreasing backlog. Relationships that were built over a number of years have been tested. Clients that traditionally negotiated work are now taking advantage of the climate and putting work out to bid. The overall trend is that contractors do not have enough work, and there is an ever-increasing need for a business development strategy.

For contractors of the future, business development strategies will need to be robust, with the appropriate level of resources involved. Every person in the organization will take a role. The need to train the field supervision and project management staff on how to maintain relationships and seek out opportunities with current clients will increase. Business development strategies will need to include fact-based market research rather than assumptions, rumors, and “gut” feelings. A thorough understanding of the market dynamics, customer buying preferences, customers’ level of satisfaction, competitive landscape, forecasts, funding, and drivers of local economies will become part of the business development strategy.

The use of social networking in business development efforts will be another trend for contractors in the future. Every organization will need to evaluate what role applications such as Twitter, LinkedIn, and Facebook will play in its business development strategy.

Finally, the future contractor will need to measure and evaluate business development efforts. With limited resources available, contractors need to ensure that efforts to capture business are maximized and the return on the investment is positive. These business development metrics will be closely tied to estimating, and measurements such as proposals, new customers, level of interaction, and hit rates in association with current clients and past clients will be evaluated.

Contracting going forward will be different than in the past. To be an effective and profitable part of this future, contractors must re-evaluate their business development strategy and rethink the way they go to market.

Working Lean

Productivity was the second hottest trend for the future of contracting mentioned in FMI’s 2011 U.S. Markets Construction Overview. The emphasis for contractors going forward will be producing flawless work and utilizing lean principles. With the competitive nature of the bidding environment and the clients’ expectations, there is no room for “fluff” in a bid to cover inefficiencies. Contractors must look at all their internal processes from pre-project planning to estimating feedback to ensure they are operating as efficiently as possible.

This is not an easy task with project team members now wearing multiple hats due to staff reduction. Superintendents are taking on more projects, bigger field staffs, and riskier subcontractors. Project managers are being used in business development and estimating. These added duties have created an environment of firefighting, where efforts are expended on the biggest problem at the moment.

Project teams will need to be more proactive. With margins squeezed to the extreme, the planning and operational efficiencies that “we were too busy” to address in the past will be a necessity. Projects with little margin have no room for margin erosion, and the project team needs to plan better than ever before, create strategic ways to build projects, and overanalyze every cost. Project teams should focus on margin-enhancing opportunities rather than efforts to stop the bleeding.

One trend that has emerged and will become a bigger focus for contractors in the future is “lean.” The philosophy of lean is to eliminate all forms of waste: excess material, labor overruns, inappropriate equipment utilization, and internal processes such as managing change orders. In an effort to operate as efficiently as possible, contractors are increasingly turning to lean concepts to eliminate the waste in their organization. Although there are many ways to achieve the goals of lean, the three main principles are:

  • Eliminate wasted time, material, equipment utilization, and effort.
  • Reduce costs while improving quality and customer satisfaction.
  • Create a continuous improvement culture from the top down.

Slower economic times demand flawless execution on construction projects. Project risk will continue to increase, and contractors will continue to operate with fewer overhead personnel. The requirement for contractors in the future will be to identify all opportunities for improvement from the office to the field and execute flawlessly.

Just the Beginning

While business development and productivity topped the list of topics affecting the construction industry’s future, the remaining 10 items are just as important and will shape the landscape in which contractors operate. The world many contractors were brought up in does not exist any longer, and those who want to be successful must change and adapt. For contractors of the future, being experts in the trade is not good enough.

FMI believes we are now bouncing along the bottom of the recession for the construction market and that the climb back out will be slow. The end result will not look like it once did.

Market Trends

When thinking long-term about an organization, one important aspect to consider is market trends. Contractors will need to be more versed in and have a deeper understanding of the market trends in their specific areas.

As part of the 2011 U.S. Markets Construction Overview, FMI analyzed macro-economic trends for the construction industry. The current lag is believed to be caused by the expenditure of the stimulus package and the lack of private sector money to replace it. FMI’s Construction Put In Place Forecast breaks down forecasted spending in several sectors and presents the year-over-year change.

While 2011 will be down overall for nonresidential construction, pockets of activity will be positive. Nonbuilding structures will start the slow climb next year, along with the residential market. In addition, local demographics will have some areas countering the national trend.

Of note for mechanical insulation companies is the growth expected in power and the decline expected in manufacturing. The growth in power is driven by environmental regulation and transmission and distribution projects. There is a lot of talk about an increase in nuclear activity; however, it is not expected to fuel growth in the power segment until after 2015. The manufacturing segment has slowed after 6 years of strong growth. Growth in the future, however, will not be from textiles and automotive, but from refinery projects, battery manufacturing, and electronic manufacturing.

Several other pockets of optimism can be found, but an in-depth look at trends in a contractor’s area, along with the drivers of those trends, should be analyzed for planning purposes.

A New World

The economy and the trends in the contracting industry are changing the way business is done. Contractors must be much more than experts in their fields, and this often requires outside assistance. This environment of change and adaptability, along with the need for outside help, is testing the limits of some organizations.

To be successful in the future, contractors will need to reinvent themselves and adjust to the new trends and expectations. For a contractor of the future, being an expert at the craft is not enough.

Figure 1

Construction Put in Place, Estimated for the U.S.

Figure 2

Construction Put in Place, Estimated for the U.S.

Figure 3

Construction Put in Place, Estimated for the U.S.

In 2010, the economy continued to dig itself out of the largest hole since the Great Depression. Despite growth of 2.8 percent, GDP remains below pre-recession levels, as do many key economic indicators. Going into the end of 2010, however, there was a notable shift in momentum toward greater confidence and increased spending by households and businesses. Consumer sentiment has improved significantly since mid-2010, with a better-than-expected holiday spending season. While consumers remain cautious, spending has returned to levels not seen in 3 years. Indeed, consumer spending is expected to grow by 3.0 percent in 2011 as some pent-up demand is released. This follows 2 consecutive years of contraction, again something not seen since the 1930s. This is good news, as the consumer sector accounts for 70 percent of the U.S. economy.

However, households continue to struggle with a weak housing market, high unemployment, high debt loads, and the destruction of household wealth. Since its peak in the second quarter of 2007, household wealth was still off $10.9 trillion at the end of the third quarter 2010. At its lowest, household wealth was down by $16.8 trillion, so only a third of the lost wealth has been regained. Since mid-2008, households have been steadily working to reduce debt loads. This lengthy course correction is typical in recessions sparked by financial crises. At the end of 2010, however, the debt-to-income ratio was at its lowest level in more than a decade as household balance sheets are slowly realigned.

With confidence improving and growth in U.S. exports abroad, there has been a significant and sustainable improvement in underlying final demand in the manufacturing, wholesale, and retail sectors. Due to the depth of the downturn, however, there remains a good bit of slack in the economy, both in productive capacity (with several exceptions in some materials industries) and the labor market. During the recession, 8.4 million jobs were lost. Since the beginning of 2010, the economy has recovered more than 1 million jobs. While this is an improvement, the economy has thus far not grown fast enough to absorb the vast number of unemployed and underemployed, which together now account for nearly 17 percent of the labor force. The unemployment rate rose to 9.6 percent during 2010 from 9.3 percent in 2009 as the number of new and returning entrants to the labor market more than offset net job growth. As the job market improves, the unemployment rate will ease to 9.4 percent in 2011 before falling to 8.4 percent in 2012.

The weak link in the recovery continues to be the housing market, which continues to struggle. Following 4 consecutive years of steep declines, housing starts rose 6.1 percent in 2010 as demand for housing grew in some areas while remaining stagnant in others. Home sales and home prices, however, continued to slide despite the homebuyer tax credit that expired in April. With nearly one in four mortgages underwater, defaults and foreclosures continue to add pressure to an already oversupplied housing market. This has created a huge “shadow” inventory of homes that are vacant or soon-to-be vacant but are not yet listed as inventory available for sale. By some estimates, this shadow inventory may be as high as 5 million. With high unemployment and debt levels, credit remains tight for many borrowers, restricting the pool of potential home buyers. As the number of households grows and the employment situation improves, so will housing. Housing starts are expected to improve in 2011, rising to 700,000 and then over 1 million in 2012 as a combination of job growth, healthier household balance sheets, and the release of pent-up demand generate momentum.

With the exception of several episodes of “flight to safety” after the collapse of Lehman Brothers in 2008 and the Greek meltdown this past spring, the U.S. dollar has been steadily depreciating vis-a-vis other major currencies since 2003. With a weaker dollar, anemic domestic consumer spending, and strong demand abroad (especially from emerging markets), U.S. trade has become more balanced. As the U.S. recovery gains traction in 2011, however, imports are likely to rise, partially reversing the recent trade balance improvement.

With a second $600 billion injection into credit markets, also known as quantitative easing II (QE II), the increased liquidity has further weakened the value of the dollar and renewed fears of an inflationary environment. Because world oil prices are denominated in dollars, dollar depreciation has contributed to higher oil prices. According to the U.S. Energy Information Administration (EIA), oil prices are expected to stay above $85 through 2012. That higher prices for energy and other commodities have not yet translated into broadly higher consumer prices likely reflects the reluctance of businesses to raise prices while consumers are still cautious. Should demand suddenly firm across all sectors, inflation could rise quickly.

During 2010, business investment in equipment and software surged as surviving businesses with plump balance sheets took advantage of deals and the opportunity to retool. This was offset, however, by declining investment in nonresidential structures, resulting in a 5.8 percent gain in overall business investment. Now that the virtuous cycle has reengaged, business investment is set to grow by 11.5 percent in 2011 as both segments grow together before slipping to an 8.5 percent growth rate in 2012.

As the recovery advances and business and household balance sheets improve, the unabated growth in government debt will demand some serious attention. The federal deficit was virtually unchanged at $1.4 trillion in 2010 and is projected to ease in the coming years as tax revenues rise. However, fiscal deficits are projected to remain above $1 trillion for the next several years. Current projections show total U.S. debt ballooning from 62 percent of GDP to nearly 100 percent in the next 5 years. Recently published research suggests that debt levels in excess of 100 percent of GDP tend to impose penalties on an economy’s growth potential.

Industrial Outlook

In the industrial sector, 2010 started out strong as momentum from the inventory rebuild was still playing out. As inventories were replenished, industrial production continued to advance on strong export demand. Industrial production rebounded 5.6 percent in 2010, with nearly all segments posting increases. Looking ahead to 2011 and 2012, industrial production will continue to advance as increasing domestic demand is added to continuing strength in exports.

Petroleum Refining. With the rise in industrial demand, firming consumer spending, and a slowly improving employment picture, gasoline demand has surpassed pre-recession levels. Declining inventories of refinery products will boost refinery production in 2011 and 2012. Looking ahead, projected high oil prices and tightening fuel efficiency standards will restrain gasoline demand growth in the future. Demand for other refinery products may also be impacted as EPA asserts its authority to regulate greenhouse gas emissions. As oil prices remain high, demand for biofuels, in particular corn ethanol, will grow. According to EIA, ethanol production is expected to grow from 860,000 barrels per day in 2010 to 910,000 barrels per day in 2011 and 920,000 barrels per day in 2012.

Gas Processing. Recent developments in shale gas have reversed concerns that the United States was running out of natural gas. With the development and implementation of new technologies, natural gas supplies from tight shale formations, once uneconomic, are now flooding the market, boosting inventories to record levels. The Marcellus formation that lies across parts of West Virginia, Pennsylvania, and New York is by some estimates the world’s largest natural gas reserve. As this industry progresses, demand for gas processing will increase significantly. Some energy analysts have suggested that Pittsburgh may become the next Houston, and the chemical industry has recently announced several expansions and new projects to take advantage of new ethane supplies.

Chemicals. As a supplier to most other industrials in some form or another, the chemical industry was among the first industrial sector to turn around. Chemical output (excluding pharmaceuticals) rose 7.0 percent in 2010 following 2 years of declines. A weak dollar, robust demand from emerging markets, and low natural gas prices created a favorable environment for the industry. According to the American Chemistry Council (ACC), chemical output is expected to advance further, growing by 2.8 percent in 2011 and 2.7 percent in 2012. ACC also projects that capital spending by the chemical industry is set to increase 6.0 percent in 2011 and 8.4 percent in 2012 as the industry makes investments to take advantage of new supplies of ethane from shale gas.

Food Processing. Following 2 years of decline, the output of the food processing sector rebounded 4.0 percent during 2010 as consumers who had cut back during the recession returned to some of their previous spending habits. Grocery sales were higher on increased sales of convenience foods, beverages, and organic/natural products. Also, inflation-adjusted spending at restaurants grew in 2010 for the first time since 2007. The outlook for food processing is for more modest growth during 2011 and 2012. Of concern are rising global food prices, which hit a new high at the end of 2010.

Pulp and Paper. The pulp and paper sector also rebounded in 2010 following steep declines during the recession; however, demand for paper continues to wane as more media outlets shift toward electronic delivery and the low cost and convenience of e-mail and electronic forms continues to chip away at traditional paper uses. Paperboard, largely used for shipping, has improved as the industrial sector has improved. According to the American Forest and Paper Association (AF&PA), the industry continued to trim capacity during the recession as structural shifts in the paper market combined with an exceptionally weak economy caused paper sales to collapse. AF&PA expects that paper capacity will be stable during 2011 and 2012 as demand for paper and paper products returns.

Shipbuilding. Following an upturn during the beginning of the year, shipbuilding remains weak going into 2011. Despite improvements in the fundamentals for shipbuilding, U.S. shipbuilders face increasing competition from Chinese and Indian shipbuilders that are taking an increasing share of the global shipbuilding business. Trade volumes rebounded in 2010 from an unprecedented collapse sparked by the financial crisis. According to the International Monetary Fund, trade volumes are set to expand 7.0 percent this year. Rigs from global offshore energy producers are a source of growing demand. In addition, a trend toward direct ownership of ships by the major producing companies themselves is emerging that could bolster shipbuilding demand in the years ahead.

Summary

Following the worst period in U.S. economic history since the Great Depression, the U.S. economy has returned to a growth trajectory that will put millions of unemployed Americans back to work. Greater confidence by households and business, improved private sector balance sheets, and continued strength from exports are propelling the economy forward. U.S. GDP is expected to grow by 3.2 percent in 2011 and 2.8 percent in 2012 as the recovery gains traction and a positive feedback loop strengthens. Still weakened by the continuing fallout from the housing debacle, a permanent shift in consumer attitudes, and unsustainable federal debt growth, the outlook is for modest but solid growth in the years ahead. There are several risks to the outlook (including terrorism, sovereign default, and currency war), any one of which could destabilize this fragile recovery.

Figure 1

Key Economic Indicators

Figure 2

Consumer Debt as a Percentage of Disposable Personal Income

Figure 3

Unemployment Rate

Figure 4

Industrial Production

The potential of mechanical insulation to reduce energy intensity is immense, yet it remains a largely untapped resource. This is partly due to the lack of sufficient data to support its energy efficiency potential, combined with a deficient understanding of what mechanical insulation is and how it could be utilized. But now a national campaign is underway to help policy makers and decision makers in industrial and commercial sectors make a supportable case for increased use and maintenance of mechanical insulation.

The Mechanical Insulation Education and Awareness Campaign (MIC) is designed to increase awareness of the energy efficiency, emission reduction, economic stimulus, and other benefits of mechanical insulation in the industrial and commercial markets. MIC was created to meet two key objectives:

  • Educate industry on and promote the benefits of mechanical insulation by providing practical data and case studies outlining potential energy savings and other benefits provided by mechanical insulation installation; and
  • Launch an aggressive public education and awareness campaign to combat climate change and improve energy efficiency.

As a part of efforts by the U.S. Department of Energy’s (DOE’s) Industrial Technologies Program (ITP) to improve energy efficiency in U.S. industrial and commercial sectors, Project Performance Corporation (PPC) and the National Insulation Association (NIA), in conjunction with its alliance with the International Association of Heat and Frost Insulators and Allied Workers (International), are working together to design, implement, and execute MIC.

The campaign’s initial phase involves three primary tasks:

  1. Data Development and Research
    • Industrial Segment
    • Commercial Segment
    • Hospitals and Schools
    • Office Buildings (Montana Pilot Program)
  2. Education and Awareness
    • Improve and Develop Mechanical Insulation Design Guide (MIDG) Online Tools
    • Develop a Series of “E-Learning” Modules
    • Develop Core Communication Materials
    • Offer Awareness/Guest Lectures and Presentations
  3. Marketing and Advertising

MIC officially began in June 2010. While still in its initial phase, its accomplishments have exceeded expectations and are forming the foundation for many exciting future initiatives. Following is a brief summary of those accomplishments and ongoing work.

Developing the Data

As a first step, the potential energy savings and other benefits of mechanical insulation must be defined by building sector. MIC is compiling, summarizing, and developing a market opportunity assessment based on existing data as well as gathering additional data. The result will be specific data on energy efficiency/conservation and emission reduction opportunities for mechanical insulation in the commercial and industrial market segments.

Industrial Data
In April 2009, NIA worked with Oak Ridge National Laboratory (ORNL) and the DOE’s ITP to assess possible gains in large and medium industrial facilities. The team relied on data from DOE’s Save Energy Now (SEN) program, which conducts energy audits of industrial facilities, to determine the energy and environmental benefits from mechanical insulation and other initiatives in large and medium plants. Working with the DOE’s ITP, ORNL, and the PPC, NIA examined a database of assessments through May 2010, which included an 83-percent increase in assessments over the original 2009 data. The study confirmed the energy and emission reduction, annual rate of return, and job creation opportunities with increased use and maintenance of mechanical insulation.

The SEN assessments primarily focused on process heating and steam systems, and did not include potential efficiency gains achievable in small industrial plants, the power/utility sector, or the commercial sector (hospitals, schools, government buildings, etc.). Nor did the estimates consider energy efficiency improvements from increased use of mechanical insulation in new industrial or commercial facilities. Using the SEN assessment data, NIA performed a statistical extrapolation from the existing data for the missing segments and estimated the potential maintenance opportunity in small industrial plants and the power/utility sector to derive the total potential for the industrial maintenance market.

The bottom line: Greater use of mechanical insulation in the industrial maintenance market could yield annually $3.7 billion in energy savings, with a 106-percent return (11.3 month payback), 37.9 MMT/yr emission reductions, and 40,000 green jobs.

Commercial Data: Government Facilities

NIA and alliance representatives met with State of Montana representatives to explore how to quantify energy efficiency opportunities in Montana government facilities. The result was the Montana Mechanical Insulation Energy Appraisal Pilot Program, designed to determine the energy, cost, and emission reduction opportunities available through the repair, replacement, and/or maintenance of mechanical insulation systems in Montana’s state facilities.

In September 2010, a mechanical insulation energy appraisal was conducted on a variety of Montana facilities in and around Helena. The assessment addressed mechanical rooms in 25 facilities (56 mechanical rooms) pre-selected by State of Montana personnel based on the potential for energy savings.

The bottom line: Approximately 3,500 items were identified. Estimates indicate energy savings would be approximately 6,000 dekatherms (6 billion Btus) per year. The resulting overall payback period was 4.1 years, with an annualized rate of return of 24 percent. CO2 emission reductions are estimated at 300 metric tonnes per year.

The projected savings represent roughly 8 percent of the total natural gas consumption of the facilities analyzed. On a square foot of gross building area basis, the energy savings averaged 4.6 kBtu/sf/yr, and cost savings averaged $0.043/sf.

While the savings from any single item is small, the aggregated total savings from thousands of small items is significant. Little things matter. The appraisal results confirm the value of addressing missing, damaged, or uninsulated areas. The payback period and internal rate of return are based on actual mechanical room operating conditions: 80°F ambient temperature, service temperature, and hours of operation (in many cases less than 6 months per year).

Commercial Data: Hospitals and Schools

Approximately 5 million commercial buildings (80 billion sf) consume approximately 18 percent of all primary energy used in the United States. Energy usage in commercial buildings varies by size and building activity. Recognizing the wide range in building size and function, the initial study focused on two common building types: hospitals and schools.

NIA insulation contractor members were asked to provide insulation specifications and quantity take-offs for recent hospital and school projects. Using this data, the energy savings due to mechanical insulation were estimated. The projects were selected to represent all seven DOE climate zones.

While the goal was to obtain as much actual energy information as possible, a number of assumptions were required. The DOE Commercial Building Benchmark Models1 served as a guide. These publicly available models provided estimates of the total site energy use intensities for hospitals and schools in all climate zones. The system selection and equipment efficiencies from the DOE Benchmark Models were assumed for the buildings in this study (if actual data was not available).

The study is in the final stages of analysis, with estimates of the energy savings attributable to mechanical insulation in the projects being analyzed relative to a baseline case of no insulation. Results are expected to be published in spring 2011.

The bottom line: Preliminary estimates indicate that, on average, the energy savings generated by the use of mechanical insulation average 20 percent in schools and 78 percent in hospitals.

Providing Online Calculators

The Mechanical Insulation Design Guide (MIDG), developed by NIA and the National Institute of Building Sciences (NIBS), is a comprehensive source of information on the selection, design, and performance of mechanical insulation in buildings and industrial facilities. One component of MIC is to expand and improve functionality of simple calculators housed on MIDG.

The calculators, developed to provide assistance for common calculations used in the design and analysis of mechanical insulation systems, were launched in January 2010. They are free, and users have the option to print the results. The following calculators are accessible through the MIDG website or the DOE ITP Software Tools webpage:

  • Energy Loss, Emission Reduction, Surface Temperature, and Annual Return for Equipment
  • Energy Loss, Emission Reduction, Surface Temperature, and Annual Return for Piping
  • Financial Returns/Considerations
  • Time for Freezing of a Fluid in an Insulated Pipe
  • Temperature Drop for a Fluid in an Insulated Pipe
  • Simple Heat Flow Through an Insulation
  • Controlling Surface Temperature with Insulation

The Energy Loss, Emission Reduction, Surface Temperature, and Annual Return for Equipment and Piping calculators estimate heat flow through a vertical, flat, steel surface (typical sides of equipment) or horizontal piping. Calculated results are given over a range of insulation types and thicknesses, and include surface temperature, heat flow, annual cost of fuel, payback period, annualized rate of return, and annual CO2 emissions.

The Financial Returns/Considerations calculator was developed to provide a convenient way to estimate the financial returns related to investments in mechanical insulation: Simple Payback in Years, Internal Rate of Return (IRR or ROI), Net Present Value (NPV), and Annual and Cumulative Cash Flow. It can be used for an overall mechanical insulation project or for a small mechanical insulation investment such as insulating a valve or replacing a section of insulation.

The Time for Freezing of a Fluid in an Insulated Pipe calculator estimates the time for a long, fluid-filled pipe (no flow) to reach the freezing temperature. It is important to recognize that insulation retards heat flow; it does not stop it completely. Well-insulated pipes, however, may greatly extend the time to freezing.

The Temperature Drop for a Fluid in an Insulated Pipe calculator estimates the temperature drop (or rise) of a fluid flowing in a duct or pipe. An example is the use of insulation to minimize temperature change (either temperature drop or rise) of a process fluid from one location to another (e.g., a hot fluid flowing down a pipe or duct).

The Simple Heat Flow Through an Insulation calculator estimates the heat flow through insulation for flat or cylindrical systems given the temperatures on each side and the effective conductivity of the insulation material.

The Controlling Surface Temperature with Insulation calculator estimates the thickness of insulation required to obtain a specified surface temperature given the boundary temperatures, the conductivity of the insulation material, and the surface coefficient.

Offering E-Learning Modules

Currently in development is a series of e-learning modules tailored to help decision makers, end users, and others in the industrial and commercial sectors learn about the benefits of mechanical insulation and how it can add to their energy efficiency efforts. The series will include:

  • Educational Series Introduction and Defining Mechanical Insulation
  • Mechanical Insulation Science and Technology
  • Benefits of Thinking About Mechanical Insulation Differently—Why Insulate?
  • Mechanical Insulation Design Objectives and Considerations
  • Mechanical Insulation Materials and Systems
  • Mechanical Insulation Installation and Maintenance
  • 3E Plus® Insulation Thickness Software and NIBS MIDG Online Calculator Demonstrations.

The first modules are expected to be ready in the second quarter of 2011, with all seven modules released by the end of the year. They will be housed at a DOE website with links from NIA, its alliance partners, NIBS, and others. Like the calculators, they will be free and constantly available.

Stay Tuned

NIA is working to improve energy efficiency and educate all industry participants on the many benefits of mechanical insulation. The recognition due mechanical insulation is long overdue, primarily because of the lack of understanding about mechanical insulation and its value. The initial phase of MIC is just the first step in supplying that understanding. Can you imagine what a phase two would look like?

Note
1. U.S. Department of Energy, 2009 Buildings Energy Data Book.

Green Building Market Grows 50 Percent in 2 Years Despite Recession

The U.S. green building market is accelerating at a dramatic rate, says McGraw-Hill Construction’s Green Outlook 2011: Green Trends Driving Growth report. The value of green building construction starts was up 50 percent from 2008 to 2010—from $42 billion to $55 billion-$71 billion—and represents 25 percent of all new construction activity in 2010. According to projections, the green building market size is expected to reach $135 billion by 2015.

Green building is the bright spot in an otherwise tough economy, and in some sectors, that rate of growth has been remarkable. In nonresidential building, for example, the green building market share is even higher than the overall market. Today, a third of all new nonresidential construction is green—a $54 billion market opportunity. In 5 years, nonresidential green building activity is expected to triple, representing $120 billion to $145 billion in new construction (40-48 percent of the nonresidential market) and $14 billion to $18 billion in major retrofit and renovation projects.

To break it down further, health-care construction this year is expected to grow its green share to as much as 40 percent (valued at $8 billion-$9 billion in 2010). Education (valued at $13 billion?$16 billion in 2010) and office green construction (valued at $7 billion?$8 billion in 2010) also remain strong sectors, showing high increases in market share, due in part to the fact that bigger projects are the most likely to “go green.” This year, the U.S. Green Building Council’s LEED specification is mentioned in 71 percent of all projects valued at over $50 million.

Aside from market size estimates, the 32-page Green Outlook 2011 report provides insights into key trends, perceptions, and motivators in the green building space. For example, building owners cited three business benefits as the main drivers for building green:

  • Reduction in operating costs of 13.6 percent on average for new buildings and 8.5 percent for retrofits;
  • Increase in building values of 10.9 percent for new buildings and 6.8 percent for retrofits; and
  • Increase in return on investment (ROI) of 9.9 percent for new buildings and 19.2 percent for retrofits.

Beyond these bottom-line advantages, McGraw-Hill Construction attributes green building’s rapid expansion to owners’ desire for market differentiation, growing public awareness, and an increase in local and federal government regulations. As of September 2010, green building legislation and initiatives were present in 12 federal agencies and 33 states, and the proliferation of local government initiatives have increased at an especially impressive pace—from 156 localities in 2008 to 384 localities in 2010.

McGraw-Hill Construction’s Green Outlook 2011 is
produced by a staff of researchers, economists, and analysts, drawing from its Dodge project database, its construction market forecasts, proprietary market research, and secondary research, as well as extensive data and trend analysis. More information and specific green building projects can be found in the Green Outlook 2011 report and on the GreenSource website. To order a copy of the report, visit www.construction.com/market_research.

Global Insulation Demand to Approach 23 Billion Square Meters in 2014

World demand for insulation is forecast to increase 5 percent per year through 2014 to nearly 23 billion square meters of R-1 value, a substantial improvement over the 2004-2009 rate. Insulation consumption in most industrializing nations will continue to expand at a healthy pace. In developed countries, sales of insulation materials are expected to rebound after falling sharply in 2008 and 2009 because of the global financial crisis. These and other trends are presented in World Insulation, a new study from The Freedonia Group, Inc., a Cleveland-based industry market research firm. Findings also include:

  • Nonresidential construction activity and associated insulation demand in industrializing regions are forecast to expand at a healthy pace. The adoption of new insulation standards for buildings and the implementation of government programs to encourage insulation use will spur product sales in many countries.
  • The insulation market in North America will register the fastest growth through 2014, driven by the large U.S. market. Insulation consumption in the United States is expected to increase more than 7 percent per year during this time, after it declined dramatically between 2007 and 2009 because of turmoil in the housing sector. The U.S. residential segment will be responsible for nearly all insulation market gains in North America through 2014.
  • More than 40 percent of all new insulation demand generated during the 2009-2014 period will be attributable to the Asia/Pacific region. Several Asian countries are forecast to record rapid growth, including India, China, and Indonesia. China alone will account for 29 percent of all new global insulation demand between 2009 and 2014.

World Insulation (published 02/2011, 393 pages) is available for $6,100 from The Freedonia Group, Inc., 767 Beta Drive, Cleveland, OH 44143-2326. For more information, visit www.freedoniagroup.com.

Construction Spending Tumbles to 10-Year Low in December, with “Very Mixed” Outlook for 2011, Says AGC Chief Economist

Rental housing, warehouse, hospital, and factory construction show best prospects for improvement, while schools and other public construction may shrink further

Construction spending tumbled 2.5 percent in December to a $788 billion seasonally adjusted annual rate, the lowest level in a decade, the Associated General Contractors of America (AGC) noted in an analysis of new Census Bureau data. All three major components—private residential, private nonresidential, and public construction—shared in the decline.

“These dismal results show that the agony of the recession continues for millions of construction workers and their firms,” said Ken Simonson, the association’s chief economist. “Construction spending fell again in the last 2 months of 2010, and the preliminary total for the year was the lowest since 2000.”

Simonson noted that there were a few bright spots. Power construction climbed for the fifth straight month and finished the year 13 percent higher than in December 2009, due to a mix of oil and gas-fired power plants, renewable power projects such as solar and wind generation, and transmission lines—all of which Simonson said he expects will continue strongly in 2011. Highway and street construction slipped 1.6 percent in December but was 7.6 percent of the year-earlier level. Spending on transportation facilities, such as truck terminals, airports, and transit projects, was up slightly from November and from year-ago levels.

“The outlook for 2011 is very mixed,” Simonson commented. “Spending on rental housing, warehouses, hospitals, and factories should pick up. Power construction should stay strong, and federal dollars for stimulus and base realignment, or BRAC, projects will continue to sustain some contractors. But public school construction and other state and local projects will keep shrinking, while single-family homebuilding, retail, and office construction are likely to remain feeble.”

Contractors themselves also have mixed views, according to a recent survey sponsored by AGC and Navigant Consulting. On balance, more firms expect to hire workers than to shrink in 2011, by a 27 to 20 percent margin, but only 16 percent of the 1,277 respondents said they thought the overall construction market would pick up in 2011. Nearly half?48 percent?thought the turnaround would occur in 2012, with 36 percent saying it would be even later.

For more information, visit www.agc.org.

Construction Starts to Increase 8 Percent in 2011, Says McGraw-Hill Construction Outlook Report

Residential and commercial construction starts expected to improve in 2011

McGraw-Hill Construction, part of The McGraw-Hill Companies, last fall released its 2011 Construction Outlook, a mainstay in construction industry forecasting and business planning, which predicts an increase in overall U.S. construction starts. The level of construction starts in 2011 is expected to advance 8 percent to $445.5 billion, following the 2 percent decline predicted for 2010.

“While the economy is still facing headwinds, the stage is being set for construction to see modest improvement in 2011 from this year’s very weak activity,” said Robert A. Murray, vice president of economic affairs at McGraw-Hill Construction, addressing nearly 400 construction executives and professionals at the 72nd annual Outlook 2011 Executive Conference in Washington, D.C. “We’re turning the corner, slowly. 2011 will be the first year of renewed growth for overall construction activity, and 2010 becomes the final year of a very lengthy and unusual construction cycle.”

Based on significant research and in-depth analysis of macro-trends, the 2011 Construction Outlook details the forecasts for each construction sector, including:

  • Multifamily housing will rise 24 percent in dollars and 23 percent in units, continuing to move gradually upward.
  • Commercial buildings will increase 16 percent, following a 3-year decline, which dropped contracting 62 percent in dollar terms. The levels of activity expected for stores, warehouses, offices, and hotels in 2011 will still be quite weak by historical standards.
  • The institutional building market will slip an additional 1 percent in 2011, retreating for the third straight year. The difficult fiscal climate for states and localities will continue to dampen school construction, although the health-care facilities category should see moderate growth.
  • Manufacturing buildings will increase 9 percent in dollars and 11 percent in square feet.
  • Public works construction will drop 1 percent, given the fading benefits of the federal stimulus act for highway and bridge construction.
  • Electric utilities will slide 10 percent, falling for the third year in a row.

For more information on the 2011 Outlook, visit http://construction.ecnext.com/coms2/summary_0249-360828_ITM_analytics. To learn more, visit www.construction.com or follow @mhconstruction on Twitter.

There are a number of issues related to mechanical insulation the industry needs to address, including outdated specifications, incomplete drawings and bid documents, “value engineering,” improper pipe support systems, inadequate clearance between insulated systems, improper insulation systems for air handling ductwork, and performing insulation prior to the sealing of the building envelope.

The Illinois Regional Insulation Contractors Association (IRIC) Standards Committee members met with several architects and mechanical engineers in November 2010 to tackle these issues. The purpose of the meeting was to discuss areas of the construction process that have become difficult for mechanical insulation contractors and to create support for an advisory committee consisting of contractors, architects, and mechanical engineers. Topics of concern for both the mechanical insulation contractors and the architects and engineers were discussed. This was the first meeting between these third-tier mechanical insulation contractors and the front-line architects and mechanical engineers. Most of those on the front line know and understand there are problems with mechanical insulation specifications and field execution, and all want to assist in rectifying the problems.

Specifications

The first item up for discussion was specifications. It was noted that the contractors still see specifications with materials that have been discontinued, insulation schedules that do not identify the thickness of the materials, specifications requiring duct lining where lining is not acceptable, and a myriad of other contradictions to quality insulation standards.

In fact, one of the charges of the Standards Committee is to assist engineers in updating their specs. Several of the mechanical engineers indicated that they know their specifications are outdated, incomplete, and are specifying materials not manufactured today, and some asked Standards Committee members to assist them in reviewing their specs.

The Standards Committee is assisting some school districts in reviewing their specs now. The design and engineering community recognize this problem, but most don’t have time to go through the mechanical insulation spec. It was noted that poor specs are usually overlooked until there is a failure and the costs associated with the failure begin to pile up.

Two solutions were discussed. First, the engineering community will attempt to update their specifications. Second, the mechanical insulation contractors will correspond with the specification creator when they see portions of specs that are inadequate, if there is time. Both parties recognize that time is the great enemy in this process. Bid deadlines and the fact that the mechanical insulation contractors are usually third-tier vendors keep them from accessing the decision makers.

Incomplete Drawings

Following the specification discussion, the problem of incomplete drawings was addressed. One of the architects asked what kinds of things are missing from the drawings. The response was a litany of items, including ductwork not sized properly if at all; pipe systems not complete; pipe systems not sized; areas of the building with no mechanical systems shown; no room finish schedule or ceiling schedule to show which ducts and piping are exposed and which are concealed, or which are in conditioned and non-conditioned areas; incomplete equipment schedules; no sizes for much of the equipment; and refrigeration system piping not shown or sized.

The luncheon guests suggested to the committee that a quick phone call could solve many of these problems. The contractors protested that with dozens of projects being bid daily or weekly, it was hard to contact the engineers for every drawing omission. Many of the engineers don’t answer their phones in the days prior to bid. Frequently, when they can contact the engineer, they are told to bid the project per “plans and specs.”

The above specification and drawing problems can be mitigated to some degree. Most contractors apply additional costs to the bid when the spec or drawings are inadequate. Others, however, overlook these problems or don’t see them at all, and can wind up with a project without sufficient funds to complete the mechanical insulation work in a profitable manner. The gray area left after poor specs and drawings allow for abuse of the bidding system and greater costs to the owner.

“Value Engineering”

The third item on the agenda was “value engineering.” When “value engineering” is discussed with a group of architects and engineers, they laugh. Why is that? Could it be because they know real “value engineering” does not mean remove insulation from the hot pipe system to save money on the installed cost of the building? Could it be that they know real “value engineering” can mean increasing the mechanical insulation thickness to offer the owner reduced cost to operate his/her building and reduced carbon footprint and greenhouse gas emissions?

This fight to end “value engineering” as we know it is far from over. Mechanical insulation contractors across the country, both union and open shop, are offering real “value” in this “value engineering” model. The days of “value engineering” mechanical insulation out of a building are numbered. Those who allow it to happen to their building will pay in the cost to operate the building on both the cooling and heating cycle. All in attendance at this meeting agreed that it is time for a change.

Recently this author had the opportunity to calculate the heat loss for a building owner that took a credit for not insulating the domestic hot water lines in the walls of a new building. Figure 1 shows the costs associated with this decision. Over 20 years it will cost the owner more than $950,000. The owner received the “value engineered” amount of $74,000 in credit for not insulating this pipe, so the net cost to the owner is around $875,000 over 20 years. Was that really “value engineering”?

Improper Pipe Support Systems

The fourth item on the agenda was improper pipe support systems. The architects and engineers did not (nor should they) accept responsibility for improper pipe supports, except that they should discuss these problems with the general contractor and mechanical contractor during field visits to the project.

Figure 2 shows copper dual temp piping attached to a unistrut. There are not enough support rods to lower the unistrut to allow for the insulation to run through the support. The mechanical contractor expected the insulation contractor to cut out for the unistrut. This, of course, could be disastrous on cold piping systems.

Figure 3 shows copper domestic water piping clamped to a unistrut. The plumber argued that the bushing material (meant to separate dissimilar metals) is an insulator and therefore there is no need to insulate the pipe system at the unistrut. The architect on that project, who was in attendance at this meeting, did not buy the plumber’s argument. The plumber had to replace all the supports with proper material that allows for complete insulation of the system.

The contractors explained that they have seen welded saddles on chilled water pipe systems, “T” supports welded to chilled water pipe, and suspended clamp hangers on chilled water pipe. They talked about chilled water and steam pipe systems resting on the same support channel with no provision to separate the systems.

Figure 4 shows a floor support for chilled and hot water riser pipe systems. The heavy gauge steel plate is welded to all the pipes above and below the slab. The mechanical contractor said, “Just make it work.” Throughout this conversation, it became clear that somebody was not doing his job; otherwise these situations would not occur.

One of the architects at the meeting said he didn’t understand the problem. If the pipe or duct system is installed improperly, make the contractor do it right; tear it out if necessary. In the real world, with the time constraints construction is under, “fix it” sometimes doesn’t work because there is no time. The same architect retorted that he didn’t care if they had to do it working 24 hours a day.

So the insulator must try to make it work. The times are changing, however. The insulator is writing letters saying he will not be responsible for these kinds of conditions. One of the most interesting aspects of this discussion was that the architects spend much more time on job visits than do the engineers. The architects can see to it that support issues are avoided.

Insufficient Clearance

In Figure 2, we see not only pipe support issues but also clearance issues. The dual temp pipes in that figure are so close together that there is not enough room for the proper thickness of insulation. This picture began the discussion about allowing enough room for the mechanical insulation to be installed properly. The committee offered many situations that preclude installing the proper amount of insulation at the proper thickness:

  • ductwork installed tight to the ceiling and/or walls
  • ducts, one that receives insulation and one that does not, run so tight that insulation cannot be installed on the top and sides of the duct requiring insulation
  • pipe risers running from floor to floor in cored holes too small for the pipe with the insulation.

Figure 5 shows chilled water and hot water pipes too close together and running through a floor. The opening is not large enough and the pipes are too close together to allow the proper insulation thickness to be installed.

The architects asked whether insulation contractors are included in the pre-construction meetings to help avert some of these issues. Third-tier contractors are seldom included in this important meeting and are expected to make do and not rock the boat. Several of the architects indicated that they would ask the mechanical contractor to bring the insulation sub-contractor to the pre-construction meeting so the important issues that pertain to mechanical insulation can be addressed. The issues that pertain to pipe installation and sheet metal installation will be brought to the trades that perform that work as a direct result of this meeting.

This is such an important issue that the Chicago Public School system has an item in the specification discussing it: “Coordinate clearance requirements with piping Installer for piping insulation application, duct Installer for duct insulation application, and equipment Installer for equipment insulation application. Before preparing piping and ductwork Shop Drawings, establish and maintain clearance requirements for installation of insulation and field-applied jackets and finishes and for space required for maintenance.”

Improper Ductwork Insulation

Many states and cities have different codes that regulate what is acceptable for insulation or lining on sheet metal ducts. In most areas lining is not acceptable on fresh air intake ducts because dust, dirt, and moisture can be carried into the duct system along with the outside air and create an atmosphere for mold growth. Many regions don’t allow lining on make up air ducts to kitchen hoods. Most states don’t allow supply and return air ducts servicing operating rooms to be lined. The same is true for patient care rooms and birthing rooms.

The committee said that infractions of these codes are frequently seen in local markets. Usually, when an engineer is told of this problem, they allow the external insulation to be installed. So the engineer has specified insulation on the exterior of an outside air intake duct. The design for the system is 10°F. But what if the area is subject to frequent -15°F? Ten degrees could be an average for the area but three or four days of -15°F could mean failure. All the architects and engineers agreed and indicated they would make sure that lining is used only where it should be and can be used safely.

Insulating Prior to Sealing the Building Envelope

Every mechanical insulation contractor has been asked or forced to insulate a system prior to the building being closed in. The arguments against this practice fall on deaf ears—that is, until a problem arises.

Figure 6 shows what can result from insulation being installed prior to the closing in of the building: water pouring out of the insulation system. The pipe shown is factory insulated by the fan coil manufacturer. You can tell by the use of duct tape on the system—most good insulators do not use duct tape to secure flexible elastomeric insulation. The water accumulated on the floors of the building from rain and snow and poured down the chase openings, filling the insulation system with moisture.

Mechanical insulation contractors are frequently told to protect their work and proceed even under open building conditions. The concoction created by the snow melt chemicals, the residue from the concrete, and other agents on the floors can cause stress on the pipe while trapped under the insulation. The cost to repair such stress on the pipe can be astronomical.

Continuing Collaboration

The parties who attended this first luncheon to address mechanical insulation issues all agreed that they should do it often and should introduce new materials during this event. The input from the design and engineering community was very valuable and will assist contractors in the future.

“The Forgotten Technology” is finally getting the recognition it deserves as the original green technology in construction. The attendees at the IRIC luncheon don’t want to find themselves trying to work through a problem that could have been avoided by the correct installation of mechanical insulation.

Figure 1
Figure 2
Figure 3
Figure 4
Figure 5
Figure 6

Learning the vocabulary is the first step to truly understanding any subject, and mechanical insulation is no exception. Specialized terms abound in the industry, some of which are frequently misunderstood or misused, and some that people may find confusing. Technical experts who are members of the National Insulation Association have compiled the following list of definitions to help you better understand mechanical insulation.

Coating
A liquid or semi-liquid that dries or cures to form a protective finish, suitable for application to thermal insulation or other surfaces in a dry thickness of 30 mils or less per coat.
Facing
A thin covering adhered to the surface of insulation prior to field installation.
Finishes
Jackets, mastics, or strong films used for aesthetics or to protect insulation from at least one or more of the following: weather, mechanical, and/or personnel abuse.
Lagging—Insulation
A block material for insulating tanks and boilers, usually curved or tapered; can be made from any of several insulation materials.
Lagging—Jacketing
Jacketing installed over insulation.
Jacket
A covering installed over insulation.

Conditioned Space
Building area supplied with conditioned air that is heated or cooled to a certain temperature and may be mechanically controlled to provide a certain humidity level.
Unconditioned Space
An unconditioned space is one without conditioned air.

Mean Temperature
Sum of the cold surface temperature and the hot surface temperature divided by two. (Thermal conductivity charts are calculated to use mean temperatures.)
Service Temperature Limits
The temperature to which the jacket or coating may be subjected when applied over insulation. It does not refer to the operating temperature of the equipment, vessel, or pipe.

Apparent Thermal Conductivity
A thermal conductivity assigned to a material that exhibits thermal transmission by three modes of heat transfer resulting in property variation with specimen thickness, or surface emittance. (See Conductivity, Thermal.)
Conductivity, Thermal
The time rate of steady state heat flow through a unit area of a homogeneous material induced by a unit temperature gradient in a direction perpendicular to that unit area.
C-Value (Thermal Conductance)
A measure of the rate of heat flow for the actual thickness of a material (either more or less than 1 inch), 1 square foot in area, at a temperature difference of 1°F. If the K-value of a material is known, the C-value can be determined by dividing the K-value by the thickness. The lower the C-value, the higher the insulating value.
K-Value (Conductivity)
The measure of heat in Btus that pass through one square foot of a homogeneous substance, 1 inch thick, in an hour, for each degree F temperature difference. The lower the K-value, the higher the insulating value.
Apparent Thermal Resistivity
A thermal resistivity assigned to a material that exhibits thermal transmission by three modes of heat transfer resulting in property variation with specimen thickness, or surface emittance. (See Resistivity, Thermal, r.)
R-Value (Resistance)
A measure of the ability to retard heat flow rather than the ability to transmit heat. R-value is the numerical reciprocal of “U” or “C,” thus R = 1/U or 1/C. Thermal resistance R-value is used in combination with numerals to designate thermal resistance values: R-11 equals 11 resistance units. The higher the “R,” the higher the insulating value.
Resistance, Thermal, R
The quantity determined by the temperature difference, at steady state, between two defined surfaces of a material or construction that induces a unit heat flow rate through a unit area.
Resistivity, Thermal, r
The quantity determined by the temperature difference, at steady state, between two defined parallel surfaces of a homogeneous material of unit thickness, that induces a unit heat flow rate through a unit area. (r in SI units: m K/W.) (r in inch-pound units: h ft F/Btu or h ft² F/Btu in.)

Seal
To make water-tight or airtight.
Sealant
Sealants in insulation function primarily as water and vapor seals. They may also be used as adhesives and for expansion joints for metal, masonry, cellular glass, etc. They must exhibit low shrinkage, excellent adhesion, and permanent flexibility.

Moisture Barrier
A plastic coated paper or polymeric coating applied to the inner surface of a metal jacket for the purpose of reducing corrosion of the jacketing.

Note: moisture barriers are not water vapor retarders.
Water Absorption
The increase in weight of a material expressed as a percentage of its dry weight or volume after immersion in water for a specified time.
Water Vapor Permeability
The time rate of water vapor transmission through unit area of flat material of unit thickness induced by unit vapor pressure difference between two specific surfaces, under specified temperature and humidity. Permeability is measured in the IP system in perm inches.
Water Vapor Barrier
See Water Vapor Retarder.
Water Vapor Retarder
A material or system that significantly impedes the transmission of water vapor under specified conditions.
Water Vapor Retarder (Barrier)
A material or system that significantly impedes the transmission of water vapor under specified conditions.
Water Vapor Transmission Rate (WVTR)
The steady state water vapor flow in unit time through unit area of a body, normal to specific parallel surfaces, under specific conditions of temperature and humidity at each surface.
Weather Vapor-Retarder (barrier)
A vapor retarder that also protects from atmospheric conditions.

For more definitions, consult the Insulation Science Glossary. You’ll also find other handy reference tools throughout the Techs & Specs section of Insulation.org.

The world of construction is full of misconceptions, which those in the industry often do not see or recognize as such. The assumption is that everyone is fully aware of the situations that arise during the construction of a building or facility. This article attempts to shed some light on the misconceptions mechanical insulation contractors face.

The definition of misconception is: a mistaken thought, idea, or notion; a misunderstanding. The construction industry is fraught with them. During my decades in the mechanical insulation industry, I have witnessed many situations where a lack of communication caused the misconception that owners and architects were aware of changes or practices that could be detrimental on a construction project.

The Domino Effect

An architect I spoke with indicated he is tired of the changes being required to reduce the cost of a building. A case in point was the reduction of the ceiling space from 24 in. to 18 in. to save money on the general cost of the building.

But did it really? The building was already on the blueprints. The mechanical engineer had already spent time and money designing the sheet metal, electric, plumbing, heating, coaxial cable, and the other systems in the ceiling. It wasn’t until the sheet metal contractor visited the jobsite that he noticed that the ceiling space was reduced. The 20 in. duct was not going to fit in the 18 in. space—time for a redesign.

After the piping trades and the electrical contractors did their work in the diminished space, it was the mechanical insulation contractor’s turn for a nasty surprise: the insulation on the pipe will be ½ in. below the ceiling grid. What now? Reduce the insulation thickness, perhaps. Raise the pipe? Not likely; besides, there is no room.

The misconception in this case is that this change had been communicated to all the trades and that the owner understood the ramifications of reducing the ceiling space. Unfortunately, the process and the changes necessary were not well thought out and the trades were not notified. This simple change wound up costing a lot of money. Perhaps the cost was not passed on to the owner, but somebody paid. Somebody always pays.

The Costs of “Value Engineering”

Mechanical insulation contractors are painfully aware of “value engineering.” When a project comes in over budget, all the mechanical trades begin the process of reducing the cost of the building: a little less of this, a little less of that, a little less insulation on this system, remove the insulation from that system, and so on.

The misconception is that the owner is aware of these changes; in many cases, the owner has not been informed. “Value engineering” is really just “cheapening the job.” Aside from any life-cycle costs incurred by “value engineering” other mechanical trades, reducing and/or removing mechanical insulation may cost the owner many thousands, if not millions, of dollars over the life of the building.

Recently, I became aware of a “value engineered” project in which the mechanical contractor removed the insulation from roughly 15,000 LF of hot water piping. The credit for this work was around $75,000. The annual savings if the pipe was insulated with 1 in. material was around $37,000. The 20-year ROI (using the new Financial Calculator in the Mechanical Insulation Design Guide at www.wbdg.org/midg) was more than $950,000. I was under the misconception that the owner was aware of this change, but he was not. When a mechanical insulation contractor is asked to “value engineer” a project, he is usually under the misconception that all parties are aware of the proposed changes and that they are justified by the savings.

Sacrificing to the Schedule

In any large market, mechanical insulation contractors frequently preform work on multi-story buildings and are sometimes required to insulate mechanical systems prior to the complete closure of the structure. Everyone who has ever been asked to insulate prior to closure of the building knows the complications that can result from weather and water damage to the insulation: mold growth, reduction of insulation values, and possible corrosive environments. The misconception is that the owner is aware of this situation and is willing to risk the damage when water saturates the insulation materials.

Frequently, buildings of this type are under very tight construction schedules. The general contractor and perhaps the architect may risk the possibility of damage to the insulation trying to maintain the schedule. In some cases, the mechanical contractor has fallen behind the schedule and insists that the mechanical insulation be installed without regard for possible material damage and the resulting long-term issues. The insulation contractor will begin work under the misconception that the owner is aware of this practice.

Recently I was told of a project in which the general contractor started the cooling equipment (chillers, air handling units, cooling coils, etc.) prior to the final enclosure of the building and the installation of the mechanical insulation on the duct system. This was done in an effort to maintain the construction schedule. The high humidity of the area, along with high summer temperatures, caused condensation on all the supply ducts. The insulation contractor attempted to dry the ducts prior to installing the insulation, but to no avail. The misconception in this case was that the owner was aware of this practice and its repercussions and had given approval.

Who Knows What

It is astounding how little information is relayed to the owner during the construction process. The owner or the owner’s representative can tell you the color of the floor covering, the type of wall covering, and the type of ceiling tile and windows, but the parts of the building that no one sees are a different story. The misconception that all parties are aware of the significant ramifications of decisions made well below the authority of the owner, architect, and in some cases general contractor is widespread in the industry.

The problem is communication. Mechanical insulation contractors are seldom included in project decisions that may change their contracts, the costs associated with them, and the effectiveness of the finished product.

New technologies may change this situation. Building Information Modeling (BIM) will assist all parties in understanding the space and scheduling requirements of mechanical insulation. This will hold true even for the mechanical insulation contractor if that contractor is at the table.

The mechanical insulation contractor needs to understand that the assumption that all parties are aware of all facets of a building may be a misconception. If something may be detrimental to the quality of the building, the mechanical insulation contractor must protect his/her company by putting these concerns in writing. Don’t get caught up in the misconception that all parties have all the information. When failures of mechanical insulation systems occur, it is too late to say, “I thought everyone was aware of what was being done.”

The Mechanical Insulation Design Guide (MIDG) hosts three new simple calculators: two Energy Loss, Emission Reduction, Surface Temperature, and Annual Return Calculators and the Financial Calculator. The new calculators join the Time to Freezing for Fluid in an Insulated Pipe, Temperature Drop, Simple Heat Flow, and Simple Thickness calculators.

This suite of Mechanical Insulation Assessment and Design Tools were developed under the umbrella of the U.S. Department of Energy’s Industrial Technologies Program’s (DOE-ITP’s) Mechanical Insulation Education and Awareness Campaign (MIC) to make common calculations in the design and analysis of mechanical insulation systems quicker and easier. The browser-based calculators do not require any software to be installed, the results page for each calculation can be printed, and they are free to all users.

The calculators are designed for use by:

  • Corporate executive management
  • Design professionals (general, mechanical, and process
    engineers and contractors)
  • Energy and environmental consultants and/or service companies
  • Facility owners and managers (across all industry segments)
  • Federal, state, and local energy and environmental offices
  • Heating, ventilating, and air-conditioning designers and contractors
  • Maintenance managers and coordinators
  • Engineering educators
  • Mechanical insulation industry participants (manufacturers, distributors, contractors, etc.)
  • Refrigeration designers and contractors
  • Utilities/energy supply companies (all types).

All the calculators now have a single, easily accessible page on MIDG: www.wbdg.org/design/midg_calculators.php. There are also links to them in relevant sections of the Design Objectives text. The calculators are also available on the DOE-ITP’s Software Tools website at www1.eere.energy.gov/industry/bestpractices/insulation_calculators.html. Specific calculator URLs are given below.

Energy Loss, Emission Reduction, Surface Temperature, and Annual Return Calculators

These calculators, one for equipment (vertical flat surfaces) and one for horizontal pipe applications, estimate the performance of an insulated system given the operating temperature, the ambient temperature, and other details about the system. They help illustrate the relationships between energy, economics, and emissions for insulated systems.

The Equipment Spreadsheet (www.wbdg.org/design/midg_design_ece.php) estimates the heat flows through a vertical flat steel surface (typical of the sides of a large steel tank containing a heated or cooled fluid). Information concerning a hypothetical insulation system (e.g., the area, operating temperature, ambient temperature and wind speed, insulation material, and surface emittance of a proposed insulation system) may be input by the user.

The Pipe Spreadsheet (www.wbdg.org/design/midg_design_echp.php) estimates the heat flows through horizontal piping. Information concerning a hypothetical insulation system (e.g., the length of run, pipe size, operating temperature, ambient temperature and wind speed, insulation material, and surface emittance of a proposed insulation system) may be input by the user.

Users will need to input:

  • Surface area in square feet for equipment or length of piping and pipe size
  • Operating temperature in °F
  • Ambient temperature in °F
  • Wind speed in mph (guidance provided with calculator)
  • Insulation type (calculators provide for a selection of five major types)
  • Insulation installed cost (calculators provide typical values)
  • Emittance of surface (guidance provided with calculator)
  • Expected useful life of the insulation system in years
  • Operating hours per year
  • Efficiency of fuel conversion as a percentage (guidance provided with calculator)
  • Fuel type and cost (calculators provide for a selection of five major types and typical cost for each).

Based on input, calculators will provide the following by thickness, in inches, of insulation:

  • Surface temperature in °F
  • Heat loss in Btu/hr
  • Cost of fuel in dollars per year
  • Installed insulation cost (estimated)
  • Payback in months
  • Annual return as a percentage (Simple IRR)
  • CO2 emissions in Metric Tonnes/year.

Financial Calculator

This calculator (www.wbdg.org/design/midg_design_mifc.php) was developed to provide a convenient way to estimate the financial returns related to investments in mechanical insulation: Simple Payback in years, Internal Rate of Return (IRR or ROI), Net Present Value (NPV), and annual and cumulative Cash Flow. It can be used for an overall mechanical insulation project or for a small mechanical insulation investment such as insulating a valve or replacing a section of insulation.

Users will need to input:

  • Initial cost of the investment in dollars
  • First year energy savings in dollars per year
  • Energy cost escalation rate as a percent per year
  • Estimated economic life in years
  • Discount rate as a percentage.

Based on input, the calculator will provide:

  • Simple payback period in years
  • Internal rate of return (IRR or ROI) as a percentage
  • Net Present Value (NPV) in dollars
  • Annual and cumulative cash flows.

Time to Freezing for Fluid in an Insulated Pipe Calculator

This calculator (www.wbdg.org/design/midg_design_tffc.php) estimates the time for a long, fluid-filled pipe (no flow) to reach the freezing temperature.

It is important to recognize that insulation retards heat flow; it does not stop it completely. If the surrounding air temperature remains low enough for an extended period, insulation cannot prevent freezing of still water or of water flowing at a rate insufficient for the available heat content to offset heat loss. Well-insulated pipes, however, may greatly extend the time to freezing.

Users will need to input:

  • Initial temperature of fluid in °F
  • Freezing temperature of fluid in °F
  • Ambient temperature in °F
  • Density of fluid, pcf (guidance provided)
  • Specific heat of fluid in Btu/(lbm·°F) (guidance
    provided)
  • Inside diameter of pipe and insulation in inches
    (guidance provided)
  • Outside diameter of insulation in inches (guidance
    provided)
  • Thermal conductivity (k) of insulation (guidance
    provided).

Based on input, the calculator will provide the estimated time to freeze point in hours.

Temperature Drop Calculator

This calculator (www.wbdg.org/design/midg_design_tdc.php) estimates the temperature drop (or rise) of a fluid flowing in a duct or pipe.

An example is the use of insulation to minimize temperature change (either temperature drop or rise) of a process fluid from one location to another (e.g., a hot fluid flowing down a pipe or duct).

Users will need to input:

  • Entering fluid temperature in °F
  • Ambient temperature in °F
  • Flow rate of fluid in lbm/h
  • Specific heat of fluid in Btu/lbm·°F (guidance
    provided)
  • Length of pipe or duct run in feet
  • Outside perimeter of pipe or duct, including insulation, in feet
  • Overall heat transfer coefficient in Btu/h·ft²·°F.

Based on input, the calculator will provide:

  • Temperature drop
  • Leaving fluid temperature.

Simple Heat Flow Calculator

This calculator (www.wbdg.org/design/midg_data_shfc.php) estimates the heat flow through an insulation for flat or cylindrical systems given the temperatures on each side and the effective conductivity of the insulation material.

Users will need to input:

  • Temperature of hot and cold surface in °F
  • Conductivity of material, Btu-in./(hr·ft²·°F)
  • Area for flat geometry in square feet
  • Thickness for flat geometry in inches
  • Area for cylindrical geometry (outer surface) in square feet
  • Inner and outer radius for cylindrical geometry in inches.

Based on input, the calculator will provide the heat flow in Btu/hr.

Controlling Surface Temperature with Insulation Calculator

This calculator (www.wbdg.org/design/midg_data_stc.php) estimates the thickness of insulation required to obtain a specified surface temperature given the boundary temperatures, the conductivity of the insulation material, and the surface coefficient.

Users will need to input:

  • Operating temperature in °F
  • Ambient temperature in °F
  • Surface temperature in °F
  • Effective conductivity of insulation, Btu-in./(hr·ft²·°F)
  • Surface coefficient in Btu/(hr·ft²·°F).

Based on input, the calculator will provide the calculated thickness of insulation in inches.

What’s Next

The calculators were developed as part of a larger effort by the DOE-ITP to improve the energy efficiency of the U.S. industrial and commercial sectors. Project Performance Corporation and the National Insulation Association, in conjunction with its alliance with the International Association of Heat and Frost Insulators and Allied Workers, are working with the DOE-ITP to design, implement, and execute the MIC, a program to increase awareness of the energy efficiency, emission reduction, economic stimulus, and other benefits of mechanical insulation in the industrial and commercial markets. It was created to:

  • Educate industry about and promote the benefits of mechanical insulation by providing practical data and case studies outlining potential energy savings provided by mechanical insulation installation; and
  • Launch an aggressive public education and awareness campaign to combat climate change and improve energy efficiency.

As a further step in this effort, the MIC is also planning to develop applications (apps) for hand-held mobile devices that will enable users to access these calculators in the field. Other initiatives in the MIC include developing a series of e-learning modules and guest lectures. For more information about MIC and the Mechanical Insulation Marketing Initiative, visit www.insulation.org.

The International Standards Organization (ISO) 50001 Energy Management Standard has the potential to influence up to 60 percent of global energy use. Slated for a mid-2011 release, ISO 50001 offers a standardized framework by which a diversity of facilities—industrial, commercial, and institutional—can establish validated policies and procedures to manage energy use.

Compliance with the ISO 50001 Standard is also the core element of Superior Energy Performance (SEP), an industry-led certification program accredited by the American National Standards Institute (ANSI). The SEP program will enable industrial and commercial facilities to achieve continual improvement toward energy efficiency, as will Global Superior Energy Performance (GSEP), the international counterpart of SEP. Currently in a demonstration phase in a few U.S. regions, SEP provides a transparent, uniform system for verifying energy performance improvements and management practices. It is expected to launch nationwide in October 2011.

On December 8, 2010, the Alliance to Save Energy hosted “Superior Energy Performance: Leadership in Energy Management,” its ninth Capitol Hill briefing as part of the Efficient Enterprises series. The event gathered industrial stakeholders who have been intimately involved in the development of the ISO 50001 Standard and SEP, as well as industry representatives who have piloted SEP in their own plants.
Panelists discussed the development and deployment schedules of the ISO 50001 Standard, its market value, and the results of the first SEP pilot projects in Texas.

ISO 50001

Bill Meffert, senior research engineer with the Enterprise Innovation Institute at Georgia Institute of Technology, offered a detailed overview of the ISO 50001 Standard and insights into the ISO development process.

Fifty-four countries—12 with observer status—are actively participating in the ISO Technical Committee 242 (TC 242), which is responsible for developing the recently approved Draft ISO 50001 Standard. Pending final draft status, the ISO 50001 Standard will be subject to a majority vote by the full ISO membership before it is officially released as ISO 50001.

Ken Hamilton, director of Critical Facilities Services at Hewlett Packard (HP), discussed the market value of ISO 50001. Ken stated that for large multinationals such as HP, which is present in 150 countries worldwide, large-scale energy initiatives need to be applicable across international borders. He also asserted that a robust global standard will help validate energy management practices among leading manufacturers. According to Hamilton, such a global
standard would provide the basis for recognition of energy efficiency improvements, which can be communicated internally and to vendors, customers, shareholders, and the public.

Hamilton went on to say that ISO 50001 provides the necessary flexibility for manufacturers to integrate energy management into existing key performance indicators, which can vary greatly by company and subsector. This approach will enable manufacturers to implement ISO 50001 without disrupting or reestablishing preexisting performance metrics.

Effective energy management addresses the human elements of energy efficiency: process control, system optimization, and equipment maintenance. These elements are often overlooked in favor of capital equipment purchases, Hamilton added.

Dow: Enhancing Operations with Energy Management

The development of both ISO 50001 and SEP benefited from strong industry leadership. Fred Fendt, an Energy Efficiency and Conservation team leader, spoke on behalf of Dow Chemical Company on the extent to which energy management enhances their operations.

“Dow Chemical is among the world’s most energy-intensive companies,” stated Fendt, “so managing energy has a direct impact on our bottom line.”

Since 1990 Dow has reduced its own energy intensity by more than 38 percent, representing an estimated $9 billion in energy cost savings. Fendt explained that effective energy efficiency strategies need to touch four primary components of energy use: procurement, conversion, distribution, and consumption. Fendt lauded ISO 50001 as a comprehensive framework that is flexible while maintaining the rigor necessary to ensure verified energy efficiency gains on a continuous basis.

SEP Pilot Project

Deborah Magoon, director of Integrated Management Systems for Cook Composites and Polymers (CCP) rounded out the panel by discussing CCP?s experience in implementing the SEP pilot project in its Houston, Texas, facility. Magoon, a former plant manager with more than 20 years of hands-on experience, testified to the effectiveness of the energy management approach employed by SEP, reporting that CCP reduced energy consumption during the pilot by 15 percent without any capital investment. By engaging all levels of CCP staff to optimize process energy use and equipment operation, CCP unlocked efficiencies in its manufacturing process that would have otherwise gone unnoticed.

“Our executive management has really embraced the value of energy management,” said Magoon. “Despite facing reductions in sales over 2008 and 2009, CCP has remained in the black, largely due to significant cost cutting in energy expenditures made possible by our energy efficiency efforts.”

On December 9, 2010, at the World Energy Engineering Congress, Magoon and CCP were recognized among three Texas plants as the first U.S. facilities to be certified under the Superior Energy Performance program.

Throughout 2011 the Alliance will continue to host Capitol Hill briefings focused on U.S. industrial energy efficiency as part of the Efficient Enterprises series. These programs will include subject-matter experts from industry,
academia, and government to share various viewpoints on featured topics.
Efficient Enterprises briefings are free and open to the public. For additional information, contact Paul Bostrom at pbostrom@ase.org.

This article was reprinted with permission from the Alliance to Save Energy’s Industrial Program.