Category Archives: Global

Energy is increasingly in the spotlight in 2010, the subject of new government regulations and legislation. Meanwhile, concerns about energy generation and pollution are in the news as the Deepwater Horizon oil spill continues to affect the Gulf of Mexico. Here are a few of the energy stories that may affect the mechanical insulation industry for 2010 and beyond.

EPA Gives Shape to Economy-Wide Greenhouse Gas Regulation

On June 3, 2010, the Environmental Protection Agency (EPA) published its long-awaited “Tailoring Rule,” the latest in a series of federal rulemaking initiatives within the last few months that pertain to the regulation of greenhouse gases.

The Tailoring Rule clarifies the applicability of two major permitting programs under the Clean Air Act, establishing which new sources and modification projects must obtain permits for greenhouse gas emissions.

Preceding the Tailoring Rule was EPA’s Endangerment Finding, published on December 15, 2009, which identified greenhouse gas emissions from mobile sources as a threat to health and welfare. The Endangerment Finding also led to the Mobile Source Rule, published on May 7, 2010, which established new emission standards to constrain greenhouse gas emissions from mobile sources.

Under the structure of the Clean Air Act and another recent EPA rulemaking known as the “Trigger Rule,” tens of thousands of facilities emitting greenhouse gases would require permits for new construction or major modifications beginning in January 2011. The Tailoring Rule is intended to prevent permitting authorities from being overwhelmed with applications from these previously unregulated sources. The Tailoring Rule is significant because it reveals EPA’s plan to phase in greenhouse gas regulation throughout the economy over the next few years.

For questions regarding how federal and state steps to mitigate the effects of greenhouse gases might affect your operations, contact Robert B. McKinstry, Jr., 215-864-8208 or mckinstry@ballardspahr.com; Brendan K. Collins, 215-864-8106 or collins@ballardspahr.com; Jennifer E. Drust, 215-864-8275 or drustj@ballardspahr.com; or any other member of Ballard Spahr?s Climate Change and Sustainability Initiative.

Senate Energy Bills Take Varied Approaches

The energy bills being contemplated in the Senate vary in scope as well as details, according to the Congressional Research Service, which issued a comparison of two bills and a draft on June 16, 2010.

S. 1462, the American Clean Energy Leadership Act (ACELA) of 2009. This bill was introduced by Senator Bingaman and reported by the Senate Committee on Energy and Natural Resources on July 16, 2009. It is a broad energy bill aimed at promoting the development of clean energy technologies, increasing energy efficiency, and promoting domestic energy resources. Incentives for new technology include a renewable energy standard (RES) for electric utilities. The bill does not directly address greenhouse gas emissions: provisions for a greenhouse gas cap-and-trade system were instead included in S. 1733, the Clean Energy Jobs and American Power Act, sponsored by Senators Kerry and Boxer, and reported by the Senate Committee on Environment and Public Works on February 2, 2010.

S. 1462 has a broad array of energy efficiency provisions that include a major financing agency and a variety of programs that cover several sectors. It would establish a Clean Energy Deployment Administration (CEDA) as a quasi-independent agency at the Department of Energy (DOE). The new agency would promote the commercial deployment of clean energy technologies (including energy efficiency) by modifying the Loan Guarantee Program and increasing DOE’s authority to offer additional financial incentives. CEDA would draw upon a new Clean Energy Investment Fund, which would be simultaneously established as a $10 billion revolving fund at the Department of the Treasury.

S. 1462 would require that DOE update the residential and commercial energy codes every 3 years with increasing energy savings targets. Federal training and funding assistance would be available to states that adopt advanced building efficiency codes. Appropriations of $100 million per year would be authorized for 5 years. Second, the bill would direct EPA to establish a broad program of criteria and financial support for retrofits of residential buildings and direct DOE to establish a parallel program for commercial buildings. Third, the bill would provide a low-income rebate for energy-efficient manufactured housing. S. 1462 also proposes a zero-net-energy initiative for residential buildings, federal facility energy efficiency requirements, and several other buildings policies. It does not have a provision for building energy labeling.

S. 2877, the Carbon Limits and Energy for America’s Renewal (CLEAR) Act. This bill was introduced by Senators Cantwell and Collins on December 11, 2009, and has been referred to the Senate Committee on Finance. It would establish a program to control only carbon dioxide (CO2) emissions (covering 80 percent of U.S. greenhouse gas emissions), requiring fossil fuel producers (e.g., coal mines, gas wellheads) and importers to submit “carbon shares” for the CO2 emissions related to the fossil fuels they produce or import. The President would limit (or cap) the quantity of carbon shares available for submission each year, and the Department of Treasury would distribute all of the carbon shares through monthly auctions.

S. 2877 includes two energy efficiency provisions: a consumer loan program and a trust fund that may be used for energy efficiency projects. It would allow the use of Clean Energy Reinvestment Trust Fund (CERT) monies for energy efficiency projects, among other purposes.

S. 2877 would establish an Energy Efficiency Consumer Loan Program. Under the program, any qualified individual (a lawful resident of the United States) would be allowed to borrow against any future energy security dividend (an individual’s pro-rated share of carbon rebate auction proceeds) to invest in energy efficiency or clean energy technologies and services that would reduce energy bills and greenhouse gas emissions.

Discussion Draft of the American Power Act (APA). This draft was released on May 12, 2010, by Senators Kerry and Lieberman. A comprehensive energy and climate change policy proposal, the draft would set greenhouse gas reduction goals similar to those in H.R. 2454 (the bill most comparable to the APA draft), which passed the House in June 2009. The APA employs a market-based cap-and-trade scheme for electric generators and industry with a separate price mechanism to cover emissions from transportation fuels. The draft proposal would allocate a significant amount of allowance value to energy consumers, low-income households, and the promotion of low-carbon energy technologies. In addition, the draft would provide incentives for the expansion of nuclear power, carbon capture and storage technology, and advanced vehicles.

The APA draft proposes to use emission control allowances to support consumer-oriented energy efficiency provisions—offered mainly through states and energy utility companies. The draft would direct the EPA Administrator to distribute allowances to states (2 percent in 2016) and Indian tribes (0.01 percent in 2016) that would be used for energy efficiency and renewable energy purposes. The energy efficiency purposes include programs for building energy codes, manufactured homes, building energy performance labeling, and retrofits of existing buildings. Cost-effective energy efficiency programs administered by local governments and entities may also be eligible.

The APA discussion draft would direct the USDA’s Administrator of the Rural Utilities Service to distribute allowances to eligible entities (public power companies and electric cooperatives) that would preserve or create jobs by providing loans to qualified consumers that will use the loans to implement energy efficiency measures to reduce energy costs, energy use, or greenhouse gas emissions. The Administrator would also be empowered to establish agreements with eligible entities to conduct energy efficiency loan demonstration projects. Such sums as necessary would be authorized for this section.

The APA discussion draft would establish a formula to allocate emission allowances to natural gas distribution companies and to states for the benefit of residential and commercial home heating oil and propane users. A share of allowances allocated to those groups (at least 20 percent for natural gas and at least 50 percent for heating oil and propane) would be required to be used for “cost-effective” energy efficiency programs for energy consumers. The draft would require that allowances allocated to electricity distribution companies be used for the benefit of residential ratepayers. The provision does not directly call for the establishment of an energy efficiency program. However, it calls on the Government Accountability Office to prepare an audit report that includes a description of how local distribution companies meet, or fail to meet, the benefit requirement? including investments made in cost-effective end-use energy efficiency programs.

In addition to the plans discussed above, Senator Richard Lugar (R-IN) has introduced the Lugar Practical Energy and Climate Plan, which according to the Alliance to Save Energy focuses on money-saving efficiency policies designed to create long-term energy savings for cars and trucks, new buildings and appliances, existing homes, and commercial buildings and industry.

It is uncertain when or if any of these bills may come to a vote in the Senate.

Future ISO 50001 on Energy Management Progresses to Draft International Standard

The International Standards Organization’s (ISO’s) future ISO 50001 standard for energy management was recently approved as a Draft International Standard (DIS).

ISO 50001 will establish a framework for industrial plants, commercial facilities, or entire organizations to manage energy. Targeting broad applicability across national economic sectors, it is estimated that the standard could influence up to 60 percent of the world’s energy use.

The document is based on the common elements found in all ISO’s management system standards, ensuring a high level of compatibility with ISO 9001 (quality management) and ISO 14001 (environmental management). ISO 50001 will provide the following benefits:

  • A framework for integrating energy efficiency into management practices
  • Making better use of existing energy-consuming assets
  • Benchmarking, measuring, documenting, and reporting energy intensity improvements and their projected impact on reductions in greenhouse gas (GHG) emissions
  • Transparency and communication on the management of energy resources
  • Energy management best practices and good energy management behaviors
  • Evaluating and prioritizing the implementation of new energy-efficient technologies
  • A framework for promoting energy efficiency throughout the supply chain
  • Energy management improvements in the context of GHG emission reduction projects.

ISO 50001 is being developed by ISO project committee ISO/PC 242, Energy management. The secretariat of ISO/PC 242 is provided by the partnership of the ISO members for the United States (American National Standards Institute) and Brazil (Associação Brasileira de Normas Técnicas). Forty-two ISO member countries are participating in its development, with another 10 as observers.

Now that ISO 50001 has advanced to the DIS stage, national member bodies of ISO have been invited to vote and comment on the text of the standard during the five-month balloting period.
If the outcome of the DIS voting is positive, the modified document will then be circulated to the ISO members as a Final Draft International Standard (FDIS). If that vote is positive, ISO 50001 is expected to be published as an International Standard by early 2011.
For more information, visit www.iso.org.

What’s Ahead?

With so many changes in standards and legislation, it’s hard to predict what’s ahead for the energy/power sector. But one thing seems certain: energy efficiency will be an important part of the immediate future for both power generators and consumers, and mechanical insulation will have a critical role to play.

For the latest information on NIA’s legislative activities, visit www.insulation.org.

How many times have you heard “it smells moldy” or “it smells like mildew”? In most cases, people simply smell a bad odor, find the source, and clean it up. We seldom investigate why, how, and how long the conditions existed, or wonder about the long-term damage to the surface and our health. Anytime mold/mildew is encountered, these questions should be asked immediately, and the reason for the growth should be discovered and rectified as quickly as possible.

A Mold/Mildew Primer

The terms mold and mildew can be used interchangeably; however, in most instances, the physical appearance will determine which name is used. Mildew is generally a white powder that can be disturbed easily. Mold generally has a darker, thicker look and cannot be disturbed as easily.

Mold and mildew are typically pigmented fungal hyphae on the surface of organic materials. Fungi are spore-bearing organisms that do not have chlorophyll and live off organic materials. When fungi are attached to an organic surface for an extended period, they eat down into the material and become darker in color. This is why black mold is harder to remove than mildew. The color can range from white, black, red, and orange to gray.

Mold and mildew are practically everywhere. They move as spores with the air currents and enter a building through open or broken windows; doors; building openings such as pipe penetrations, outside air make-up ducting, and open seams in vertical walls; and, the largest of all these sources, roof leakage. The openings allow not only spores but also moisture to enter, either in liquid or vapor form. Moisture infiltration raises the relative humidity (RH)—the amount of water vapor in the air. In this author’s opinion, when RH climbs above 55 percent, the growth of mold/mildew is greatly enhanced.

The interior environment of most structures is negative in pressure relative to the outside pressure, so each time a window or door is opened, outside air will rush inside with all its pollutants. It is rare to have a structure designed to be neutral in pressure, meaning the outside and inside pressures are equal.

The ideal temperature range for mold/mildew growth is between 40ºF and 100ºF. Adding a nutrient base (most everything in a structure) and moisture makes a perfect environment.

Relative Humidity and Mold Growth

Mold growth does not need standing water; high RH will do. Hygroscopic materials, which absorb and retain moisture, are prevalent in most structures.

Most structures have plumbing, allowing water to be introduced for kitchen, laundry room, or bath facilities. Water may be spilled or a pipe may rupture. Some of this water will evaporate and exit the structure via the air handling system. Some will remain, however, creating conditions for mold growth. This is in addition to vapor moving into the structure via openings in the structure’s walls and roof or through the building materials themselves.

Air’s ability to hold moisture depends on its temperature: the lower the temperature, the less water vapor it can hold. If the RH is 50 percent, then the amount of water vapor in the air is half of what it can hold. When the RH is 100 percent, the air contains all the water vapor it can hold, and the water vapor can condense to a liquid. This occurs when the temperature drops to its dew point.

Both temperature and humidity can vary within a room. If you measure the temperature and humidity at several points in a room, you will find that the mold/mildew problem will be on the surface with the highest RH and next to the coldest surface. This surface is called the first condensing surface. Generally, this condition is present due to a break in the wall insulation, allowing wind to blow through the opening. Common entry points are windows, doors, vents, cracks, and chimneys.

Health Effects on Humans

Mold and mildew can affect the health of occupants breathing the interior air on a daily basis. Some people are extremely sensitive to the spores. Exposure to high levels of Volatile Organic Compounds (VOCs) created by the degrading of substances while mold/mildew is growing can lead to irritation of mucous membranes and the central nervous system, causing dizziness, decreased attention span, headaches, and the inability to concentrate. The Mayo Clinic released a study in 1999 that stated that nearly all chronic sinus infections in the United States (about 37 million) were caused by mold. Mold also will trigger severe asthma episodes in sensitive individuals with asthma.

Mold/mildew spores can be absorbed through mucous membranes, skin, and lungs. When dealing with this substance, appropriate safety gear such as an organic respirator, gloves, and goggles always should be worn. Workers also should wear long-sleeved clothing to protect their arms.

Cleaning Mold and Mildew

Several approaches can be used to clean and remove mold/mildew. The first rule is to always clean with a wet material; never clean mold/mildew with dry rags or a dry brush, since this type of agitation will cause the spores to become airborne and spread to other areas.

There are several products on the market designed to kill mold/mildew on surfaces, and some work. Over 30-plus years as a plant engineer, this author has tried several approaches but always came back to basic sodium hypochlorite, also known as bleach. One should apply a 5-percent solution of chlorine bleach mixed with water to the contaminated surface with a pump sprayer, allow to set for a few minutes, gently scrub with a soft bristle brush, and rinse with clean water. Repeat this procedure as often as necessary to kill all contaminants on the surface. The area should be well ventilated. Mold/mildew spores are virtually everywhere; vigilance is the only solution to minimizing its growth.

Preventing a Recurrence

The first step is to locate the point of entry. Check piping and/or vent penetrations (through walls and ceiling/roof), staining and/or moisture, peeling or blistered paint, soft and broken wall board, and cracks in floor/wall and ceiling/wall junctures. If access to the insulation is possible, it should be checked for wetness and staining. The source of the leakage problem could be one of these items or a combination of several. Each area of leakage must be fully repaired before a complete cleaning can be successful.

Manufacturing facilities contend with mold/mildew problems on a daily basis. Most have ambient air temperature environments in their production areas and controlled environments in their process areas. All have walls that see the outside environment. All have miles of (it is hoped) insulated piping, the majority of which is in the overhead just below the roof, where temperatures can exceed 100ºF and RH can be 70 percent or more. Some pipes will pass through walls into a different environment, such as a mechanical room, normally at ambient temperature or warmer with a high RH (due to leaking steam, water, and damaged insulation) that will condensate and grow mold/mildew.

Good maintenance practices are the key to preventing a mechanical room from becoming a breeding ground for mold/mildew growth. Simple steps such as preventing pipe leaks and properly maintaining insulation will help keep a clean mechanical room environment.

Selecting the correct insulation and jacketing is critical to reducing insulation repair requirements. Many owners choose to use a mastic coating over insulation in the building overhead and equipment room because those areas are unseen under normal circumstances and owners do not want the additional cost of insulation jacketing. Owners often have little understanding of insulation and its benefits, so price will be the governing factor in their decision to install jacketing or mastic. Insulation contractors should work diligently to help owners understand that the small difference in cost between the jacketing and mastic can save the long-term maintenance cost of repairing insulation damaged by a tool falling and breaking the mastic coating, or someone climbing on the piping.

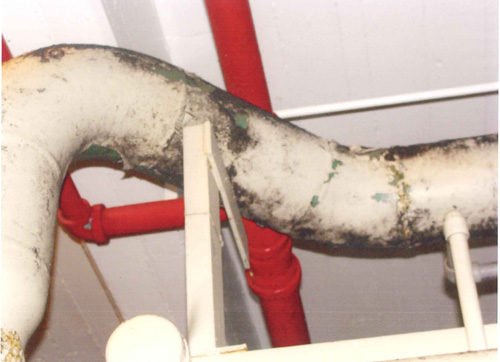
Figure 1
Figure 2
Figure 3

Corrosion under insulation (CUI) of steel operating equipment and piping is recognized as an important problem in the ammonia refrigeration, chilled water, chemical, and petroleum industries. Insulation is a necessary component designed to save energy, control process temperatures, and protect workers from high wall temperatures. The environment under insulation—the CUI environment—can be hot and wet, which promotes aggressive corrosion.

The American Petroleum Institute has directives that address the CUI problem and detail a program of identification, maintenance, and remediation. These directives, as well as efforts by professional societies (NACE International and ASTM), promote the development of new solutions. The issue in achieving a good end result is that no clear solution exists for newly installed piping, or with maintenance and remediation of existing installations.

NACE Standard RP0198-98 (The Control of Corrosion Under Thermal Insulation and Fireproofing Materials—A Systems Approach)1 is an excellent source of information for preventing CUI, but many corrosion engineers would agree that electrolytes will eventually find their way into even the best system. Selecting the right coating is extremely important, as the coating is the last line of defense for keeping the electrolyte from the metal surface and preventing corrosion.

For newly installed piping, CUI has frequently been addressed by the use of high quality protective paint coatings or thermal spray aluminum (TSA). However, this solution can be expensive for use in remediation. The surface preparation for the application of most epoxy or metal filled paints can be extensive; some require grit blast to white metal. In some cases the best alternative for remediation is to replace the entire section with new pipe.

There are many excellent types of coatings available, but this article will focus on a hydrophobic anti-corrosion gel. It tolerates less-than-optimal surface preparation, is designed to keep the electrolyte away from the surface of the substrate, and also has the ability to neutralize the electrolyte if it breaches the vapor barrier and insulation. This coating can be applied beneath most insulation products and is installed by insulation contractors.

Anti-Corrosion Technology

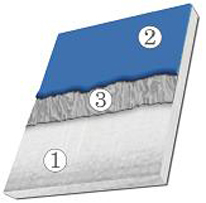
The reactive anti-corrosion gel uses mineralization technology. Mineralization is the ability to grow very thin minerals on metal surfaces for useful purposes. The minerals are formed when reactants are delivered to the surface of the substrate (see Figure 1).

The reactive gel corrosion treatment works as follows:

When the ferrous (steel) surface (1) is covered with a layer of reactive gel (2), the metal surface reacts with components in the gel to form a mineral layer (3). This thin, glasslike layer (3) acts as a barrier between chlorides and the metal surface, thus providing corrosion resistance.

The mineral layer (3) has a thickness of 50 to 200 angstroms, only 0.01 percent as thick as a piece of paper.

Although the thin mineral layer can be damaged by mechanical abuse, there is extra protection built into the system.

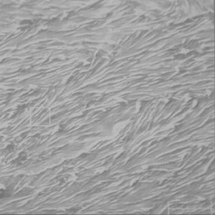
The presence and uniqueness of the mineralized layer can be confirmed by conventional analytical surface methods such as x-ray photoelectron spectroscopy (XPS) or atomic force microscope (AFM) (see Figures 2 and 3).

The anti-corrosion gel works in three basic ways:

  1. Barrier system: The specially formulated products have great adhesion characteristics and are hydrophobic to keep moisture away from the substrate.
  2. Buffering system: If moisture migrates through the gel, it is buffered to a high pH, which protects steel piping.
  3. Mineralization: The engineered surface resists corrosion even if moisture gets to it.

The anti-corrosion gel has a maximum service temperature of 350°F (177°C).

Mineralization Technology

The mineralization technology in the anti-corrosion gel has a history of solving unique corrosion problems. The first application of the mineralization technology was by a major automotive supplier in a crevice corrosion application on the strand of brake cables. The strand-in-sleeve design of the brake cable, combined with the cyclical environment of heat and moisture, creates a severe crevice corrosion environment. The technology has been used for more than 30 years in this application, increasing service life and providing greater reliability.

The first non-automotive industrial application was with the U.S. Navy. Following successful laboratory, pier-side, and shipboard demonstrations of the effectiveness of the gel in preventing crevice corrosion in anchor chain detachable link cavities, the Navy in 1999 changed the Planned Maintenance System (PMS) to specify the use of a mineralizing gel as the replacement for white lead and tallow in all surface ship anchor chain detachable links.

Also in 1999, following extensive testing, the Navy issued Machinery Alteration (MACHALT) 526, which changed the design of the internals of weather deck watertight and airtight door dogging mechanisms. The basis for the change was the use of a mineralizing lubricant inside the spindle sleeve in the door frame to stop the corrosion that had been the cause of dogging mechanism failure. The watertight door-dogging mechanism corrosion problem was one of the top maintenance issues for the fleet.2 In May 2002, a second MACHALT—544—was approved to apply the same technology to ballistic-type dogs in three watertight doors in DDG-51 Class ships. These solutions represented a significant savings for the fleet.

The gel has years of history on CUI applications in the food and beverage industry. It has also been used as flange filler and as an anti-corrosion coating in well head casings and on pig doors, structural steel, tank chimes, ammonia systems, and vessels. Field trials are currently underway to further evaluate this technology in areas where it is cost prohibitive to achieve optimal surface preparation.

Laboratory Tests

Aerated Salt Bath. A test was conducted by DeNOVUS in Moberly, Missouri, to determine the ability of the anti-corrosion gel to protect pipes in an aerated bath of 5 percent salt solution. Fifteen black iron pipes were used to measure the effectiveness of the gel in conditions similar to CUI. Fourteen pipes were coated with the gel, 7 were glass-bead-blasted prior to the application, 7 were left as-received with mil-scale, and 1 was left uncoated to act as a control. All the iron pipes were covered with fiberglass insulation and partially submerged in the 5 percent salt solution aerated bath. One glass bead-blasted and a non-bead-blasted sample were pulled at 7-, 31-, 80-, and 138-day intervals and then at a 1-year interval.

The results of tests show a very distinct line separating the sections of the iron pipes treated with the anti-corrosion gel and the sections left untreated. The untreated pipe sections had significant corrosion at 7, 31, 80, and 138 days, as well as at 1 year. There was no sign of corrosion on the coated sections of the pipes. Performance of the gel was good even with minimal surface preparation prior to the application.

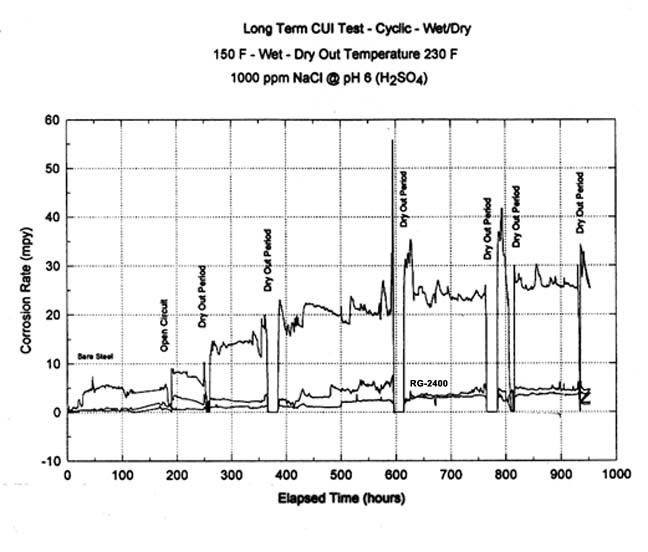
Isothermal. An isothermal laboratory test was conducted by CLI International, Inc., in Houston, Texas: a simulated CUI cell under isothermal and wet/dry cycling test conditions.3 The isothermal tests included maintaining the temperature at the ring surfaces at 150°F (65.5°C) continuously. The wet/dry tests included two cycles of maintaining temperature at 150°F (65.5°C) (wet) for 20 hours and then at 250°F (121°C) (dry) for 4 hours. The samples were evaluated using electrochemical polarization resistance data per ASTM G59 and mass loss (ML) data per ASTM G1.

Test results revealed that the anti-corrosion gel reduced the corrosion rate by a factor of 10 (see Figure 4) and was effective in four practical applications: on bare steel at isothermal (150°F), on pre-corroded steel at isothermal (150°F), on bare steel in wet/dry environment (150/250°F cyclic), and on pre-corroded steel in wet/dry environment (150/250°F).

Weight Loss. ASTM B117 salt spray protocol was used to evaluate anti-corrosion performance. The protocol simulates a severe corrosion environment using saltwater spray. The control coupons (bare steel) were tested alongside the coated samples to ensure a predictable corrosion rate.

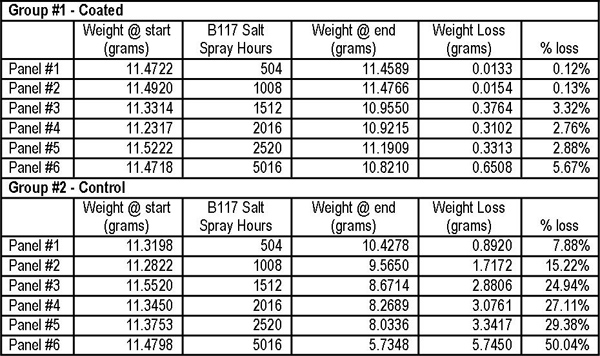
A total of 10 samples (1/2 in. x 3 in. x 0.062 in. 1020 steel coupons) were used for the test. The coupons were weighed prior to being coated or being placed in the ASTM B117 cabinet. Five coupons were coated with approximately 20 mils (1 mil = 0.001 inch) of gel (Group 1) and five were left uncoated to be used as controls (Group 2). The coupons were placed in an ASTM B117 corrosion chamber. Each coating system was inspected and photographed at 504-hour (21-day) increments until 2,520 hours and then at 5,016 hours. One coupon from each group was removed at each 504-hour (21-day) increment until 2,520 hours and then at 5,016 hours.

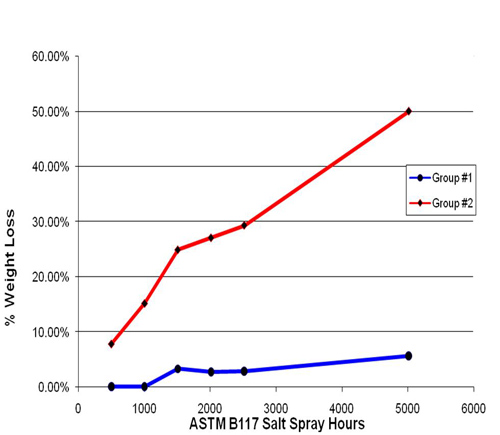
Group 1 was removed, the gel cleaned off with a citrus cleaner, and the corrosion removed by submerging the coupon in acid. After each sample from Group 2 was removed, the corrosion was removed by submerging the coupon in acid. Each coupon was weighed after the corrosion was removed to determine weight loss (see Figures 5 and 6).

The gel samples showed significantly less corrosion than the controls. After 5,016 hours of exposure in ASTM B117 salt spray, the gel sample showed 5.67 percent weight loss versus 50.04 percent for the control sample. The gel was 90.2 percent more effective than the uncoated control after 2,520 hours and 88.66 percent more effective than the uncoated control after 5,016 hours of ASTM B117 testing. Much of the coated sample weight loss came from corrosion at the hole used to hang the coupons (see Figure 7). While this increased the corrosion rate, there was no other way to suspend the coupon without further damaging the coating.

Environmental Testing

A 96-hour static acute toxicity screening test with the saltwater mysid (Mysidopsis bahia) was conducted on this technology by Wildlife International, Ltd., at its aquatic toxicology facility in Easton, Maryland (Project Number 486A-106).

Groups of saltwater mysids (less than 24 hours old) were exposed to three concentrations of the test substance, a negative (dilution water) control, and a solvent control for 96 hours under static test conditions. One replicate test chamber was maintained in each treatment and control group, with 10 mysids in each test chamber for a total of 10 mysids per test concentration. Test chambers were 2 L glass beakers containing 1,000 ml of test solution. Nominal test concentrations were negative control, solvent control, and 1.0, 10, and 100 mg of the anti-corrosion gel.

The solvent control and the 1.0, 10, and 100 mg anti-corrosion gel/L test solutions were prepared by adding the appropriate amounts of test substance along with 0.50 ml of dimethylformamide (DMF) to 1,000 ml of filtered saltwater. Test solutions were stirred vigorously approximately 30 minutes each using Teflon-coated magnetic stir bars and stir plates. Once mixing was complete, mysids were added to the test chambers.

The solvent concentration in all the treatment groups and the solvent control was 0.50 ml/L. All control test solutions appeared clear and colorless. Test solutions (1.0, 10, and 100 mg anti-corrosion gel) appeared clear and colorless, with particles of test substance on the surface and sides of the test chambers increasing in intensity with increasing concentration.

Cool-white fluorescent light tubes were used to illuminate the test and were controlled with an automatic timer to provide a photoperiod of 16 hours of light and 8 hours of darkness. Light intensity at test initiation was 285 lux at the surface of the water. The target test temperature was 25 ±1ºC. Test temperature, dissolved oxygen, and pH were measured in each test chamber at the test’s beginning and end.

Observations of mortality and clinical signs of toxicity were made at approximately 3, 24, 48, 72, and 96 hours. Mortality data at 24, 48, 72, and 96 hours were used to estimate or calculate EC50 (the concentration that gives a response halfway between the baseline and maximum response) values. When possible, the EC50 values were calculated using the computer program of C.E. Stephan. The no-observed-effect concentration (NOEC) was determined by visual interpretation of the mortality and clinical observation data.

Measurements of temperature ranged between 24.1ºC and 25.2ºC throughout the test. Dissolved oxygen concentrations remained >5.4 mg/L (74 percent of saturation) and pH was 8.1 in all treatments and the control groups at the beginning and end of the test. At test initiation, the dilution water salinity was 20 parts per thousand.

Mysids in the negative and solvent controls, as well as all treatment groups, appeared normal and healthy throughout the test. Any mortalities and clinical signs of toxicity in the treatment groups were considered to be incidental and not related to treatment. The 96-hour LC50 (median lethal concentration) was determined to be >100 mg anti-corrosion gel, and the NOEC was 100 mg of the anti-corrosion gel. The test showed that the anti-corrosion gel was determined to have “No Toxicity at 100 ppm (96 Hours).”

The anti-corrosion gel is considered environmentally benign and is accepted by industrial hygiene departments in the food and beverage, oil and gas, and chemical industries.

Surface Preparation

Many coatings require extensive surface preparation for optimal performance. The anti-corrosion gel can be applied on new piping or pre-corroded surfaces with a minimum surface preparation of Steel Structures Painting Council (SSPC) SP-2.4 The anti-corrosion gel needs to “wet out” the substrate to react with the surface. This can be achieved on surfaces that have tight rust, as long as the loose scale is removed.

Application

Anti-corrosion gel can be glove, brush, or spray applied on in-service piping. Application methods have been developed for in-service temperatures as low as -20°F (-29°C) and as high as 350°F (177°C). It can be applied on in-service systems that are expensive to shut down during rehab.

Conclusion

A key step in preventing CUI is selecting the proper coating. Options include epoxies, polyurethanes, coal tar, wax tapes, TSA, and anti-corrosion gels. Temperature, surface prep, type of insulation, ease of application, and environmental and performance needs should all be considered during the selection process.

Notes

  1. NACE RP0198-98, The Control of Corrosion Under Thermal Insulation and Fireproofing Materials—A Systems Approach (National Association of Corrosion Engineers, 1998).
  2. DeNOVUS Watertight Door Case Study—www.denovus.com/casestudies.html.
  3. N.G. McGowan and Dr. D. Abayarathna, “Innovative and Environmentally Benign Solutions for Corrosion Under Insulation (C.U.I.) for Steam and Process Piping,” CLI International, Inc., Test Report, March 2003.
  4. Steel Structures Painting Council (SSPC) SP-2: “Hand Tool Cleaning – Removal of all rust scale, mill scale, loose rust, and loose paint to the degree specified by hand wire brushing, hand sanding, hand scraping, hand chipping, or other hand impact tools or by a combination of these methods. The substrate should have a faint metallic sheen and also be free of oil, grease, dust, soil, salts, and other contaminants.”
Figure 1

Mineral formation

Figure 2

Untreated steel surface

Figure 3

Mineralized steel surface

Figure 4

Isothermal test results

Figure 5

Weight loss test results

Figure 6

Weight loss test results

Figure 7

Coupons used in weight loss test

Improperly designed and installed lagging systems can lead to plate corrosion and gas or air leaks on flues, ducts, and equipment. It is estimated that plate corrosion and flue/air leaks cost the power industry millions of dollars in repairs annually.

Plate corrosion will always lead to gas or air leaks, and the root cause is most often a failed lagging system. Plate corrosion issues are usually addressed only after the gas or air leaks force the power company to address them, but these leaks can easily be prevented by inspecting the installed lagging.

Lagging is the easiest component at a steam-generating facility to inspect, even from a distance. Unfortunately, many power plants fail to recognize the early signs of improperly designed or installed lagging. It is recommended to inspect the lagging both while the boiler is running and during a boiler shutdown. Inspecting lagging in both the cold and hot positions will give a good indication of whether it was installed correctly.

A lagging system is improperly installed when:

  1. It does not present a true plane to the naked eye (aesthetically pleasing).
  2. It does not cover or protect the insulation from the elements at all times.
  3. It is not stiffened or fastened on adequate centers to prevent excessive deflection or “oil canning” in either the hot or cold position.

Avoiding Plate Corrosion

Preventing plate corrosion and poor workmanship issues requires a high expectation of quality, experienced crafts personnel who have previously worked at power plants, and the right tools.

As an example, closing an access opening into a boiler wind box will require the following work (notice the tools typically used).

  1. Re-weld the wind box casing or plate to close the access opening and make it airtight using the following tools:
    • weld wire and torch
    • chalk and line
    • grinder
    • wire brush
    • spring hammer
  2. Re-install insulation attachments and mineral wool and fiberglass board insulation over the now-welded and airtight access opening using the following tools:
    • stud welding gun
    • hand saw (optional—only if cutting hard block-type insulation)
    • chalk and line
    • pencil grinder (used to ensure a good contact point when using a capacitor discharge welding gun)
    • knife (for cutting mineral wool boards and blankets)
  3. Install the outer lagging (rib and flat) over the installed insulation. The lagging attachments must be installed before the insulation is applied. Tools include:
    • drills and nut drivers
    • tin snips (three types for left, right, and straight cuts)
    • tape measure and leveler
    • electric rotary saw
    • circumferential rule
    • squares
    • levels
    • hand seamers
    • chalk and line

Lagging requires finishing tools to complete the work. These finishing tools (tin snips, hand seamers, and grinders) are necessary for the lagging to be deemed properly installed, and they require the most work experience.

Lagging, when properly installed, will always prevent plate corrosion. However, plate corrosion is not the only corrosion issue affecting power plants and lagging. The power industry also must be aware of galvanic and oxide corrosion.

Galvanic Corrosion

Galvanic corrosion occurs when different types of metals make contact with each other. It has the potential to create a hole in the lagging and allow water to penetrate to the plate or casing. This type of corrosion can be prevented by painting the surface of the dissimilar metal materials (e.g., carbon steel angle iron in contact with aluminum lagging) with heat-resistant aluminum paint or by gluing thin felt-type insulation over the face of the dissimilar metals before the aluminum lagging is installed (making sure the felt has the correct temperature rating).

Oxide Corrosion

Oxide corrosion attacks the surface finish of the lagging and occurs when lagging is improperly stored at a power plant. The oxide attack can create a future hole in the lagging or damage the looks of the lagging and make it unsuitable for use. To avoid oxide corrosion, lagging should be handled and stored as follows:

  1. All lagging (rib or flat) material must be stored inside or placed in an area that is not accessible to the weather or plant water.
  2. All lagging (rib or flat) must be stored above the ground or floor to allow air circulation around it.
  3. Individual lagging pieces should be placed on end or edge, never stored flat.
  4. Any lagging stored in its original shipping boxes should not be tightly sealed or covered with plastic to prevent the lagging from sweating.

The Importance of Properly
Installed Lagging

Galvanic and oxide corrosion should never happen and are easily avoided. Plate corrosion, on the other hand, is harder to avoid. It begins with better training and improved awareness about the importance of lagging. It also requires a higher expectation of lagging workmanship from the crafts and the plant personnel, employing experienced crafts personnel who have worked at power plants, and using the right tools of the trade.

Lagging may be the last thing installed at a power plant, but it should be the first thing considered before beginning to insulate boilers or storing materials.

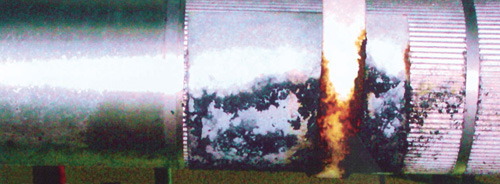
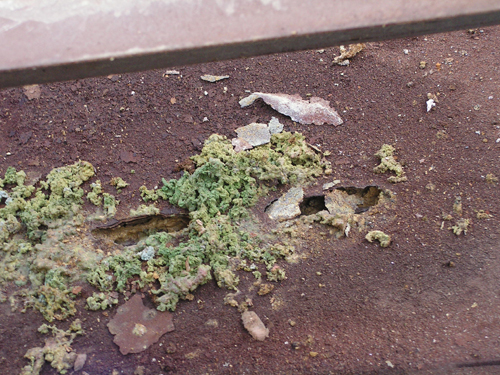
Figure 1

Close-up view of holes in a flue plate caused by corrosion.

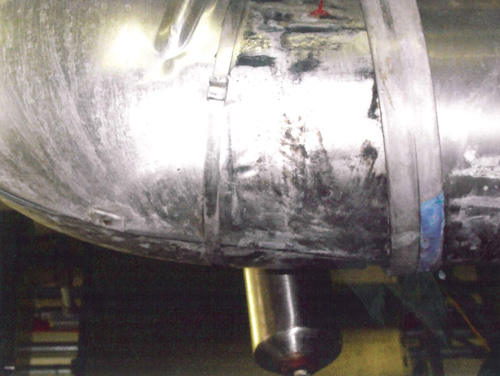
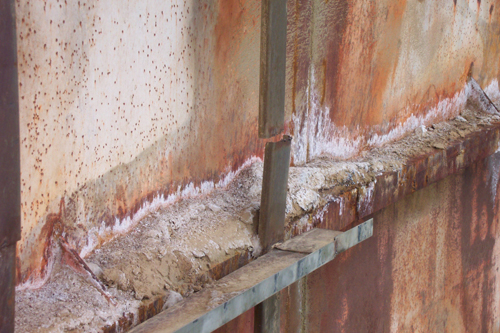
Figure 2

Improperly installed lagging allowed water to get to the flue plate. Notice the improperly installed lagging attachment system, which has the lagging installed directly to the angle iron (dissimilar metals).

Figure 3

Flue plate without insulation showing corrosion.

The two massive and controversial recently enacted health-care reform bills, “Patient Protection and Affordable Care Act” and “Health Care and Education Reconciliation Act of 2010,” contain a number of new rules, such as penalties for individuals who choose to remain uninsured, tax credits and other incentives for employers participating in new insurance pools, penalties for larger employers that do not provide insurance (or provide insurance deemed inadequate or unaffordable), and a voucher system for certain lower income employees who choose not to be covered by their employer’s health plan. Health-care reform also includes more than $400 billion in new taxes on both employers and individuals.

The new laws’ supporters predict that an estimated 3.6 million small business owners will qualify for tax credits for health care beginning this year, receiving almost $40 billion in assistance over the next decade. A large percentage of the 26 million small business employees currently uninsured also will receive help.

What impact will this massive overhaul of health care have on your insulation business?

The Small Business Health Tax Credit (2010)

The new law provides $40 billion in tax credits—direct reductions of the operation’s tax bill—for small insulation contractors and businesses to help them offer their employees health insurance coverage, if they choose to do so. According to lawmakers, more than 60 percent of small employers—more than 4 million firms—will be eligible for these credits.

The Internal Revenue Service (IRS) is already encouraging small businesses to explore and, if qualified, claim the new small business health insurance coverage credit. The credit was created for eligible small businesses to either maintain their current health insurance coverage or to begin offering health insurance coverage to their employees.

Effective January 1, 2010, small insulation contractors and other employers offering health insurance to employees as part of their compensation and contributing at least half of the total premium cost will qualify for the tax credit. The employer must have no more than 25 “full-time equivalent” employees (FTEs), and the employees must have annual FTE wages that average no more than $50,000.

Small employers (those with no more than 25 employees and average wages below $50,000 annually) are eligible for a federal general business tax credit up to 35 percent of the amount spent on health insurance for their employees. However, only employers with no more than 10 employees and average wages below $20,000 per year are eligible for the full 35 percent amount.

On January 1, 2014, this rate increases to 50 percent. The wage limits would be indexed to the Consumer Price Index for Urban Consumers for years beginning in 2014.

Self-employed insulation contractors and other professionals, including partners and sole proprietors, 2-percent shareholders of an S corporation, and 5-percent principals in an incorporated business, are not treated as employees for purposes of the Small Employer Health Insurance Credit. In fact, a special rule prevents sole proprietors from receiving the credit for themselves or their family members.

Self-employed contractors can, of course, deduct the cost of health insurance for themselves and their spouses and dependents. Thus, if an S corporation pays accident and health insurance premiums (under a plan established by the S corporation) on behalf of a more-than-2-percent shareholder who is also its employee and who must include the value of the premiums in his or her gross income, the shareholder is permitted to deduct the cost of the premiums paid on his or her behalf.

Penalty for Remaining Uninsured

Starting in 2014, the new law will require nearly all Americans to have health insurance through an employer, a government program, or buying it directly. That year, new insurance markets will open for business, health plans will be required to accept all applicants, and tax credits will start flowing to millions of people, helping them pay the premiums.

Those who continue to go without coverage will have to pay a penalty to the IRS, except in cases of financial hardship. Fines vary by income and family size. For example, a single person making $45,000 would pay an extra $1,125 in taxes when the penalty is fully phased in, in 2016.

Employer Responsibilities

Prior to the passage of this reform, there was no federal requirement that employers offer health insurance coverage to employees or their families. The new law imposes penalties on some businesses for not providing employees coverage (so-called “pay or play”).

Fortunately, most small insulation businesses will not have to worry about the provision because employers with fewer than 50 employees are not subject to the “pay or play” penalty. The new law exempts all small businesses with fewer than 50 employees from the employer responsibility requirements that begin in 2014. This means, according to lawmakers, that 96 percent of all firms in the United States—or 5.8 million out of 6 million total businesses—will be exempt from the requirement to provide health coverage for employees.

For those that are not exempt, the penalty for any month would be an excise tax equal to the number of full-time employees over a 30-employee threshold during the applicable month (regardless of how many employees are receiving a premium tax credit or cost-sharing reduction), multiplied by one-twelfth of $2,000.

“Free Choice” Vouchers

After 2013, employers offering minimum essential coverage through an eligible employer-sponsored plan, and paying a portion of that coverage, would be required to provide qualified employees with a voucher whose value could be applied to the purchase of a health plan through a soon-to-be-established Insurance Exchange.

Qualified employees would be those who do not participate in the employer’s health plan, whose required contribution for employer-sponsored minimum essential coverage exceeds 8 percent but does not exceed 9.5 percent of household income, and whose total household income does not exceed 400 percent of the poverty line for the family. The value of the voucher would be equal to the dollar value of the employer contribution to the employer-offered health plan.

Health Insurance Exchanges

Beginning in 2014, the new law creates state-based Health Insurance Exchanges to make health insurance affordable and accessible for small businesses and the self-employed. With the option of joining a large “pool,” small employers will have access to the same type of quality, affordable coverage that only large firms currently have. Employees of small businesses will be able to do one-stop comparison shopping for an affordable insurance plan that offers lower rates, stable pricing from year to year, and a choice of quality plans.

Those employed by small businesses but who do not receive insurance through their employer and are on the Exchange will have access to sliding-scale tax credits to help pay their premiums. Effective in 2014, for those with access to the Exchange, sliding-scale tax credits are provided to individuals and families up to 400 percent of poverty level. The tax credits phase out completely for an individual with $43,320 and a family of four with $88,200 in income.

Additional Tax on High Wage Earners

To help pay for making health insurance affordable for small businesses and the middle class, the new law includes an increase in taxes for high earners. Specifically, for tax years beginning after December 31, 2012, the hospital insurance (HI) tax rate will be increased by 0.9 percentage points on an individual taxpayer earning over $200,000 ($250,000 for married couples filing jointly). These figures are not indexed for inflation. Also added to the withholding levy is “unearned income.”

The Unearned Income Surtax

Beginning in 2013, a 3.8-percent surtax called an “Unearned Income Medicare Contribution” will be placed on the net investment income of anyone earning over $200,000 ($250,000 for a joint return). Net investment income includes interest, dividends, royalties, rents, gross income from a trade or business involving passive activities, and net gain from disposition of property (other than property held in a trade or business). It should be noted that income “actively” earned by anyone running a small, closely-held business is exempt because it is not “passive” income.

New Limit on Health Plan Contributions

Insulation contractors and other small business owners, as well as their employees, have long used flexible spending accounts (FSAs), medical savings accounts (MSAs), and health savings accounts (HSAs) to pay for medical expenses with pretax dollars. An HSA goes along with a high-deductible insurance policy and gives individuals a tax deduction for money saved that can later be used for health-care expenses. An FSA has similar tax advantages, but contributions to it are deducted from an employee’s salary, and money in the account must be used by the end of the year.

The new law modifies the definition of qualified medical expenses for health FSAs and HSAs to conform to the definition used for the medical expense itemized deduction (excluding over-the-counter medicines, unless prescribed by a health-care professional) beginning in 2011. The law also caps health FSA contributions at $2,500 per year after 2012, which is indexed annually for inflation after 2013.

The additional tax on non-qualified distributions made from HSAs is increased from 10 percent to 20 percent; on non-qualified distributions from Archer MSAs, the tax bite increases from 15 to 20 percent.

New Reporting Responsibilities

For tax years beginning after December 31, 2010, employers will have to disclose the value of the benefit they provide for each employee’s health insurance coverage on the employee’s annual W-2 form. Next year, anyone paying unincorporated suppliers of equipment, property, supplies, and services more than $600 a year will have to file an information report with each provider and with the IRS.

Simple Cafeteria Plans

To encourage more employers to offer tax-free benefits to their employees, including those related to health insurance coverage, the new law relaxes cafeteria plan rules by carving out a safe harbor from the nondiscrimination requirements for cafeteria plans for qualified small employers.

A cafeteria plan enables employees to choose from a menu of employer-sponsored benefits. For tax years beginning after 2010, a Simple Cafeteria Plan can be established. This plan will be subject to eased participation restrictions so small employers could provide tax-free benefits to their employees. Best of all, a Simple Cafeteria Plan can include self-employed individuals as qualified employees.

Are You Ready?

In 2014, contractors and other businesses employing more than 50 workers will be required to provide health coverage, and most people will be required to have health insurance. The tax on high-cost “Cadillac” health insurance policies—those with annual premiums in excess of $10,200 for individual coverage and $27,500 for family coverage—will not go into effect until 2018. The increase in Medicare payroll taxes begins in 2013, while the tax credits available to small employers for health-care-related expenses start in 2010.

In one of its first steps to carry out the new health-care law, the White House announced it is establishing a temporary insurance pool where uninsured people with medical problems can buy coverage at reduced rates. Federal health officials say the program will be available from late June of this year until January 1, 2014, when private insurers will be required to accept all applicants without varying premiums on account of a person’s medical condition.

Overall, the $940 billion health-care overhaul subsidizes coverage for uninsured Americans, financed by Medicare cuts to hospitals and fees or taxes on insurers, drug makers, medical-device companies, those earning more than $200,000 a year, and employers. Many of the changes in the new law’s more than 2,400 pages, such as requiring most people to have health insurance and employers to provide coverage, will take at least 2 years to go into effect. Will you and your insulation business be ready?

Disclaimer: This discussion is generalized in nature and should not be considered a substitute for professional advice. Readers are advised to contact counsel before embarking on any of the options discussed in this article.

Providing a safe workplace is everyone’s concern, whether you are a contractor, a manufacturer, or the owner and operator of a power plant, chemical plant, or hospital. Failure to provide a safe workplace for your employees can result in serious injuries and even death. You have the responsibility to ensure that your employees have a safe place to work every day. What do you do to ensure this?

The methods by which you fulfill your responsibilities may not be the same as those of your industry peers. How effective you are in meeting these responsibilities has a direct impact on your ability to keep employees at work, your insurance premiums for workers’ compensation costs, the quality of the work you are able to produce, the cost of producing that end product, and how you are affected by regulatory enforcement (Occupational Safety and Health Administration [OSHA] inspections). Secondary impacts include how you are viewed by your peers in industry and, if you are a contractor, your ability to get work and bid jobs (two things increasingly affected by safety records).

In providing a safe workplace for your employees, you face several different obligations. You are expected to comply with either state or federal laws concerning safety, training, recordkeeping, and hazard evaluation. You are also expected to go beyond the “black letter law” and implement techniques and approaches necessary to ensure that your employees do not get injured. These procedures may well go beyond what any particular safety rule or standard requires. Finally, you must address the problem that confronts everyone: employee apathy. You need to address this particular problem by effectively training your employees, providing incentives for their safety compliance, and, finally, enforcing the safety rules and regulations you implement to ensure employee compliance and safety.

Most importantly, you as an employer must take time and employ the necessary expertise to identify the hazards to which your employees are exposed, and then take steps to either eliminate the hazards or protect employees from them. Of almost the same level of importance is the need for you to acquaint yourself with all the state and federal standards that apply to the work you do and that dictate what state or federal OSHA and other regulatory agencies feel you need to do to provide your employees a safe place to work.

There is not enough space in one article to cover all the standards and the details involved that affect your business. This article will, however, acquaint you with two recent changes with regard to OSHA that will have a direct impact on how you approach safety and regulatory compliance.

National Emphasis Program and OSHA 300 Logs

A National Emphasis Program (NEP) started on October 1, 2009, to address recordkeeping. The program was put into effect because of concerns identified to OSHA with regard to under-reporting or misreporting of injuries and illnesses on OSHA 300 logs in the meat packing and poultry industries. Although it started with concerns there, the NEP is not limited to those industries—it affects all employers.

The importance of an NEP is not that new rules and regulations have been promulgated, but that OSHA is announcing that there are significant problems with employer compliance in areas covered by the NEP. By identifying those problems, OSHA has established probable cause to visit any employer and inspect its recordkeeping compliance. This NEP will last through September 30, 2010.

Your company may be visited by an OSHA compliance officer to conduct a compliance inspection for recordkeeping. If such a visit occurs, you want to be sure that your recordkeeping for OSHA 300 compliance is up to date. The following are a couple of suggestions to help ensure that you are in compliance with the OSHA 300 recordkeeping requirements.

  • An OSHA 300 must be maintained by any business that employs 11 or more employees in any calendar year. You are required to record all injuries and/or diseases that occur in the workplace that meet the recording criteria. While the level of detail required in the recordkeeping criteria exceeds the scope of this article, basically any injury or disease that results in lost time—even 1 day—or restricted duty of any kind must be recorded on the OSHA 300 log.
  • In addition, any injury requiring treatment beyond first aid must be recorded on the OSHA 300 log.

OSHA 300 recordkeeping requirements can be found in Title 29 of the Code of Federal Regulations § 1904. This is an easy standard to read. Many of the requirements are provided as responses to frequently asked questions by employers.

Be aware that OSHA 300 records must be kept up to date and readily available. The standard requires that you be able to produce these records to an OSHA compliance officer within 4 business hours of his or her request. It is suggested that you maintain OSHA 300 logs going back at least 5 years, if not longer.

From a company standpoint, the OSHA 300 log should be used to identify areas where additional safety measures may be needed within your business. A human resources or safety professional should regularly review the OSHA 300 log to determine trends of injuries and/or areas in your facility where injuries seem to occur most frequently. Those areas should be carefully reviewed and inspected to determine hazards that may not have been previously identified but that are causing injuries. After those hazards have been identified, steps should be taken to remove the hazards or to protect employees from them. This helps accomplish the basic tenet of safety: providing a place of employment free of any hazard likely to cause employees serious physical harm.

OSHA Repeat Citations

Another area where OSHA continues to place significant development efforts is the OSHA Field Operations Manual (FOM). The FOM is somewhat like a policy and procedures manual: It provides day-to-day guidance for OSHA compliance officers, area directors, and others in how they go about their tasks in enforcing OSHA standards, providing compliance assistance, and implementing and facilitating other OSHA programs such as the Voluntary Protection Programs. Although the FOM is not law, it has a tremendous impact on how you interface with OSHA.

On March 26, 2009, OSHA made several changes to the FOM. One recent change addresses OSHA repeat citations. OSHA can issue a repeat citation whenever they visit a company and observe a violation of a particular OSHA standard if they determine that violation is substantially similar or exactly the same as a previous citation that was affirmed or accepted by the employer and became a final order of OSHA. While the current penalty for a serious OSHA citation is from zero to $7,000, the penalty for a repeat citation is from zero to $70,000. While the $70,000 maximum penalty is seldom used, except in the most egregious circumstances, penalties for repeat citations can be significantly higher than those for a similar serious citation. For this reason, always be sure that not only do you correct any OSHA violations for which you have been found responsible, but you ensure the corrective action you have taken is maintained.

The change to the OSHA FOM was to advise the area directors and compliance officers that while repeat citations can be issued to employers who have an underlying violation in a federal OSHA state, a repeat citation cannot be based on an underlying citation issued in a state OSHA state. States are permitted to apply for permission to operate their own state OSHA programs. The only guideline for a state OSHA program is that it must be at least as strict as federal OSHA. California, for instance, has a state OSHA program that, in this writer’s opinion, is substantially stricter in all aspects than federal OSHA. Most states have programs that mirror the federal OSHA standards but do not necessarily follow federal procedures following an OSHA citation.

The new FOM policy is that citations issued against an employer in a state with an approved state OSHA program shall not be used by an OSHA compliance officer or area director in a federal OSHA jurisdiction as a basis for a repeat citation against that employer. But do not get too comfortable—the FOM does indicate that the facts of the state OSHA citation can still be used to demonstrate employer knowledge of a particular hazardous situation, which can be used to provide justification and support for a willful violation against the employer. Also, be aware that the reverse is not necessarily true; a state can use a federal OSHA citation as the basis for a repeat citation in the state.

General Duty Clause Citations

The other modification of note in the FOM concerns OSHA general duty clause citations. The OSHA general duty clause, which is Section 5(a)(1) of the Occupational Safety and Health Act of 1970, requires that every employer provide a place of employment free of recognized hazards that are causing or likely to cause death or serious physical harm. There has probably been more litigation concerning what constitutes a general duty clause violation than for any specific OSHA standard. Most of this litigation centers on the definition of a “recognized” hazard.

In a general duty clause citation, OSHA must demonstrate that the hazard observed by a compliance officer is known and/or recognized by the employer as a hazard. Such recognition can be established by demonstrating through interviews that management was aware of the hazard and recognized it as a safety hazard. A second way of demonstrating that the employer recognizes the hazard is to demonstrate that the employer’s industry recognizes the hazard. For example, if the subject is a general duty clause hazard for the power production industry, OSHA could try to demonstrate that the particular company recognized the hazardous situation or that the power production industry in general recognizes the hazardous situation.

Under the new modification to the FOM, OSHA has added a consideration for its compliance officers when evaluating employer recognition of a hazard. That new criteria is “common sense,” which is defined in Roget’s II The New Thesaurus as “the ability to make sensible decisions.” Merriam Webster’s Collegiate Dictionary, the Tenth Edition, defines common sense as “1: the unreflected opinions of ordinary people, 2: sound and prudent but often unsophisticated judgment.”

Having reviewed these definitions, it is still difficult to specify what OSHA will consider to be common sense for the purposes of determining hazard recognition. As frequently occurs, the new criteria for determining whether an employer has or has not recognized a particular hazard will most likely be the subject of much litigation until an acceptable definition for common sense is determined by either the Occupational Safety and Health Review Commission or the courts.

Coupled with the common sense recognition of a hazard, OSHA also has indicated that whether an employer has recognized a hazard may be determined by a review of electronic communications. OSHA may look at a company’s e-mails and other electronic records to see if hazards have been identified. This should put all employers on notice that they need to be more concerned about electronic communication. When a hazard is identified and communicated, corrective action must be taken immediately, even if the hazard is not the subject of a specific standard.

Safety Must Be a Priority

The preceding is an outline of just two areas in which OSHA has recently taken steps that can affect your business. Congress is considering significant legislation which, if passed in its present form, will significantly change the way we are impacted by OSHA. As of the writing of this article, all legislation is still pending in committee.

Employers are confronted with many workforce issues. They must be concerned with a cornucopia of federal laws that govern how to hire employees, how to discipline employees, how to treat employees with disabilities, etc. Perhaps the most important workforce issue is ensuring that employees are provided a place of employment that is free of hazards and that you treat safety as the number one priority of your business issues.

Other employment laws are important and can affect you because of actions you take against an employee, but most can be remedied by a change in personnel policies. Safety is an area where the failure to comply has effects far exceeding the cost of compliance, fines, or penalties. The impacts of an unsafe workplace go far beyond your costs of corrective action and/or fines and penalties because they include, in addition to the significant injuries that can occur to an employee, increases in insurance premiums, loss of efficiency, loss of quality, and loss of the ability to continue to operate your business.

It is a challenging time to be in any business. The economic tea leaves show signs of improvement, but significant challenges remain. With much of the nearly $800 billion in federal stimulus in the pipeline and the easing of unprecedented intervention by the Federal Reserve, the recession is over and the economy is growing again. Congress has now turned its attention to a portfolio of legislation that will forever change the landscape for American business, including historic changes to the nation’s health-care, financial, and energy-producing and -consuming industries. With so many balls in the air, these are extraordinary times for the insulation business.

Economic Recovery

The economic recovery is well underway, and the risk of a double-dip recession is fading. Businesses and consumers are becoming increasingly confident, and demand is rising in most segments of the economy. Headwinds remain, however.

In a traditional economic recovery, pent-up demand fuels consumer spending and home building. While the recovery is advancing, consumer spending, which accounts for 70 percent of the U.S. economy, is expected to remain muted compared to previous recoveries. As home prices have fallen, the cumulative net wealth of American households has been eroded. Coupled with high unemployment and tight credit conditions, U.S. consumers are unable to fuel the strong growth typical at this point in the business cycle. Consumers are busy paying down the massive debt accumulated during the past decade, and a trend toward thrift has replaced the consumerist mentality.

The Great Recession, as it is now being called, was triggered by a full-blown financial crisis, and history tells us that recoveries from recessions led by the financial sector are often prolonged and difficult. Further, the rapid acceleration of the national debt likely will translate into higher taxes in the future for individuals and businesses, which will restrain growth going forward.

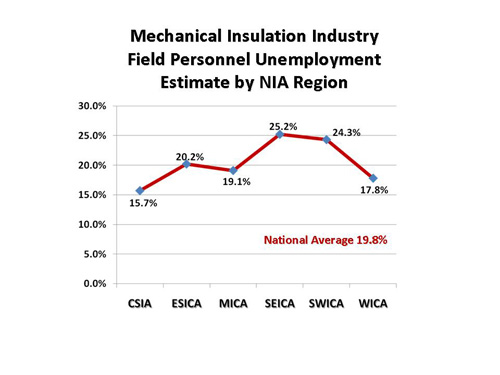
Most economists agree that the recession has been over for nearly a year, but job growth has been late to the party. Nonfarm employment flipped to a gain in January following 2 years of declines. Since the Great Recession officially began in December 2007, more than 8.4 million people lost their jobs, including 2.1 million construction workers out of work since construction employment peaked at 7.7 million in late 2005. This represents a decline of nearly 28 percent, the steepest decline in construction employment since the Great Depression. Those employed by drywall and insulation contractors have been especially hard hit. In mid-2006, more than 385,000 people were employed by these contractors. By early 2010, employment in this segment was down by 45 percent to 210,000 but started turning up in the spring.

Despite recent improvements in the economy, the Federal Reserve reported that lending standards remain tight, especially for small businesses and consumers. About a third of banks have increased interest rates or raised annual fees on new small business credit card accounts. Bankruptcies remain high, and the share of nonperforming loans continues to climb. Access to credit is likely to be constrained for some time to come, especially for small businesses. Businesses in the construction sector also face additional hurdles due to weak demand.

The value of total construction spending, which historically accounts for 7 percent of Gross Domestic Product (GDP), has fallen to levels not seen since 2003. The declines are even more pronounced when adjusted for inflation. The value of residential construction put in place has improved in recent months due to the tax credit but remains quite weak. Spending on nonresidential projects continues to decline, down by 25 percent compared to last spring. Spending on public construction projects, supported in part by the massive fiscal stimulus, continues to weaken because of sharply reduced tax revenues.

The outlook for construction is for a slow recovery with further declines likely in some segments. Looking at the architectural billings index, a leading indicator for construction and renovation activity, especially in the nonresidential sector, the latest data suggest that architects are becoming less pessimistic.

Residential Construction

Despite the surge of home sales that materialized in advance of the homebuyer tax credit expiration on April 30, the residential housing market remains weak. Sales of “distressed properties” (i.e., foreclosures and short sales) continue to represent more than a third of existing home sales. Foreclosures, especially in the lower price range, have attracted first-time homebuyers, who account for a large percentage of recent transactions. According to the National Association of Realtors, distressed properties sell for about 15 percent less than comparable properties, thus keeping downward pressure on home prices. The supply of distressed properties continues to grow as foreclosures remain high.

First American CoreLogic estimates that 11.3 million homeowners (1 out of 4) are “underwater”—that is, their mortgage balance exceeds the expected market value of their home. In contrast to the loan defaults that surged in 2008 from subprime borrowers running into trouble, the wave of recent defaults have been primarily among borrowers with safer loans who have become delinquent due to a job loss or other economic setback. Despite the loan modification program Congress authorized last year, relatively few homes have seen permanent modifications. As delinquencies and foreclosures continue to climb, lenders are overwhelmed and reluctant to repossess homes in the down market.

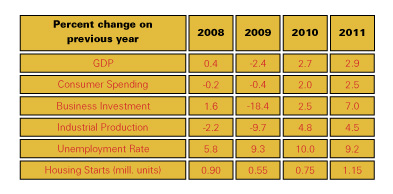
In addition, many homeowners who want to move but are in no immediate hurry are waiting on the sidelines to see if and when the market improves. By some estimates, this “shadow housing inventory” could be as high as 5 to 7 million. This suggests that home prices will stay weak for some time to come and that sales will remain subdued. Housing starts are expected to recover to 640,000 this year, up from 560,000 in 2009 but still just a fraction of the 2.1 million homes built in 2005. Housing starts are expected to rise above 1 million in 2011.

Nonresidential Construction

The outlook for nonresidential construction is also weak. Construction in the nonresidential sector is driven by several factors. A large segment follows residential construction patterns. For example, when new tracts are developed for housing, new shopping centers, commercial/office buildings, schools, etc. are built to serve the new neighborhood. As residential projects fell sharply starting in 2006, demand for this type of construction fell.

Hotel and office construction are tied to employment and business conditions, which are only now starting to turn around. Industrial and related commercial construction depend on capacity utilization rates and profits. Complicating matters, lead times for nonresidential projects are long, and many projects were underway when the financial sector started to melt down in 2008. As a result, there is a sizable overhang in many nonresidential segments that has yet to be fully absorbed.

REIS, a commercial real estate consultancy, reported that office vacancy rates rose to 17.2 percent nationally during the first quarter of 2010, a 15-year high. Vacancy rates at shopping centers and apartments also jumped to record highs. Due to the high vacancy rates, many commercial loans have become delinquent, and there is a risk that large-scale commercial defaults could destabilize the already fragile banks and undercut the recovery.

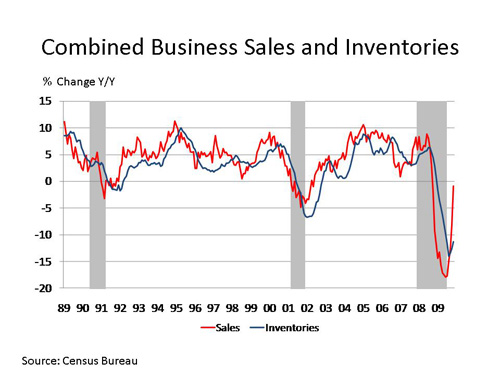
The manufacturing sector, however, continues to improve as inventory restocking has begun and the recovery is gaining traction. Capacity utilization is tightening and is now above 73 percent, compared to 69 percent a year ago. However, operating rates remain well below the high of 81 percent just prior to the recession. As markets for U.S. exports did well in 2009, and with the V-shaped recovery in manufacturing, profits have improved. This bodes well for manufacturing investment.

Public Construction

Construction funded by the public sector (public schools, roads, government buildings, and other infrastructure) has not yet seen the steep, double-digit declines other sectors have. This is in large part due to last year’s stimulus bill, which pumped money into this sector. As stimulus spending winds down, however, this sector, which depends entirely on tax revenue and bond issues, is declining. According to the Rockefeller Institute of Government, fourth quarter 2009 state tax collections continued to deteriorate, marking the fifth consecutive year-over-year decline. As state and local governments’ balance sheets worsen, financing becomes more expensive.

After a surge in 2008, prices for construction materials dropped sharply during 2009 as demand fell off a cliff. However, as demand for commodities strengthens, especially in emerging economies such as China and India, prices for construction inputs are again on the rise and ahead of core inflation. This could further curb new building across all sectors, especially in residential, where newly built homes are competing against the glut of existing homes.

Opportunities for Insulation

The Obama administration has made reducing the nation’s carbon emissions a top priority, and Congress is considering legislation that could fundamentally change the way the United States consumes energy. As a result, there is renewed focus on energy efficiency and energy conservation efforts throughout the economy.

From tax credits for homeowners who install insulation in their homes to the U.S. Army applying foam insulation on tents in Afghanistan, insulation is becoming an indispensable tool in the energy conservation arsenal. In the stimulus package passed last year, Congress authorized $13 billion to make federal buildings and public housing more efficient and to weatherize and insulate as many as 1 million homes. A new bill to spend another $6 billion was recently passed by the House to fund the “Cash for Caulkers” program, direct subsidies for homeowners to install insulation and make other energy efficiency improvements. Unlike the tax credit, which offers 30 percent of the cost up to $1,500, “Cash for Caulkers” offers direct rebates of up to $3,000 for specific energy efficiency improvements, including insulation.

And the manufacturing sector, which consumes more than 20 percent of the nation’s energy, may be getting in on the act. A bill introduced by Rep. Deborah Halvorson, a Democrat from Illinois’ 11th district, would provide generous tax incentives for industrial facilities to install mechanical insulation. If passed, savings to facilities could total $47 billion over 5 years and save 366 million metric tons of CO2 emissions, according to the National Insulation Association.

Health Care

The monumental health-care legislation signed in March makes some significant changes to the $2.5 trillion health-care system in the United States and will have a direct impact on employers and individuals alike. Some of the most significant provisions, however, will not take place until 2014.

In an effort to expand coverage to 32 million uninsured, the 2,457-page legislation contains far-reaching changes, including mandates that businesses with more than 50 employees provide health insurance for their employees. Nearly 90 percent of drywall and insulation contractor businesses fall into this category. Businesses with fewer than 25 employees may qualify for subsidies to help them afford the cost of health insurance. Small businesses, self-employed people, and those who do not get health insurance through their employers can have access to health insurance through the Small Business Health Options Programs (SHOPs). One of the goals of the legislation is to curb soaring health-care costs and extend coverage to those not currently covered. It remains to be seen, however, if this experiment will be successful.

There is much debate about the amount of new construction that will be required to serve the 32 million uninsured. Some suggest that new demand for medical offices and hospitals will result. Others counter that many of the uninsured are already receiving services via existing emergency rooms, and that reduced payments for Medicare and other cost-cutting may curb medical building investment.

The Insulation Industry’s Future

Compared to the construction sector in general, businesses engaged in insulation are relatively well advantaged, given the current emphasis on energy efficiency and conservation. As the recovery gains traction and households and businesses repair their balance sheets, underlying industry conditions will improve.

A turnaround in nonresidential construction will depend on the resumption of economic growth, profitability, and business activity. However, it may be years before the residential sector grows strongly again, and higher taxes from government debt accumulation and inflation are a concern. Uncertainties about how much health-care legislation will cost small businesses will also weigh on the minds of business owners.

Despite these concerns, insulation’s role in the nation’s investment priorities has been elevated—a very bright spot in an otherwise subdued outlook.

In my 45 years in the mechanical insulation industry, I have never experienced a year like 2009: the troubled economy, the change of administration, continued globalization, NIA and the industry going to Capitol Hill. It was a unique combination of circumstances.

The NIA World is not without its challenges, but it is uniquely positioned, with a future filled with opportunities. Each segment of the industry must approach 2010 and beyond with a unified vision, commitment, and involvement to make a difference and compete in an economy we have not experienced before. The opportunities are there; we need to go after them, not wait for them to come to us. The NIA World is abundant with experienced and proven leaders, financial and human resources, technology, and the foundation for making change. We need to harness those resources, work together, and make it happen.

The Economy

You can’t talk about the State of the Industry without including the economy. There seems to be some consensus in Washington that creating jobs is the primary short-term solution and reducing our debt is essential for the long term. There is consensus that no solution will take effect overnight. A slow but solid and sustainable recovery—much slower than we have experienced with similar economic downturns—is likely. How that recovery happens is where the opportunities and challenges present themselves.

Where does the mechanical insulation industry fit in the recovery cycle? The industry is historically one of the last sectors to feel the impact of a downturn and one of the last to reap the benefits of a recovery. With a slow recovery, the industry may only notice substantial benefits from a longer-term perspective versus year-over-year comparisons. However, some areas and certainly individual companies may enjoy bursts of recovery driven by project securement, mix of business among business segments, specific stimulus activities, and other unique or localized events.

Industry Unemployment Rate

The national unemployment rate varies daily; for the sake of this discussion, let us assume the unemployment rate is 10 percent. Based on recent analysis, the unemployment in the mechanical insulation industry is estimated to be almost double the national average.

The question is: can the industry regain the workforce when needed or will a shortage occur? That answer may depend on the rate of recovery, and significant geographical and company variances are likely.

It would be a mistake to assume the industry can easily regain the experienced and trained workforce that unfortunately has fallen prey to the economy. The need to focus on training remains of paramount importance. The difficulty is that in many companies, training is one of the first budget items cut in a slow economy and one of the last initiatives restored during recovery.

This dilemma affects all segments of the industry but has the greatest impact on contractors. Management is caught between current workload demands and longer-term expectations and confirmed backlog. If a contractor’s current workload is low but they have a reasonable backlog of work to begin in the near future, they have one attitude. However, if their current workload is low and the backlog is not promising in the short term, training may not be a priority. In simple terms it is the continual struggle between short-term earnings and long-term expectations. That struggle is further magnified with the margin pressure always created in a slow and unpredictable economy.

A contractor does not necessarily need trained and experienced workers to secure work, but they are certainly necessary to execute the work properly and profitably. Thus the concern: will the workforce be available when needed?

Moving the Industry Forward

The world in which the industry competes today is much different than 10 years ago or even 1 to 2 years ago. What has changed?

  • The economy and its projected slow recovery
  • The continual pressure on margins and the bottom line
  • The increased focus on energy efficiency
  • The increased focus on the environment
  • “Green” being found everywhere
  • The need to create jobs and the political environment driving those efforts
  • The lack of capital availability
  • The increased involvement of government in our business lives
  • The requests for stimulus initiatives and/or relief

These are just a few; many more items could be added. The question for our industry is: does all of this create opportunities or is it just another mind-boggling list of challenges?

Opportunity will not come to the industry on its own—we have to make it happen. Our industry needs to accept and embrace whatever hand the economy deals us, but we can positively influence the mechanical insulation industry’s role in that economy. We are in a position we have not experienced in decades. Mechanical insulation needs a voice.

Filling the Education Void

The greatest influence point for mechanical insulation is the mechanical engineer, architect, or facility owner. They ultimately decide what type insulation system will be used, the thicknesses, etc. But the mechanical insulation knowledge base of those individuals on a national basis is probably at an all-time low.

Compounding the problem, manufacturers—who have historically been the industry educators—have fewer feet on the street today. Many salespeople have limited knowledge or experience with mechanical insulation outside the products or systems they represent, and in many cases they are responsible for multiple market segments.

Whose responsibility is it to promote the benefits of mechanical insulation: the manufacturer, the distributor, or the contractor? Most in our industry would point to the manufacturer. In today’s economic and business environment, with the logistical challenges of meeting and spending quality time with specifiers, I am not sure that is true. It is the manufacturer’s responsibility to promote and specify their products or systems, but is it fair today to expect them to take on the overall marketing role, especially since they will be biased to their offerings, as they should be? Even if a manufacturer(s) did step up to fill that role, their efforts would probably not be accepted by their competitors.

The access to information via the internet is increasing every day. That is helping bridge the knowledge gap, but is it really educating decision makers? Many individuals depend on information from just a few websites, which could be scary based on a few of the sites I have visited.

The industry should assume the generic educator role and provide reliable resources to decision makers and people in the influence chain. Pooling resources would allow a much broader, in-depth, and focused approach that could be extremely effective and economical for all industry participants. Will industry participants promote, endorse, and support that approach with an industry association representing all industry segments generically? To successfully implement and execute such a strategy will require a long-term vision and most importantly a commitment to change.

Marketing Insulation Efficiency

The increased focus on energy efficiency and emission reduction is real. Yes, many talk the talk and do not walk the walk. But the topics have risen in importance from the individual homeowner to the corporate executive to the government legislator.

What is relevant today is mechanical insulation’s role in the energy efficiency and environment arena. Are we still considered the “Rodney Dangerfield” who gets no respect in the energy/emission reduction arena in the commercial and industrial markets? The industry has taken giant strides to change that image, but the journey has only begun.

Why is it the residential community and several specific products—lighting, windows, weatherization, and appliances—seem to get all the attention when it comes to government incentives for energy efficiency and national awareness? I believe it is a result of long-term presence on Capitol Hill.

Tax incentives or rebates seem to attract individuals faster than business, even though in some cases the return on investment, including consideration of the incentive, could be 10-15 years. Individuals feel they are contributing to resolving the energy dependency issue and environmental concerns facing our country while saving a few dollars. Yes, every little bit helps, but the area of greatest impact is in the commercial and industrial markets. If only Capitol Hill and others addressed those markets with the same intensity as the residential markets, the impact over a shorter time horizon would be substantial.

In the past, the mechanical insulation industry has done a less than effective job on Capitol Hill influencing legislation. Until NIA stepped up in February 2009, there was no one on the Hill solely focused on mechanical insulation. Other groups’ efforts included the mechanical segment in the commercial and industrial markets, but their primary focus was on other market segments.

Mechanical insulation is now getting its independent and generic voice on Capitol Hill, but there is a lot of ground to cover. What NIA has accomplished in its Capitol Hill Initiative in a year is amazing (see “Mechanical Insulation Marketing Initiative 2009 Activities and Accomplishments“). The problem, and opportunity, is that we must go 100 mph while established industries have been going 20 mph for many years. We are definitely in the race and gaining ground, but it is a long race without a defined finish line.

Marketing mechanical insulation is not easy. Contractors are focused on being perceived low bidder, so recommending an upgrade of any type in the bidding process can be problematic. If they are not actually or perceived to be one of the low bidders, they may never get invited to the next round.

Manufacturers and distributors are focused on their specific product offerings and trying to differentiate their product or system from the crowd, i.e., be the product of choice.
In all that, especially in today’s economy, where does anyone focus on marketing mechanical insulation versus other energy efficiency and emission reduction initiatives?

Competing with energy efficiency alternatives and competing for maintenance capital dollars are areas the industry as a whole has yet to totally embrace and address. We are still focused on competing among ourselves. The industry needs to tell its story and draw comparisons to other initiatives, talk about the impact mechanical insulation can have with a specific application and holistic approach over time, and provide the tools to all channel participants to market the benefits of mechanical insulation.

The industry needs to educate specifiers and owners about the latest guidelines and regulations. Many specifications and value-engineered alternatives do not meet current standards. It appears the American Society of Heating, Refrigerating, and Air-Conditioning Engineers (ASHRAE) may adopt new pipe insulation guidelines that increase insulation values on all but chilled water applications. If those guidelines are adopted later this year, the industry should become the primary marketer. What a great way to increase your business and be a meaningful resource to your customer and to their customer.

Currently, the U.S. Green Building Council’s LEED program requires that insulation must at a minimum meet ASHRAE 90.1 recommendations. How many LEED buildings do you know that do not meet that criteria? Do you know what the ASHRAE or other regulatory, code, or governing body minimums are? How do those minimums measure up to federal, state, or local energy efficiency goals? Helping your customer ensure they are in compliance and/or contributing to established goals is a great sales approach.

Retrofit and Maintenance Opportunities

The focus on retrofit, full or partial, of commercial and multifamily buildings has never been greater. That focus is being driven by the need for immediate job creation while delivering long-term energy efficiency and environmental improvements. Where does mechanical insulation fit in that opportunity? Recently, I heard several industry participants indicate building retrofits were of limited benefit to them and the industry. I disagree. With every renovation, large or small, the opportunity is there. We need to educate all channel participants about the potential and return on their investment by examining the potential of upgrading or repairing mechanical insulation in the overall retrofit plan.

Maintenance opportunities are available in just about every facility where the insulation system is exposed to the environment and personnel contact. Unfortunately, in a soft economy maintenance is one of the first initiatives cut back or in some cases virtually eliminated. What a mistake for so many reasons, including energy costs, emission reduction, personnel safety, corrosion under insulation, and regulatory or code concerns. From a long-term cost perspective, the facility owners may end up spending many times more money than the cost of an annual maintenance program. The industry needs to tell that story to top management with illustrations and examples. Insulation maintenance is an investment that can pay for itself—it should not be considered sunken cost or a problem that can always be addressed later.

Implementing and maintaining an aggressive, meaningful, and sustainable marketing campaign in today’s economy is not easy given bottom line and capital demands. But it is necessary if the industry wants to influence growth. The industry’s time to make a difference and influence the increased use of mechanical insulation is NOW. But we must compete in a new arena against energy efficiency and emission reduction alternatives, process improvements, and other maintenance initiatives. We must embrace that change of focus and be aggressive in our efforts without abandoning our traditional values.

Industry Demographics

The demographics of the mechanical insulation industry pose both an opportunity and a challenge. The number of manufacturers is relatively small, 100 to 150. There are probably 150 to 200 distributors (but the number of distributor locations is probably more than 1,000). The contractor count is the staggering number: potentially 3,000 to 5,000—maybe more. To the best of my knowledge there are no official published statistics. Regardless, this type of industry profile is not unusual among construction-related fields, nor is the ratio of organized versus unorganized labor contracting or the influence of large versus small businesses. Also common is what I call the “Church Profile”: some step up and sit in the front rows while the majority sit in the back and seldom get involved or never go to church at all.

The Church Profile is challenging in a slow economy, especially when the opportunities are abundant. More need to come to church, more need to move up a few rows, and the front row participants need to stay put. Or said another way, more companies and individuals need to get involved, and the leaders, large and small, need to set examples for others. Now is the time for the industry to come together in a unified voice across the country.

Government Incentives

The industry is pursuing tax incentives for maintenance and for going beyond minimum ASHRAE levels in new construction and retrofit applications, as well as a job creation rebate program in retrofit applications. The industry is going where it has never gone before in pursuit of these incentives. When enacted, the industry must step up and market these incentives, or these efforts will fall by the wayside.

I recently sat in on an hour presentation on the advantages of a lighting system and the potential return on investment. Over half the presentation was demonstrating how the tax incentive would reduce cost and increase the return on investment. Using government incentives to lower the net cost and improve the return on investment is a marketing approach we should embrace. Government incentives should be designed to draw the attention of the user of a particular product or service, and the use of those products/services should be of benefit to the economy and our country. Wow, does mechanical insulation fit that definition.

The mechanical insulation industry has never had the benefit of federal tax or other incentives. Now is our time: H.R. 4296, the Mechanical Insulation Installation Incentive Act of 2009, can help make that objective become a reality.

The Bottom Line

The NIA World is not without its challenges, and 2010 will certainly provide many, but the future is filled with opportunities. Each segment of the industry must approach 2010 and beyond with a unified vision, involvement, and commitment to make a difference.

The foundation for change is in place. We need to harness our resources, work together, and make it happen. This is an exciting and challenging time for our industry. We have overcome rough economic times in the past, and we will again. The NIA World has always been a good place, and the future will only strengthen the industry’s foundation and secure the future for many generations to come. Now is our time.

Figure 1

Mechanical Insulation Industry Employment Estimate by NIA Region

Figure 2

Mechanical Insulation Industry Field Personnel Unemployment Estimate by NIA Region

Figure 3

Mechanical Insulation Industry Employment Estimate by Segment

To say that 2009 was a challenging year would be a gross understatement. As the economy begins to emerge from the worst recession since the Great Depression, all signs point to a recovery in progress. It is likely that the economy emerged from recession during the summer months when the vicious cycle of spending reductions, layoffs, and shut-downs gave way to a virtuous cycle of increased spending, hiring, and production.

Since then, it has followed a V-shaped growth trajectory; however, the weak consumer sector and continued high unemployment are likely to weigh down the recovery. Consumers are working to pay down debt and have become cautious in their spending. They have reduced their debt levels, but this deleveraging process is likely to be ongoing for the next several years, with one in five homeowners underwater (owing more on their mortgage balance than their home is worth). And as foreclosures continue to rise, inventories of so-called “distressed properties” will put downward pressure on home prices. Still, high housing inventories plus high levels of unemployment and credit constraints will keep new homebuilding at low levels in 2010.

The collapse in home values and high unemployment have boosted the savings rate from 2.7 percent in 2008 to 4.6 percent in 2009. As a result, consumer spending, traditionally the backbone of the economy, fell for the first time since 1938 by 0.4 percent in 2009 and will remain anemic, growing by 2.0 percent in 2010 and 2.5 percent in 2011. And a cultural shift towards thrift seems to be emerging, though the United States will remain the world’s largest consumer. As economic conditions and confidence improve, business investment will recover, growing 2.5 percent in 2010 before accelerating 7.5 percent in 2011.

The federal stimulus package and growth in U.S. exports mitigated the downturn and have helped stimulate the recovery. The emerging economies, in particular Brazil, China, and India, resumed strong growth quickly after the financial crisis. These economies resumed purchases of U.S. goods, providing some support for the beleaguered manufacturing sector.

The American Recovery and Reinvestment Act, the massive stimulus package enacted in 2009, was designed to inject $787 billion into the U.S. economy through a combination of tax benefits, entitlement spending, and direct spending. By the end of 2009, about one-third of that amount had been spent. The bulk of the remaining stimulus is expected to be spent in 2010, with smaller amounts in 2011 and beyond.

The administration claims nearly 600,000 jobs have been created or saved as a direct result of the stimulus package. In addition to creating jobs, many components of the stimulus package were designed to improve energy efficiency. The stimulus package provided $32.7 billion in energy-related grants. Of this, $8 billion is destined for weatherization assistance and grants to states to improve energy efficiency. This has obvious positive implications for the insulation industry.

The downturn in residential construction appears to have reached a bottom, though housing starts remain at a fraction of their 2006 peak. It is hard for homebuilders to compete with the fire-sale prices of many existing homes on the market. Housing starts are expected to reach 750,000 in 2010 before recovering further to 1.15 million in 2011.

In a reversal of the trend of the past several years, the outlook for nonresidential construction is weaker than that of the residential sector. In the industrial sector, construction is tied to capacity utilization rates still recovering from historic lows. Commercial construction follows residential construction, which has fallen sharply. Public construction spending has been buoyed by federal stimulus; however, many public spending projects rely on state and local tax revenue, which has fallen sharply due to the recession. Nonresidential construction spending is expected to fall 15.0 percent in 2010 following an 11.0 percent decline in 2009.

Industrial Outlook

In 2009, as the financial meltdown cascaded, panicked businesses and consumers held back spending starting in the fourth quarter of 2008. As demand fell sharply and synchronously, inventories surged throughout the supply chain. Thus, throughout the first half of 2009, a massive $160 billion inventory liquidation took place and production fell.

Industrial production reached a bottom in June 2009 and has been improving since. The inventory destocking has slowed, and moving into 2010, firms are now running on extremely lean inventories. As firms rebuild inventories across the supply chain, manufacturing production, which first turned around in the summer, continues to advance strongly. Leading indicators of manufacturing activity are pointing to further improvements in demand.

Although projected growth rates for most industries appear positive in 2010, they must be seen in the context of the exceptionally sharp declines seen in 2008 and continuing into 2009. Moreover, it may take years for activity to recover from these steep declines and reach past peaks.

Chemicals

For the business of chemistry in the United States, the steep and sudden drop in spending caused massive inventory imbalances going into 2009. Demand for many chemistry-intensive goods (light vehicles, construction goods, appliances, furniture, carpeting, etc.) plunged. Much of 2009 has been spent working these inventories down. As a result, chemical production was weak. Chemical industry output (excluding pharmaceuticals) will grow at a 3.0 percent pace in 2010, strengthening basic chemicals, and specialties will strengthen to 3.3 percent in 2011 as the industrial recovery deepens.

Food Processing

During the recession, even the food processing industry posted declines. Food output fell by 0.4 percent in 2009, while the beverage segment fell 2.5 percent. Many strapped consumers worked to cut their food bills by shifting consumption to lower quality foods, buying in bulk, and purchasing fewer convenience foods. As the employment situation (and subsequently incomes) improves, food processing will continue to grow slowly.

Pulp and Paper

The pulp and paper industry was already in trouble before the recession hit. The rise in electronic media and paperless transactions have curbed demand for many paper grades. Paperboard, on the other hand, is tied to packaging and shipping. As manufacturing has moved abroad, so has some paperboard demand. Counteracting that trend somewhat is the rise in paperboard for shipping containers used to deliver consumer goods ordered through the internet.

Both segments were hit hard by the recession, which caused paper production to tumble 13.2 percent and paperboard to fall by 8.3 percent. Paper and paperboard production is expected to continue to soften in 2010 by another 2.5 percent before resuming growth in 2011 as the underlying downward trends offset gains in demand as the economy recovers.

Petroleum Refining

At the height of the commodities boom in 2008, crude oil peaked over $140 per barrel and gasoline rose above $4.00 per gallon. As a result, consumption fell sharply. Following the financial meltdown and subsequent sharp contraction in economic output, petroleum demand declined further. In 2009, refinery output of finished gasoline fell 16.2 percent to 1.3 billion barrels. Refinery operating capacity utilization fell from 84.9 percent in 2008 to 83.4 percent in 2009, the lowest level in more than 20 years. Going into 2010, inventories of refinery products remain high and demand remains weak as the recovery slowly gains traction.

Gas Processing

Despite the recession, which curbed industrial demand for natural gas, production of the vital fuel rose as new shale deposits were developed. According to the U.S. Energy Information Administration (EIA), marketed production of natural gas grew 3.6 percent to 60.2 billion cubic feet (BCF) per day in 2009. When gas prices were relatively high during 2007–2008, investment in gas drilling boomed. Production is expected to ease back to 58.4 BCF per day in 2010 as investment weakened during the recession.

Over the past few years, natural gas production has increased substantially following the development of domestic shale gas resources. These new shale gas deposits have huge potential and have generated a lot of interest, especially as the nation considers sweeping energy and climate change legislation. Natural gas emits about half the carbon dioxide of coal, making it an attractive option to reduce greenhouse gas emissions. Advances in drilling technology have expanded gas production, but concerns have been raised about potential ground water contamination from hydraulic fracturing. Continued development of shale gas will require new investments in gas processing facilities and pipeline infrastructure.

Shipbuilding

The short-term outlook for shipbuilding is poor. Following a historic downturn in trade following the financial crisis in September 2008 and the steep global recession that followed, global trade volumes dropped more than 60 percent year-to-year at their lowest point in January 2009. As the emerging economies quickly recovered, trade volumes bounced back during the second half of 2009. The International Monetary Fund expects trade volumes to rebound by 5.8 percent in 2010 and 6.3 percent in 2011. But order books remain lean, at least in the United States. In China, however, shipbuilding is expected to expand, as the Chinese government has provided preferred interest rates and other stimulus measures to boost Chinese shipbuilding.

Summary

The U.S. economy has taken a hard hit over the past 2 years but is on the mend. The strong rebound seen thus far has been largely the result of the stimulus package, exports, and the end of the inventory restocking and the subsequent rebuilding of business inventories as demand strengthens across the supply chain.

The headwinds of persistent unemployment and continued turmoil in the housing market remain, however. Resolution of the housing crisis and the credit crisis must precede any broad-based recovery. Barring any unforeseen jolts to the economy, we anticipate GDP to grow by 2.7 percent in 2010 before strengthening further to 2.9 percent in 2011.

Forecasting at this stage of the business cycle involves considerable uncertainty. Most indicators point to continued recovery. Following the inevitable inventory rebuild, however, the durability of the recovery is in question. While we do not anticipate a double-dip recession, the continued weakness in the housing and consumer sectors make a strong recovery along the lines of the emerging economies unlikely in the United States.

Recovery from recessions following financial crises tend to be long and protracted, and this time appears to be no different. There are several risks to the outlook, any one of which could derail the fragile recovery. These include terrorism, sovereign debt defaults (especially in eastern and central Europe), an extension of the credit crisis to regional banks from defaults in commercial real estate, and fiscal imbalances and an increasing likelihood of a dollar crisis.

Figure 1

Economic Indicator Changes from Previous Year

Figure 2

Housing Starts and Building Permits

Figure 3

Combined Business Sales and Inventories

In February 2009, the National Insulation Association (NIA) began efforts to expand awareness and support for increased use of mechanical insulation technology. Mechanical insulation has the potential to save over $4.8 billion in energy costs and 43 million metric tons of carbon dioxide emissions, as well as create 89,000 green jobs per year in maintenance applications and simply going beyond the minimum current ASHRAE guidelines in new construction and retrofit applications.

In May 2009 NIA joined in an unprecedented alliance with the International Association of Heat and Frost Insulators and Allied Workers (International) to advocate for a public-private partnership to establish a national education and awareness program. Together, they are committed to working with Congress, the administration, federal and state agencies, industry trade organizations, and other stakeholder groups on this and other initiatives that will lead to greater energy efficiency and a cleaner environment nationwide.

By working to boost building and industrial energy efficiency, initiatives championed under the direction of NIA’s Foundation for Education, Training, and Industry Advancement and its Mechanical Insulation Marketing Initiative (MIMI) will increase energy savings, reduce emissions, and create sustainable green jobs.

The primary Capitol Hill objectives are:

  1. Secure funding to launch, execute, and manage a multiple-year national education and awareness campaign.
  2. Secure a tax incentive for mechanical insulation in the commercial and industrial markets’ new construction, retrofit, and maintenance segments.
  3. Raise the bar on codes and standards, including enforcement.

Many activities and accomplishments took place in 2009, including:

  • Conducted nearly 100 meetings on Capitol Hill. An additional 30 meetings have occurred in the first quarter of 2010.
  • Delivered 19,000 letters from NIA member companies and International members to Capitol Hill in support of the NIA/International initiatives. An additional 60,000 have been delivered in the first quarter of 2010.
  • Worked with Rep. Deborah Halvorson (D-IL) as she introduced a resolution for mechanical insulation in the House of Representatives.
  • Worked with Rep. Halvorson as a champion for mechanical insulation and in drafting language that was included in the House of Representatives’ Waxman-Markey energy bill to authorize $3.5 million a year for 5 years to enact a mechanical insulation education and awareness campaign.
  • Worked to designate $500,000 in the FY 2010 Energy and Water Development Appropriations Bill to jump-start the national education and awareness campaign.
  • Worked with Rep. Halvorson to introduce legislation creating a tax deduction to incentivize increased mechanical insulation use and maintenance (H.R. 4296, the Mechanical Insulation Installation Incentive Act of 2009), and continue to work with House Ways and Means and Senate Finance Committee staff and others to explore its possible inclusion in an energy or jobs bill in 2010.
  • Met with Cathy Zoi, Assistant Secretary for Energy Efficiency and Renewable Energy, and her top staff, in pursuit of a partnership with the Department of Energy.
  • Met with governors and state energy directors (KY, MT, NJ, OH, WA, and WV) to explore the best approach to ultimately take our campaign directly to the states.
  • Established contact with governmental affairs representatives of allied organizations (ASHRAE, ACEEE, NASEO, NAIMA, NRDC) and conducted four webinars to educate members of NIA and the International on our legislative activities and asks.
  • Executed a grassroots letter-writing campaign to bolster the tax incentive legislation promoting mechanical insulation.
  • Conducted presentations on our joint legislative initiative to the International’s annual convention.
  • Worked with a coalition of 27 organizations to make a recommendation for federal stimulus activities in the manufacturing sector, which included suggestions for $1 billion in grants for mechanical insulation upgrade and maintenance activities.
  • Finalized the DOE Industrial Technologies Program (ITP) Save Energy Now data and other new construction estimates related to “Going Beyond the Minimums.”
  • Joined the DOE’s Zero-Energy Commercial Buildings Consortium.
  • Met with the DOE ITP to present an overview of the proposed national education and awareness campaign.
  • Began developing a data-gathering process for information related to mechanical insulation in the commercial building sector.
  • Began work on potential inclusion of mechanical insulation in a jobs bill. Those efforts have since secured mechanical insulation’s place in the Building STAR program, which is supported and endorsed by over 60 organizations and companies and is part of the “Rebuilding America” campaign.
  • Met with the Thermal Insulation Association of Canada to discuss mutual opportunities and how NIA could help them achieve the same type of awareness campaign.
  • Provided ongoing Insulation Awareness and Insulation Energy Appraisal Program classes to 192 contractors and individuals.
  • Provided 44 mechanical insulation awareness presentations to 1,687 mechanical contractors and engineers, specifiers, facility maintenance managers, etc.

In 2010, NIA and the International continue to push forward with these initiatives, including a March 2010 congressional briefing on insulation before the House of Representatives, thanks to the outreach efforts with the Congressional High Performance Building Caucus.

All these activities are supported by the contributions of NIA’s Foundation supporters. If you are not already a supporter, consider becoming one. Whether you are a small company considering $1,000 or a very large company considering $100,000, your contribution will make a difference and give you a voice. For a contractor employing two or three people, $1,000 a year is a lot of money—but that $1,000 buys you a seat at the table. If you are a large company, you have always been expected to lead by example, and you stand to gain proportionally in the rewards. Yes, you may always feel you are contributing a larger share while others sit on the sidelines contributing little, if any. Take pride in being a leader and tell the world of your leadership role.

The fact remains that nothing will happen without industry support, whether it is financial or human resources, volunteerism, or just taking the time to contribute your views and support when asked and needed. Everyone can make a difference—one vote matters, and you can have your voice heard without attending every meeting. Commit, get involved, and help the industry gain its rightful place at the table and increase the opportunities to motivate industry growth.