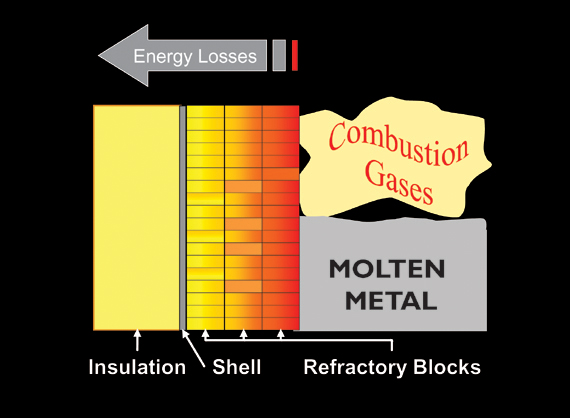
Refractory has always been an integral part of steam-generating boilers. In the steam-generating industry, refractory materials are used for filling gaps and openings to help keep the fire inside the fire box, for lining ash hoppers (wet and dry) that collect ash and slag, and for the protection of lower furnace wall tubes inside fluidized bed, cyclone-fired, or refuse-derived fired boilers.
Because refractory is one of the smallest components on a steam-generating boiler, it lacks the attention it deserves. And yet, it has been proven that when properly designed and installed, refractory can save up to five to seven percent of fuel costs (oil, gas, coal, or refuse).
- The primary cause of boiler inefficiency, and a major contributor to boiler shut-downs, is refractory failure. Discovering why a refractory material fails is a complex problem because failure is not caused by just one factor, but rather a combination of the following factors:
- The material selected does not match the environment that exists (i.e., reducing atmosphere);
- The material selected does not match the fuel being burned (i.e., the amount of alkali, sulfur, hydrocarbons, vanadium, or moisture present in the fuel);
- The material was improperly stored, mixed, installed, cured, and/or dried;
- The material selected did not match the environment created after the burning of the fuel (i.e., ash and slag).
It is helpful to understand the materials that could impact a refractory product (excluding installation) in order to fully understand the failure itself.
A Look at Materials—Failure in the Making?
Slag can reduce furnace heat absorption, raise exit gas temperatures, increase attemperator spray-flow temperature, and interfere with ash removal or equipment operation. Slag is the formation of molten ash that is either partially fused or re-solidified ash deposits (ash fusion), formed based on the ash temperature and composition.
For slag to adhere to a surface and form deposits, the ash particles must have a viscosity low enough to wet the surface. If iron is present, it will raise all four values of ash fusion temperatures (initial deformation, softening, hemispherical, and fluid). The greater the iron content found in the ash, the greater the difference in ash fusibility between the oxidizing and the reducing condition.
There are two kinds of ash. Coal ash is the residual product left after burning of the fuel. Oil ash is the residual product left after burning off oil. Coal ash that has a low fusion point and high basic oxide content can be very corrosive to refractory materials; and oil ash that contains vanadium, sulfur, alkalis, and hydrocarbons can cause severe problems to refractory materials.
Vanadium can act as a catalyst, forming a low-melting alkali-silica compound that could react and break down the basic components of a refractory material.
Sulfur can combine with lime and iron oxides found in some refractory materials and can reduce material strength. In the presence of moisture, sulfur also could form sulfurous and sulfuric acids, which could react with the basic components of a refractory material.
Alkali such as sodium (Na) and potassium (K) can chemically react with silica found in some refractory materials.
Hydrocarbons, in conjunction with a reducing atmosphere (which refers to the amount of air required for proper fuel combustion and is usually added to the combustion process in another location), can react with iron oxides and form large carbon deposits in the refractory material. This eventually could cause a spall (loss of fragments or pieces) on the refractory surface.
Finding the Root Cause of a Refractory Failure
Step 1: Discovery Process
It is necessary to collect and document some basic information. In many cases, the discovery process requires interviews with plant and installation personnel. These professionals know first-hand about the refractory process. The following information should be identified and documented:
- Material samples and data sheets of the existing brick or refractory lining—this information may be supplied by the purchasing agent or by the plant engineer;
- Material samples of the ash clinkers and slag—samples may be supplied by maintenance or engineering personnel from the plant;
- Chemical analysis of the fuel being burned (coal, startup oil, refuse, wood, steel, aluminum, etc.)—this information may be supplied by the plant engineer;
- Storage location and duration of the storage prior to installation—this may be supplied by the plant or the installation contractor;
- Manufacture date of the refractory material—this information may be supplied by the refractory manufacturer;
- Ambient condition at the time of the installation—this should be supplied/verified by both the plant personnel and the installation contractor;
- How much material was installed—this information may be supplied by plant personnel and/or the installation contractor;
- How it was installed or applied (pneumatically, toweled, poured, shotcrete, etc.)—this may be supplied by the plant or the installation contractor; and
- How the material was cured and/or dried and what procedures were followed—this information may be supplied by the plant and/or the installation contractor.
Step 2: Examine the Existing Material and Testing
The existing material (or the lack thereof) should be examined for signs that may indicate the root cause of the failure. When looking at an existing refractory lining or photos of the existing lining, keep in mind the following questions:
- Did the material fail due to thermal shock (large sections of the top surface area sheared away)?
- Is there any evidence that the materials had been exposed to excessive temperatures (excessive shrinkage, glazing, etc.)?
- Is there any evidence of mechanical abuse (broken and jagged edges or holes)?
- Did the material fail due to the operation of the equipment, furnace, or boiler?
- Was the refractory material installed improperly (i.e., porous or popcorn-like texture)?
Collecting Samples for Testing: Samples of the existing refractory material should be gathered and sent out for a cold crush test, which will verify the strength of the installed material. The results can be compared to the manufacturer’s material data sheets. If the strength of the existing installed material is low, it is probable that the mix was too wet when installed.
Samples of the existing slag and ash clinkers should be gathered and sent out for chemical analysis. The slag samples should also have a pyrometric cone equivalent (PCE) test performed to verify the minimum temperature that the refractory may have been exposed to.
Step 3: Calculate the Base-to-Acid Ratio
The next step is to document the environment to which the refractory material was exposed. One way to do this is by calculating the base-to-acid ratio (b/a), using values taken from the information received from the chemical analysis test mentioned in Step 2. This b/a value will give a starting point as to what type of refractory material should have been chosen.
Here is one way to calculate the base-to-acid ratio:
When the base-to-acid ratio is less than or equal to .25, it indicates an acid condition. An acid condition would indicate that a SiO2 type refractory should be considered.
When the base-to-acid ratio is greater than .25 but less than .75, it indicates a neutral condition. A neutral condition would indicate that an Al2O3, SiC, or chrome type refractory material should be considered.
When the base-to-acid ratio is greater than or equal to .75, it indicates a basic condition. A basic condition would indicate that an MgO or Dolomite type refractory material would be considered.
Step 4: The Review Process
Now it is time to analyze all the information gathered in Steps 1 and 2. All of the service conditions must be reviewed and analyzed thoroughly in order to see how they could affect the installed/failed material. This includes the fuel or raw materials being burned, startup fuel used, ash and slag content, gas temperatures, and plant operations and procedures. For example:
- Moisture content in the fuel can affect the refractory material. High moisture content or combined moisture content in the fuel with a reducing atmosphere can cause a separation of silicon carbide base materials (grain). This separation can occur when the total percentage of the moisture content found in the fuel is greater than fifteen percent, or when the combined total percentage of the moisture content in the coal and the reducing atmosphere percentage are greater than fifteen percent.
- Certain amounts of chemicals (iron oxide, potassium, or sulfur) found in the fuel, slag, or ash could react with cements (calcium-aluminate) that are present in a cement-bonded type refractory, especially if a reducing atmosphere is present.
- Certain startup fuel (i.e., #6 oil) may contain vanadium, which could react with the silica and lime in the cement found in a cement-bonded-type refractory. When vanadium is present, it can cause a chemical attack and surface failure, or cause a complete refractory failure (no refractory present).
Step 5: Review of Installation Procedures
The final analysis also must take into account proper installation procedures. All of the items listed below could prevent a refractory material from reaching its proper strength. A refractory material that is not able to reach its designed strength has the highest potential for failure.
Properly Manufacture Date and Storage: Refractory material should be manufactured in the proper time period based on the installation date and manufacture date. One year is recommended for a cement-bonded material used for conventional seals inside boilers, and three months or less for materials used in high temperature and abrasion areas such as those found inside fluidized bed boilers, cyclone fire boilers, or wet bottom ash hoppers. Refractory material always should be stored in dry, well-ventilated conditions. Use fresh refractory materials and follow proper storage procedures to ensure that the refractory will not lose strength.
Proper Water for Mixing: Many common industrial compounds can easily contaminate a refractory mix and seriously affect its strength. Certain salts can react with the refractory cement to make the material almost useless. It is recommended by most refractory manufactures that potable water (suitable for drinking) should be used for mixing. The use of the wrong type of water (e.g., river water) will hinder the ability of the refractory material to reach its proper strength.
Equipment and Pot Life: Using the right type of mixer, following proper mixing procedures, and being aware of the materials’ pot life also must be considered. Using the wrong mixer or pneumatic gun also could impact the strength of the refractory material. For example:
- Many pneumatically applied refractory materials require the material to be pre-wetted prior to the actual mixing and installation. If the installing contractor had used a continuous feed mixer (i.e., one that adds dry material into a hopper and the water is added only at the nozzle), the material could not be pre-wetted do to the nature or characteristics of using a continuous feed mixer. This could reduce the strength of the installed material.
- Every refractory material has a pot life, which designates how long a mixed refractory material can be used after mixing. Failure to follow recommended pot life times could result in a refractory material not reaching its proper strength. If the pneumatic installation of the refractory is interrupted for a period of time longer than the recommended “pot life” time period, the material found in the mixer and hoses should be discarded and not re-used.
Ambient Conditions: Cold or hot weather could adversely affect the strength of a refractory material. It is recommended by most refractory manufacturers that the final mix temperature should be in a specific range. Though they all differ slightly, it is recommended that the final mix temperature should be in a range of 40° to 90° F. It is also very important to protect the installed materials from freezing for a minimum of forty-eight hours or until thoroughly dried. Failure to take into consideration the ambient conditions at the time of installation could impact the ability of the refractory material to reach its proper strength.
The following formula is one way to estimate/adjust the variables relative to mixing a refractory material (e.g., water temperature, air temperature, storage temperature):
X=[(W * T) + .22 (Wc * Ts)] / (W+.22Wc)
W = weight of water (a quart of water weighs 2.08 pounds)
Wc = weight of dry refractory
T = temperature of water (degrees F)
Ts = temperature of solids (degrees F)
X = temperature of mixed refractory (degrees F)
Using the above formula and knowing the ambient conditions at the time of installation can help determine if the installed material was adversely affected by the ambient conditions.
Curing Procedures: Only after the refractory material has been cured and/or dried will it be at its proper strength. Almost all refractory materials (except those that are phosphate-bonded) must be cured prior to the drying process. Failure to properly cure a cement-bonded refractory material is the number one contributor to refractory failure and lack of longevity. Curing allows the chemical action to take place inside the refractory and helps ensure that the refractory can reach its maximum strength when properly dried. It is recommended that the surface of the refractory be kept moist (curing compound, wet canvas bags, or spraying water) or the surrounding atmosphere humid for a period of at least twenty-four hours.
Drying Procedures: The dry-out or bake-out of the refractory will take place after the curing period and removes all mechanical and chemical water left in the installed material. It allows the refractory material to reach its proper strength. Unlike the curing of refractory, which is done right after the installation (usually by the installing contractor), the dry-out can be completed any time. This does not apply to phosphate-bonded refractory materials, however, as a phosphate-bonded material must be cured and dried at the same time. A phosphate-bonded material must be dried within the first two to three weeks after installation because such a material will begin to absorb moisture from the surrounding atmosphere. Eventually, over a period of two or three weeks, the material will begin to slump and fall off.
New lining should be heated gradually to let the moisture escape and reduce internal stresses. The rule of thumb is to base the hold time on the thickness of the thickest area of refractory lining found on the entire work project. For example, if the thickest area is four inches thick, the hold time is four hours.
The following heating schedule is of a general nature for ideal conditions for a one-inch-thick refractory lining on fluidized bed furnace walls:
- Raise temperature at 75°F per hour to 250° to 400°F range. Hold for two hours at 250° to 400°F
- Raise temperature at 75°F per hour to 600° to 800°F. Hold for two hours
- Raise temperature at 75°F per hour to 1,050° to 1,200°F. Hold for two hours
- Raise temperature at 75°F per hour to operating temperature
In many applications, conservative heating rates can be followed without great penalty; but in some cases, such rates are uneconomical from a production standpoint. Each material has its own allowable deviation for conservative heating schedules. Check with the refractory manufacturer or refractory expert for a compromise between safe heating rates and operating costs. Following improper dry-out procedures can have the following adverse effects upon the refractory: It will never reach its maximum strength, and it will contribute to a spall at the refractory surface.
Know Your Quantities: Finally, to help ensure that the refractory material is not installed too thickly or too sparsely, it is important to know the quantity of material required for proper installation. This quantity then can be compared to the amount that was installed. For example:
- Insufficient material installed on the lower furnace walls inside a fluidized bed boiler could contribute to excessive stud and tube wall failure.
- Excessive material installed on the lower furnace walls inside a fluidized bed boiler in conjunction with not following proper curing and/or drying procedures could contribute to a complete refractory material failure.
Final Analysis
Finding the root cause of a refractory material failure must take into account many different factors, such as material selection and manufacture date, plant operations, material storage, mixing, installation, curing, and drying. Only by understanding all aspects pertaining to the design and installation of the refractory material can one find the root cause of the failure and help eliminate future failures. A refractory failure is the number one cause of boiler inefficiency and a major contributor to boiler shut-downs. Refractory that is properly selected and installed will always last longer, help minimize the amount of shutdowns required, and lead to savings in annual fuel cost. Experts agree that refractory designed and installed to save energy also saves money at a rate that is essential for efficient plant operation.
1 ASTM C-64.
2 Refractories in the Generation of Steam Power – McGraw-Hill Book Company, F. H. Norton (1949).
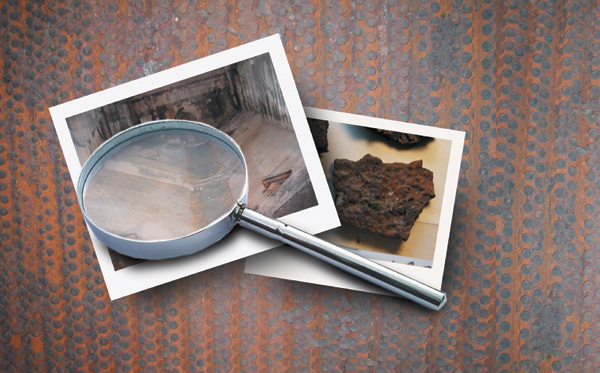 Figure 1
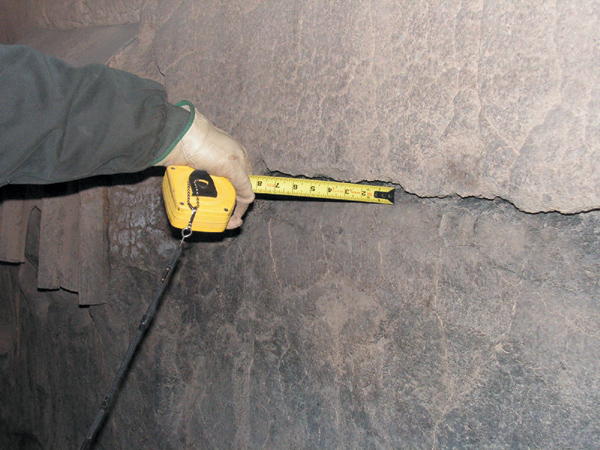 Figure 2
Spalled refractory inside ash hopper
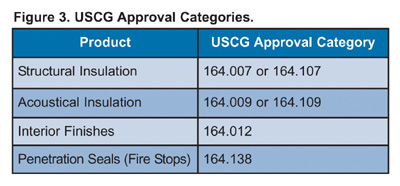
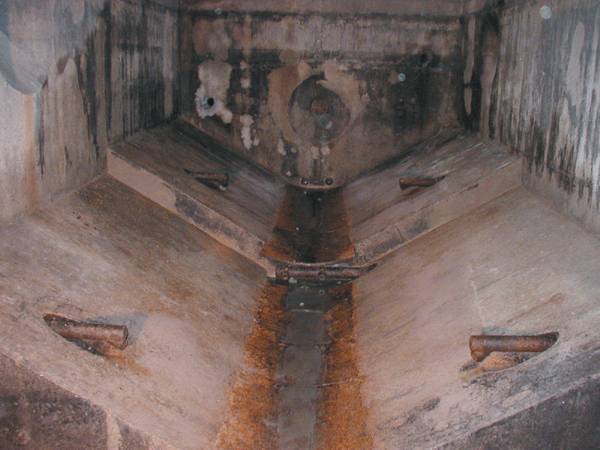 Figure 3
Wet bottom ash hopper with failed refractory areas
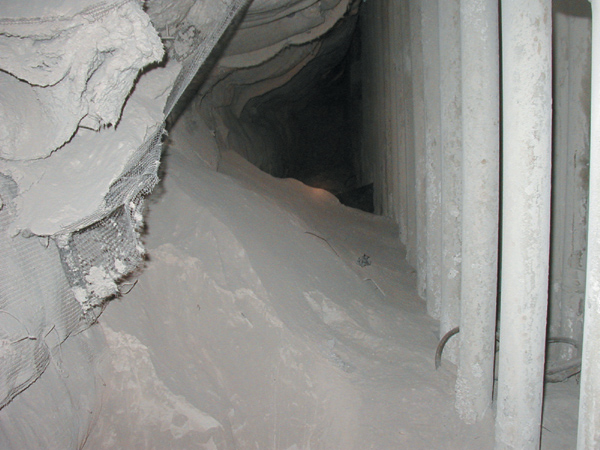 Figure 4
Fly ash inside penthouse between screen tubes at middle of boiler
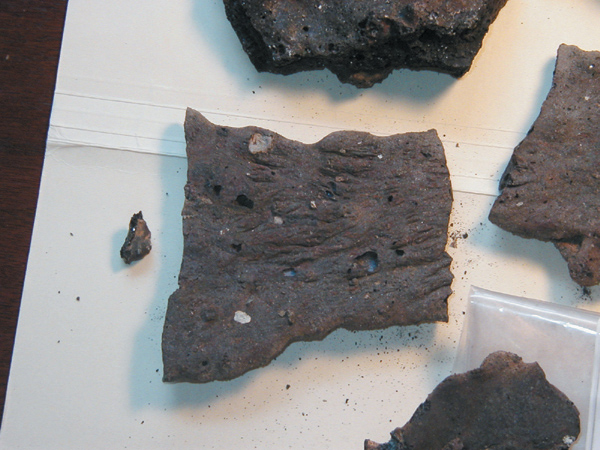 Figure 5
Slag sample with furnace wall tube pins studs embedded in slag
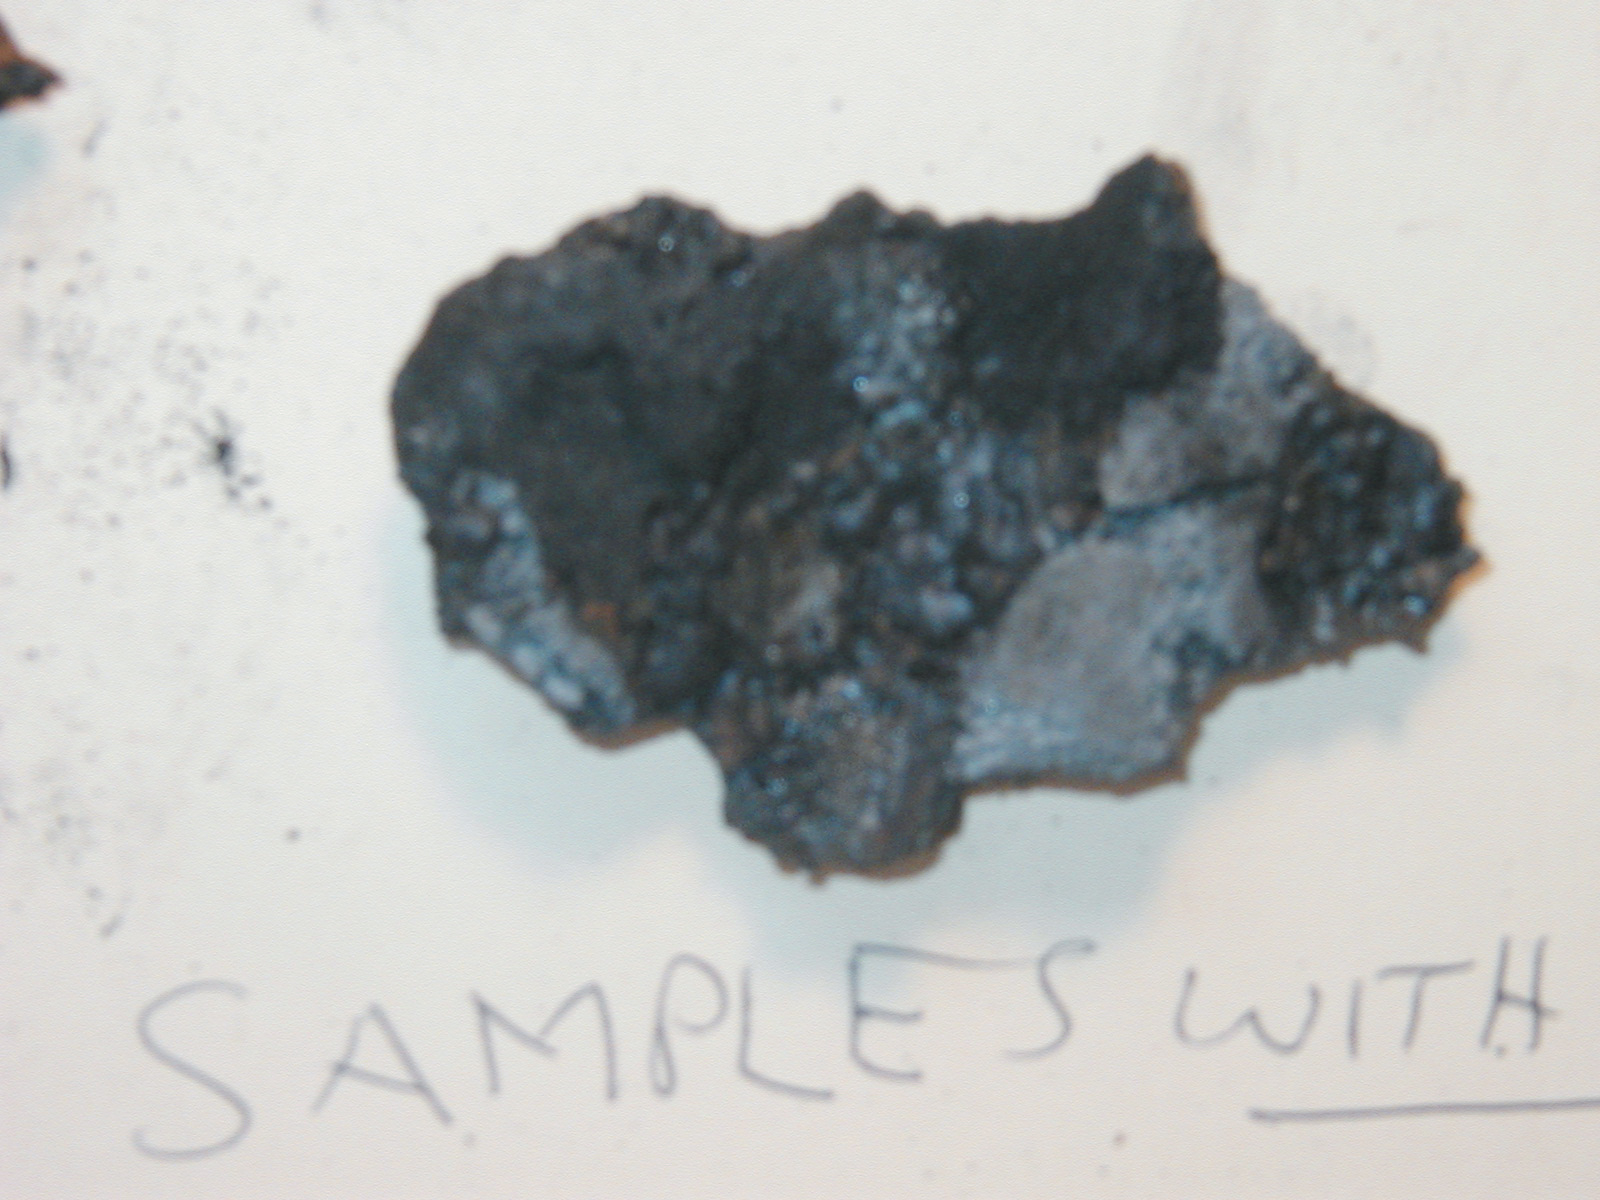 Figure 6
Closeup of slag with studs from furnace
 Figure 7
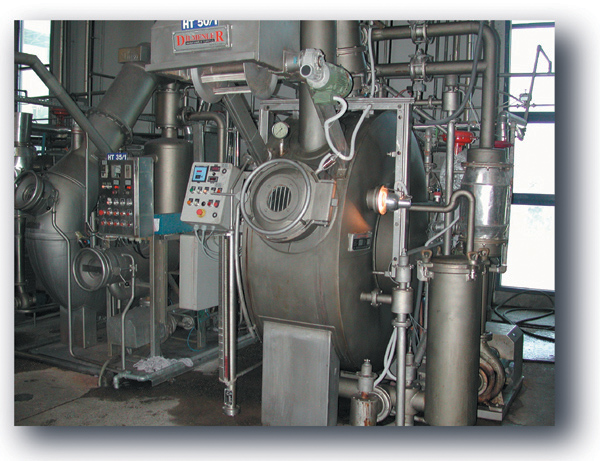
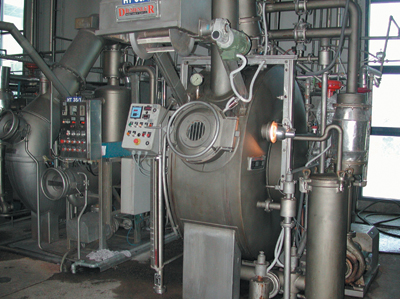
Shotcrete application mixer with 2000-pound refractory tote bag hanging above mixer
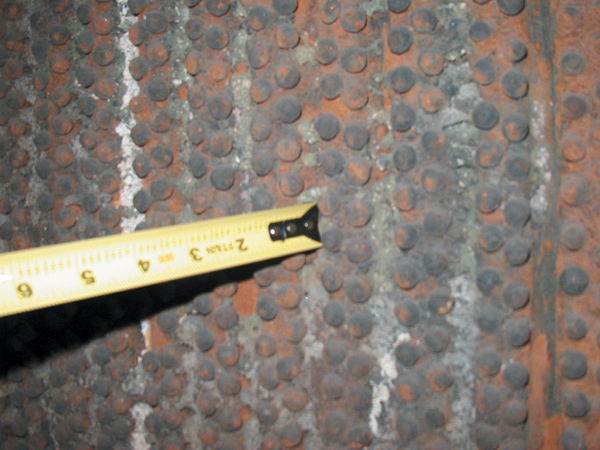 Figure 8
Close up of furnace wall studs worn away due to failed refractory
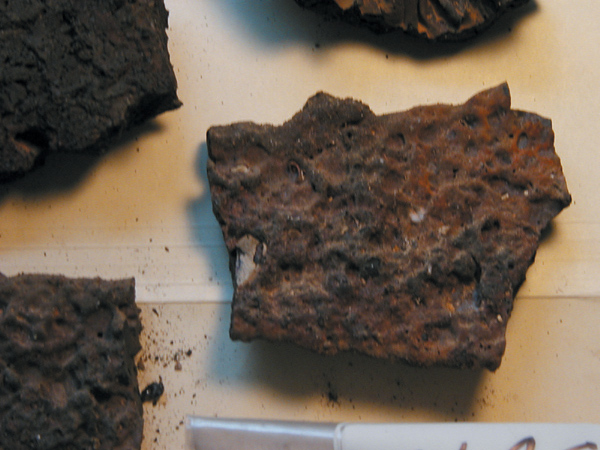 Figure 9
Slag samples taken from furnace
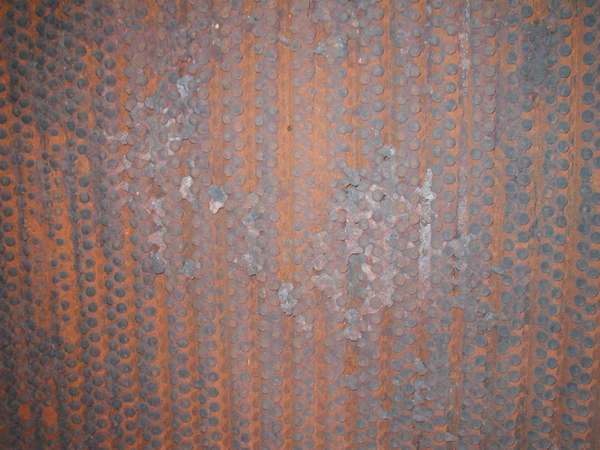 Figure 10
Furnace walls inside a fluidized bed boiler without refractory
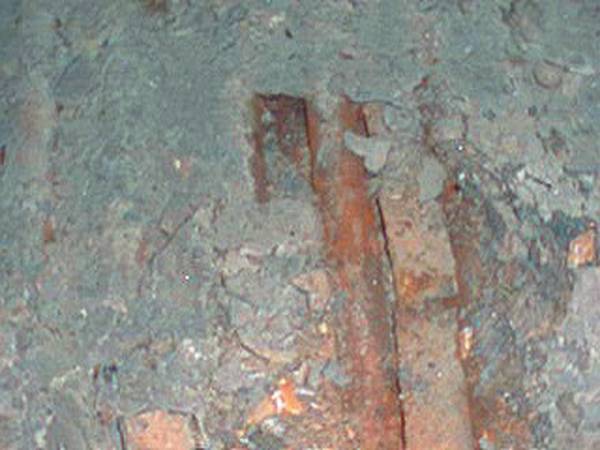 Figure 11
Spalled refractory inside on furnace floor
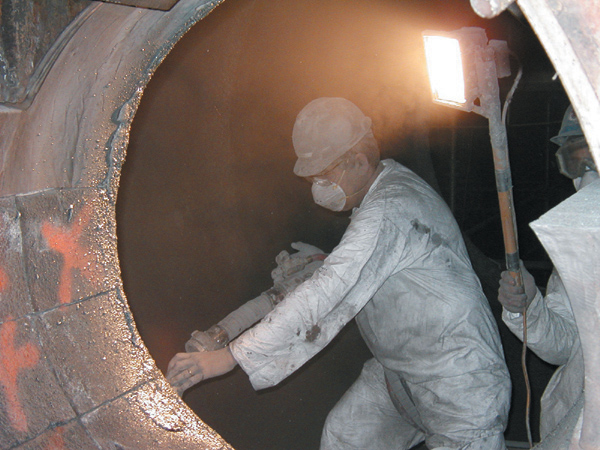 Figure 12
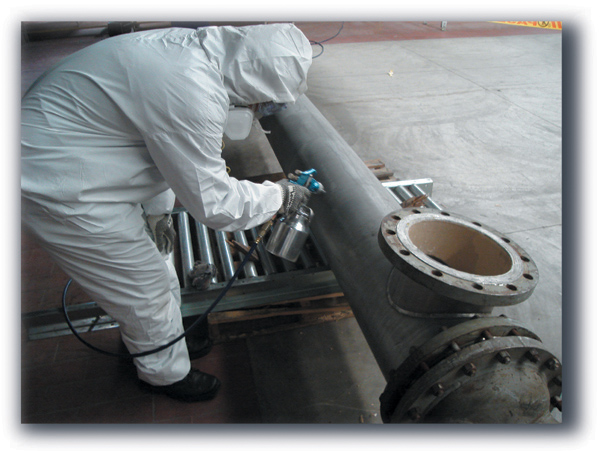
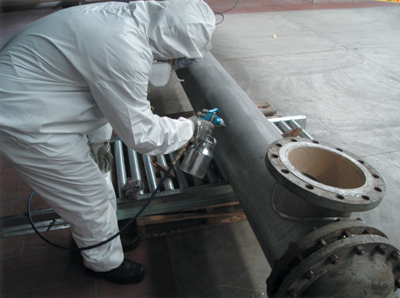
Gun application of refractory