Category Archives: Global

In March 2000, Mike Pfeiffer, vice president of codes at the International Code Council, recommended that the firestopping industry develop standards for quality. With that challenge, Firestop Contractors International Association (FCIA) Standards Committee Chair Don Sabrsula (2000-2005), president of FireSafe of Houston, worked with industry contractors and manufacturers to assemble and ballot the first standard for firestopping inspection.

ASTM E 2174-01 Is Born, and ASTM E2393 Evolves

ASTM E 2174, Standard Practice for On-Site Inspection of Installed Fire Stops, was founded from the Quality Process approach. It is designed to be part of the total quality protocol needed for zero-tolerance firestop systems installation. Firestop manufacturers test their products, manufactured to strict tolerances, and publish systems suitable for use as firestops in the Underwriters Laboratories, Inc. (UL), Omega Point Laboratories, Inc. (OPL), Warnock Hersey International (WHI), and Factory Mutual Research Corporation (FM) approvals directories.

Construction process quality is a topic of increasing awareness in the construction industry. Recently, construction quality has been compared to the manufacturing industry, most notably in Engineering News Record; in the keynote presentation at the Construction Specifications Institute (CSI) Show and Convention in Chicago in April 2005, delivered by Patrick MacLeamy, chief executive officer of Hellmuth, Obata, and Kassabaum (HOK) Worldwide.

To provide a construction installation protocol program, FCIA created a standard for quality process in the construction subcontracting industry: FM 4991, Standard for the Approval of Firestop Contractors; with ASTM E2174-01, Standard Practice for On-Site Inspection of Installed Fire Stops. Later, ASTM E2174-01 was updated to ASTM E2174-04. The standard then became augmented with one for inspection of joint systems for walltops, expansion and construction joints, plus perimeter fire protection: ASTM E2393-04, Standard Practice for On-Site Inspection of Installed Fire Resistive Joint Systems and Perimeter Fire Barriers.

FM 4991, also listed nationally in many specifications due to reference in MasterSpec and Building Systems Design, Inc. (BSD) SpecLink, is a quality process audit program wherein the contractor has a designated responsible individual (DRI). The DRI passes an industry test based on the Firestop Industry Manual of Practice (MOP) tested systems selection and the FM 4991 standard. The DRI manages the firestop contracting firms’ processes, policies, and procedures to achieve installed firestop systems that meet the tested and listed system requirements published in testing directories.

During the FM 4991 approval process, FM visits the firm, audits to their quality manual, and then checks the installed firestop system in the field through destructive testing to verify the paperwork’s validity. Follow-up audits are done yearly by FM, with the same destructive testing employed by FM personnel.

Effective quality programs have a procedure for the production process and sampling to be sure the process works. ASTM E2174/E2393 are the check and balance that sample the production process for firestop installation—FM 4991. The FM 4991 program is quite affordable for a contractor. The initial cost is about $6,000 for the first audit, and annual follow-up audits are approximately $1,500.

UL Announces New Firestop Contractor Qualification Program

UL announced the new Firestop Contractor Qualification Program at the FCIA Firestop Industry Conference, November 2005. On April 27, 2006, UL held its first testing of DRIs who would manage newly qualified contractor firms by UL at the FCIA Education and Committee Action Conference. Another testing opportunity will be held at the Firestop Industry Conference and Trade Show, Charleston, SC, November 8-10, 2006.

The new UL program affirms that the subcontractor quality process is gathering momentum. Both the FM 4991 and UL program offer audit inspections of the firestop contractors’ quality processes, with field verification during an audit. Specialty firestop contractors now have a way to separate themselves from others who have not embraced the quality process.

Why Bother to Become Approved?

There are several reasons contractors choose to become FM 4991 approved or UL Qualified Firestop Contractor firms. Aedan Gleeson, FCIA accreditation chair, reports that specifiers in the Northeast have added FM 4991 and ASTM inspection to projects, with many of the specifications actually resulting in an FM contractor awarded the work. “We even looked at bidding a project in Dubai, United Arab Emirates that had a requirement for an FM 4991 Contractor?making this program truly international. Most importantly, contractors are paying attention to fire and life safety through this quality process,” said Gleeson.

Contractor Quality Manuals

For a contractor firm to write a quality manual, it must review its processes, procedures, and people. The firm’s organization processes are reviewed from the time the estimate takes place to project award, through communication to the field, then installation and inspection of the work.

“Going through the FM 4991 Process and building a quality manual made us look at all of our processes for efficiency and quality. We made many changes to what we do and how we performed. The result is that we are a better company for going through this FM 4991 Approval Process,” Bob Svoboda, of S&W Waterproofing, Kansas City, MO, recently stated.

Contractor quality manuals must reflect a firms’ procedures. Many policies are required by either FM or UL, but each firm is unique in how it selects systems, communicates the appropriate systems to the field, and then ensures that the firestopping is installed to tested and listed system standards. Each firm will have its own way of handling the quality process. It is the basis of the free enterprise system that each quality program would be individual because the way a firm is organized to execute a contracted firestopping project can be its competitive advantage.

Quality Is the Whole Process

ASTM E2174 and ASTM E2393 inspection protocols are a package, together with FM 4991, that affects the installation protocol of firestop systems to result in better overall project quality. ASTM E2174 and ASTM E2393 can be used without a specialty firestop contractor or an FM 4991-approved or UL Qualified Firestop Contractor on projects that use the “whoever pokes the hole, fills it” protocol.

However, the inspection will cost much more when used with the multiple trade method, as it is difficult to manage anywhere from two to 40 subcontractor firms that touch Effective Compartmentation with their penetrating pipes, ducts, cables, etc. Inspectors tell FCIA that inspection costs rise dramatically with multiple trades and varied field applications involved. The amount charged for inspection can be staggering.

From a contractor’s perspective, the complete approach—a specialty firestop contractor providing quality services for firestop systems installation, with inspection by qualified inspectors to verify that the process works—allows the best method, offering value to the purchaser of firestopping through efficiencies in the process. Investment in the correct contractor, with processes that result in documented systems installed in the field, means that value is received for products, systems, and services.

Architects, specifiers, engineers, building code officials, and fire marshals should consider specifying tested and listed firestop systems made by quality manufacturers, installed by a specialty firestop contractor (FCIA member and/or FM 4991-approved or UL Qualified Firestop Contractor), inspected to ASTM E2174 and ASTM E2393, to make the total quality management process complete.

Below is some FCIA-suggested specification language from www.fcia.org:

Contractor Qualifications

Acceptable installer firms shall be:

  1. FM approved in accordance with FM Standard 4991, Standard for the Approval of Firestop Contractors, and/or UL Qualified Firestop Contractor;
  2. Licensed by the state or local authority, where applicable;
  3. Shown to have successfully completed not less than five projects of comparable scale; and
  4. FCIA Contractor Member in good standing.
Inspection
  1. Inspection should be by an independent inspection agency employed and paid by the owner. The inspection agency will examine penetration firestopping in accordance with ASTM E2174, Standard Practice for On-Site Inspection of Installed Fire Stops, and ASTM E2393. The inspection agency is to examine firestopping and determine, in general, that firestopping has been installed in compliance with requirements of a tested and listed firestop system, and that the installation process conforms to FM 4991.
  2. The inspector shall advise the contractor of any deficiencies noted within one working day.
  3. The contractor should not proceed to enclose firestopping with other construction until the inspection agency has verified that the firestop installation complies with the requirements.
  4. Where deficiencies are found, the contractor should repair or replace the firestopping so that it complies with the requirements of the tested and listed system design.
  5. From ASTM E2174 and ASTM E2393: The firestop inspector should not to be related to the installing contractor firm in any way, including arms’-length business relationships including subsidiaries, distributors, manufacturers’ representatives, or manufacturers supplying products for use in firestop systems.

Note: FCIA is working with ASTM to develop a standard for the qualification of inspectors.

The subject of fire testing, even as it applies to a single industry such as insulation, is enormous in both its breadth and level of detail. Many laboratories and consultants have quite successfully made it their primary focus, yet even they spend years learning and expanding and tweaking the ways to best test their clients’ products to open new doors for code compliance and applications. To explain everything that you may need to know about fire testing in a single article is nearly (if not actually) an impossible task. Thus, the aim here is to provide a basic reference for sorting through the alpha-numeric soup of test standards one may encounter.

A number of groups, such as universities, states, and municipalities, write standards—either for use within their jurisdiction or for specialized applications. However, most of the test standards for insulations are drafted by the same few organizations: American National Standards Institute (ANSI); ASTM International (more commonly referred to by the older abbreviation “ASTM”); National Fire Protection Association (NFPA); and Underwriter’s Laboratories (UL).

In fire testing, the first question that comes to mind is, why use an outside lab at all? Manufacturers often have their own, internal research and development (R&D) and quality assurance (QA) equipment and staff. A do-it-yourself approach misses out on the greatest components that a dedicated fire-testing lab has to offer, though—i.e., valuable experience and specialized, dedicated equipment. In addition, many codes and authorities having jurisdiction require independent testing, and sometimes third-party certification and design listing.

Physics Primer

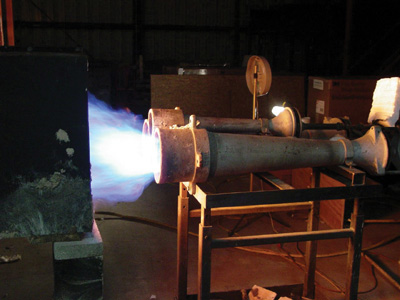
In talking about fire performance and standards, test personnel (subject matter experts) use very specialized terminology. Temperature, heat, energy, and power all seem like terms the layman knows and understands, but there are a few subtleties in this context. Energy, or heat, is a measurement of a capacity to change a system. More heat means more change. This is measured in joules (J) or, more conveniently, mega joules (MJ), which is one million joules and is usually discussed in terms of energy release over the course of a test or a particular time span. J/MJ should not be confused with a watt (W), which is a unit of power—the number of joules released per second. A kilowatt (kW) is one thousand joules per second. A simple 12″ x 12″ burner burning propane at 100 kW releasing the gas into the air at standard temperature and pressure produces a flame about five feet high. Left to burn for ten minutes (or 600 seconds), it would release 60MW. The propane gas most commonly used for these tests burns at about 1,200 to 1,600 F. When talking about smoke, the units are somewhat counter-intuitive. People typically think of smoke as a gas, taking up a particular volume. However, smoke is actually just a tiny suspended particulate that blocks light (and impairs the lungs’ ability to take in fresh oxygen). The units used to measure smoke are square meters (m2) a unit of area. Smoke release rate is square meters per second.

Testing 1, 2, 3

The test library can be broken down into three main categories based on sample size: small, medium, and large. Different sized tests fit different needs for different applications. Manufacturers will probably need to use them all at one point or another to provide customers with the right fit.

Small Scale

The small-scale tests that insulators are most likely to see referenced are ASTM C411, ASTM C518, ASTM E136, ASTM E162, and ASTM E662. These tests are most often run in conjunction with larger scale tests to qualify a given product or design. They typically cost less than $1,000 each and are performed on materials that are at most 144 in2. The low cost of materials, testing, and shipping makes them a good place to tune R&D work before committing to larger tests.

ASTM C411

This test is an evaluation of the deformation of a block or pipe insulation on a hot surface over time. It is less a test of flammability than one of durability. A 6” x 18” specimen is placed on a room-temperature surface and brought to the desired temperature at a rate consistent with field conditions. It is then stabilized and allowed to test for 96 hours. Warpage is measured as a linear distance from the center of the specimen. Specimen layering and joints should be as installed.

ASTM C518

This test is one of the better-known methods, but it is not explicitly a fire test. It looks at the energy conduction of a 12″ x 12″ sample and is used to establish the R-value that is familiar to the general public. This test is not very exciting to watch; it is generally automated and set up in the afternoon and allowed to run all night long to establish a good measurement.

ASTM E136

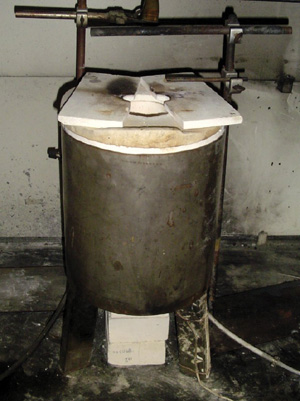
The E136 is more commonly known as the non-combustibility test. The standard uses a specific electric furnace set to 1,382 F (750 C) into which a 1.5″ x 1.5″ x 2″ sample is lowered for at most 30 minutes. The sample has thermocouples on the exterior and interior. The hope is that the specimen will do nothing and just sit there like a rock. More than likely, however, it will do something. Specimens are judged by one or two criteria. In the first, the specimen is allowed to lose no more than 50 percent of its initial weight. Neither the interior nor the exterior temperature rises more than 30 C, and the specimen flame for no more than 30 seconds. If the specimen does lose more that 50 percent of its weight, then it is judged by a second criterion, under which no flaming is allowed at all. The test may be terminated early if the specimen reaches a stable temperature before 30 minutes has elapsed.

ASTM E162

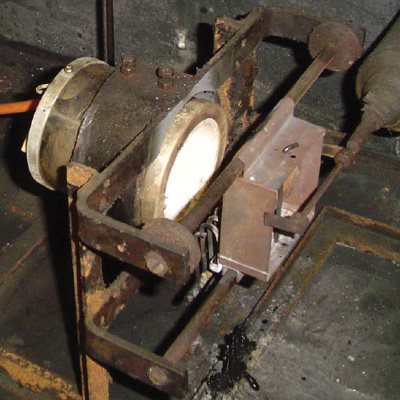
This test is a flame spread test on a 30-degree backwards slope from a radiant heat source. That is, the radiant burner is aligned vertically, with the sample face angled such that the closest point to the heat source is at the top. Down is not a direction that most people are used to seeing flame spread, but down it goes. The heat source measures about 25 kW at the closest point and decreases sharply as the distance grows.

ASTM E662

This is the “smoke chamber test” commonly used along with the E162 (above). In this procedure, a 3″ x 3″ sample is placed in a fixed volume box and irradiated with an electric heat source to produce smoke. The amount of smoke produced is measured using a light source and photocell arranged vertically some distance away from the specimen. This vertical arrangement eliminates any factors that the varying density of smoke in the vertical column may present. Similar to the E162 test and others, this standard does not feature pass/fail criteria. Rather, the test standard is referenced by code bodies and authorities having jurisdiction with their own unique requirements for passing the test.

NFPA 259

This “bomb calorimeter” test measures the energy content of a specimen. It is a very accurate measurement of how much heat is produced when a sample is ignited and burned as completely as possible. This test stands out from the others in that it is much more of a classical chemistry test. The “bomb” designation comes from the tendency of early oxygen calorimeters to explode. Generally speaking, rapidly expanding gases and elevated temperatures and fixed volume make a poor combination. The numerical result from this test is kJ/kg.

Medium Scale

This is where things start to get more interesting. Testing on this scale is a more dramatic event. While using larger and more dramatic ignition sources than the small-scale methods, tests like room burns allow proximity and close observation that is not often possible behind furnaces with layers of high-temperature glass.
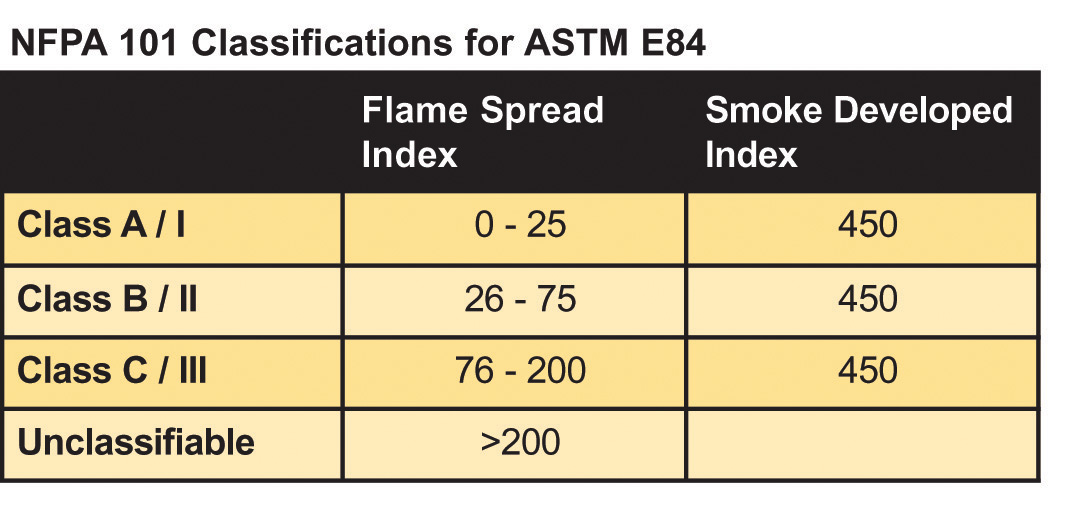
ASTM E84

As one would expect, with some competition among them, as well as local or industry policy, many of the standards groups have developed test methods that are identical (or nearly so). While there has been some consolidation and standardization, there is still plenty of overlap. An ASTM E84 might also be called a UL 723 or NFPA 255.

The E84 Tunnel is one of the oldest and most often called upon tests for building products. Named after its inventor, the Steiner Tunnel mounts an 18″ wide x 24′ long sample to the roof of a tunnel with a pair of gas burners at one end and a forced draft that pulls the flames down toward the other. The travel of the flame front on the specimen, as well as the smoke produced, is compared to red oak and cementicous reference standards to produce Flame Spread and Smoke Developed Indices (FSI and SDI). As a comparative number, they do not use a unit, like meters or degrees Kelvin. Specimens that are not rigid enough to stay up on their own are allowed to be supported with steel rods spaced 2″ apart. If additional support is needed, hexagonal wire mesh might be added.

Both FSI and SDI are functions of area under the curve, though they are computed slightly differently. The smoke value is strictly the area under the curve. FSI is the area under the curve from the beginning of the test to the point where the flame front reaches its peak. Beyond this time, even if the flame recedes, the FSI is calculated as the product of time and the maximum distance. In practical terms, if the flame quickly spreads down the length of the tunnel and then recedes, the calculation is performed as if it never receded at all. This can be a real problem if an exposed facing material ignites and allows rapid, though short-lived, flame travel.

In addition to math computations that are difficult to explain, determining exactly where a flame front should be recorded during the course of a test requires a great deal of experience. The glass looking into the tunnel is often dirty, and the sample’s own smoke does not help the situation.

E84 classification

Two of the most common questions that flammability testers are asked by those new to tunnel testing are, What do these numbers mean? Did I pass? Again, there is no E84 pass/fail criteria built into the standard. A product’s pass/fail depends largely on the code governing the application and authorities having jurisdiction. For example, NFPA 90A and 90B, which cover ductwork and air handling equipment, require that products have an FSI/SDI of 25/50. International Building Code (IBC) Chapter 26, which covers foamed plastics, has a requirement of 75/450 if used in the core of an insulating panel, but only 25/450 if used in another application without a thermal barrier. Similarly, IBC Chapter 7, covering fire-rated assemblies, requires a rating better than 25/450 for all concealed insulations. The point is that a careful check of the applicable code is required. If a manufacturer does not have a dedicated code compliance person on staff, independent consultants may be a good idea. Consulting with the test laboratory can also provide assistance.

Back to the Steiner Tunnel test: How does it apply to the insulation industry? Insulating the underside of a flat ceiling in a narrow cavity with a permanent draft seems like a pretty contrived situation. And why compare it to red oak? Wood flooring is not exactly an industry standard for insulation. This brings up one of the central caveats of fire testing and many other testing disciplines. This exercise is not designed to simulate or replicate any particular real-world situation. At its heart, it serves to provide a common basis for evaluation of a whole universe of materials and designs.

ASTM E2231

This is another standard that may be mentioned in connection with the E84. It is not so much a testing standard as a method for mounting pipe and duct insulations in the Steiner Tunnel. It dictates the mechanical and adhesive attachment methods, location of seams and joints, and required adaptations for cylindrical or other non-rectangular shapes. It is far too detailed to attempt to summarize here. The best strategy for tackling this one is to discuss it with the test laboratory prior to shipping the samples, or to purchase and review the standard if you will be doing the prep work yourself.

NFPA 274

The “pipe chase” test resulted from an attempt to design a test that is more comparable to a field application. In this test, an L-shaped insulated duct is fitted with a 12″ x 12″ sand burner at the bottom; and one, two, or three pipes or HVAC ducts are hung in the interior. The pipes are insulated with the material to be tested. The sand burner is run with an initial three-minute flame of 20 kW, followed by a seven-minute flame of 70 kW. The specimen is judged to have passed if the test does not yield a peak heat release greater than 300 kW, a total energy output of 50 MJ, more than 500m2 of smoke, or a flame that extends more than 12″ above the top of the test duct. Acceptance of this test for code compliance purposes is still not widespread, as it is relatively new.
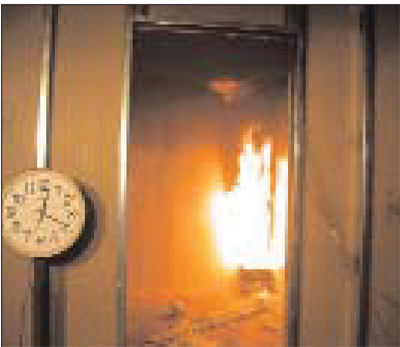
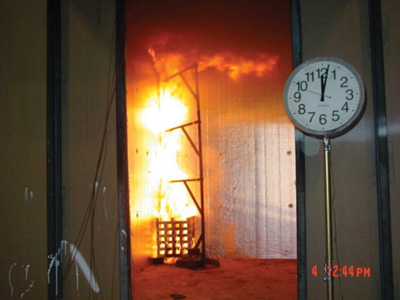
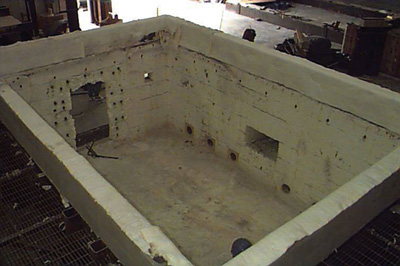
Room Burns

Room burns are simple to describe. A mockup room is built using standard gypsum and stud construction. The room is lined with the product being tested, such that the final dimensions are 8″ high, with an 8″ long back wall, and either 8″ or 12″ deep side walls. There is a normal-sized doorway at the opposite end of the room to allow oxygen to enter, smoke to evacuate, and observations to be made. These tests can become about as dramatic as they get, though that is not usually a good sign for the test sponsor. There are three main standards: the NFPA 286, UBC 26-3, and UL 1715. The last two are essentially the same test, though they have some slightly different instrumentation requirements. This test is most commonly used to qualify a product for use as a wall covering without a thermal barrier.

UBC 26-3 and UL 1715

These tests are ignited with a 30-pound wooden “crib,” which is a 15″ x 15″ x 15″ stack of softwood 2″ x 2″ x 15″ arranged in alternating directions to allow ventilation. It is a corner test in that only two walls and a ceiling are tested. It may be configured for walls only, a ceiling only, or both walls and ceiling. This test fails when the ignited flame front reaches the extremities of the walls or when there is excessive smoke, excessive charring, or the catastrophic failure of a flashover. “Flashover” describes a situation where a large amount of hot gas trapped in the room ignites quickly and violently, usually with flames reaching out the door. They are very impressive to watch, though disheartening if it is your product at the root of it.

NFPA 286

This particular variety of the room corner test tests the 8′ x 8′ back wall, two 8′ x 12′ sides and the 8′ x 12′ ceiling. Its ignition source is a propane sand burner, similar to that used in the NFPA 274. Also similar to that test, it has a two-stage ignition source: 40 kW for five minutes, then 160 kW for ten minutes. As with many other tests, the pass/fail criteria are not contained in the standard, but rather are a part of code. The usual requirements are found in IBC Section 803. During the 40 kW ignition, flames are not allowed to spread to the ceiling at all. During the 160 kW exposure, flames should not reach the extremities of any side wall. During the entire course of the test, smoke release must be less than 1,000 m2. Of course, the flashover requirement is in place.

Large-Scale Testing and Design Listings

Last, but not least, are the large-scale tests. All the tests covered thus far use test samples that are most like field installed conditions. These methods evaluate not only the manufacturer’s product, but also the installation techniques and hardware. As such, they are often referred to as a “system” or a “design” that features the test sponsor’s product as a critical component of that system. Often, the goal is to generate a “listing” that either the laboratory or other third-party certification agency maintains. Like a test report, the design includes specifics of what materials and methods are used, and a summary of the performance, usually stated as a time rating, during which the design is known to comply with the test’s performance criteria. Those lists can be specific to the brand and model of the materials that were actually tested, or be broadened using an engineering evaluation to include a generic product types. The listing agency generally publishes or makes available some library of designs and their respective ratings, which architects and engineers can choose to incorporate into their client’s construction and that are recognized by the authority having jurisdiction.

Many customers elect to test designs to worst-case scenarios—for example, using a reduced number of fasteners, ducts and penetrations with greater cross-sectional areas, or thinner insulation. This way, a more robust construction may be covered by the same design with minimal engineering evaluation.
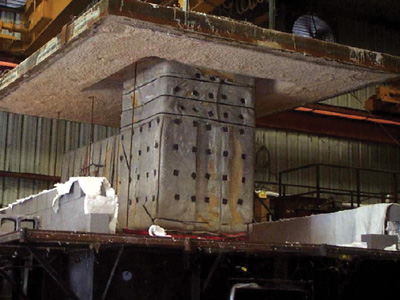
ASTM E119

Like the E84, the E119 is a very common and universal standard. It uses either a large horizontal or vertical furnace that heats a single side of a sample at a time. Products also may be placed into a horizontal furnace and completely engulfed. The designs most often subjected to this test are rated walls, floors, ceilings, penetrations, columns, and pipes. Many designs are tested under a load.

The most prominent feature of this standard is the E119 time/temperature curve, indicating the required temperature of the furnace at any given point during the test. The shape of the curve increases sharply at the beginning and gradually evens out to more slowly escalating temperatures further into the test. Insulation performance is monitored with thermocouples on the non-fire side and sometimes the interior, depending on the nature of the specimen. The design’s integrity is monitored by watching for development of holes through which flames may escape. Comparable to real-world conditions, specimens are often further evaluated by dousing them with a fire hose immediately after removing them from the furnace. The pass/fail criteria are included in the standard and are specific to the type of product being evaluated, although basically they all look at temperature rise.
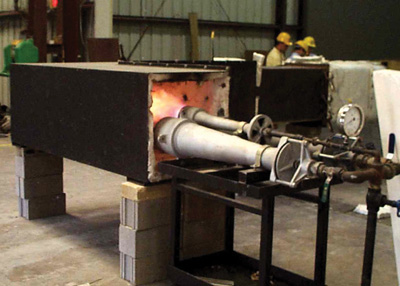
UL 1709

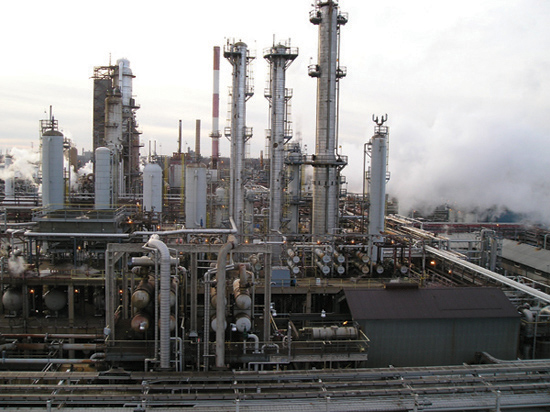
This standard is similar to the E119 in form and function except that it requires a very rapid escalation of the furnace. The time/temperature curve rises to 2,000 F and stays there after only five minutes, while the E119 does not reach this temperature until four hours have passed. This high temperature requires a powerful furnace and can be difficult to control. It is important to use a well-equipped and knowledgeable laboratory for these tests. The test evaluates structural steel and is often required for applications such as petrochemical or shipping, where fires of that scale are possible and failure is disastrous.

Grease Ducts

As noted in the E84 section, products used in ventilation ducts and other air- handling spaces are subject to stricter requirements than other comparable applications. Because of their hazardous role, kitchen grease ducts must endure very demanding testing. The most common standard is the International Code Council Acceptance Criteria 101. (AC101) Some areas may still require the UL 1978, but they are fewer and farther in between.

AC101 is actually composed of several test components. In addition to the evaluation of the duct system, the insulation must pass requirements of the ASTM E119, E136, and C518. Often, the design listing for AC101 ducts specifies certain sections that have been evaluated. The C518 stipulates that samples that have been subjected to an aging process shall not have their thermal conductivity rise by more than 10 percent. However, the really interesting part of AC101 is the internal grease fire and engulfment components.

In the engulfment portion, an L-shaped duct is suspended from a rated floor/ceiling assembly, acting as the furnace cover with a penetration out the top. The specimen is then subjected to the E119 time/temperature curve for the desired period with a hose stream test following. Presuming that the specimen passes the temperature requirements, the duct must not develop any breaches or openings into the interior or through the penetration seal.

For the independent evaluator, the internal grease fire test is impressive to watch. One can only imagine, however, how stressful it must be to the test sponsor. The test is conducted on an L-shaped insulated duct. There must be two joints and an access opening to the interior. Initially, the interior air temperature is raised to 500 F for hour hours, measured midway down the duct’s length. During this period, exterior thermocouples may not exceed 117 F over initial ambient conditions. Following this, the temperature is raised to 2,000 F for 30 minutes, during which time the average temperature on the exterior thermocouples is not allowed to increase by 325 F at any one point, or 250 F averaged over all points. As one would expect, no openings or flames on the exterior are permitted.

Summary

The standards that were addressed here only skim the surface of the basic tests. An authority having jurisdiction, or an architect, may have any number of specialized requirements. Certainly, some of these will not even apply to some products, as putting mineral, plastic, glass, and more exotic insulations into one bucket is a tough fit.

Referencing the strong connection between time and money, it is important to fully use resources to get the best return on the investment. Using an experienced and qualified testing laboratory can hasten the process. Communication is vital. One must fully understand what the authorities having jurisdiction, architect, or specifier requires. Also, one needs to be sure to relay to the test lab exactly what it is that they want to evaluate, and to what purpose. Very often, the testers may know of a way to facilitate the testing and provide more service than expected.

Making assumptions can be costly, so users should be sure that they understand what the lab requires and what they can and cannot do with a given test. Especially if an engineering judgment is required, one should be certain that this is brought up before sample construction is begun. Finally, users should make an effort to witness as much of their testing as possible. Though not as critical for small-scale tests, when working with specimens whose performance relies on complex interaction between materials, first-hand observation by those who work intimately with the product will yield information that could never be teased out of a two-dimension photograph or test video.

With some basic understanding of the options and what is required, product testing does not need to be as complicated or as daunting as it may initially appear. When handled properly, it can present exciting and profitable challenges.

Figure 1

NFPA Classifications doe ASTM E84

Figure 2

E136 Furnace

Figure 3

E662 radiant heat source and sample holder

Figure 4

NFPA 286 Ignition

Figure 5

UBC 26-3 Ignition

Figure 6

Large Scale E119 furnace

Figure 7

Grease Duct Enfulgment

Figure 8

AC101 500°F flame

Figure 9

AC101 2000°F flame

After watching scenes of the fire at Chicago’s 135 S. LaSalle St. (LaSalle Bank building) in December 2004, we were pleased to hear that the Chicago Fire Department operated flawlessly to rescue people from the burning building while fighting the fire and dousing the intense flames. The structure, engineered to Chicago’s high-rise building codes, past and present, withstood fire exposure for more than five hours. Other major high-rise fires have involved multiple floors. Here, the fire was contained to the twenty-ninth floor for a very long period of time, saving both life and property.

Since the Great Chicago Fire of 1871, the city has been fire sensitive. It was one of the first cities to build homes and structures with fire-resistant materials to prevent fire spread from building to building. Chicago provided leadership in building codes requiring Effective Compartmentation and structural steel fireproofing protection in buildings. Effective Compartmentation uses hourly fire resistance-rated floors, walls, fire doors, fire dampers, and firestopping to protect people from fire spreading to floors above or rooms next door. In addition, smoke protection systems are being retrofitted into fire walls and floors to prevent the spread of smoke during fires, and some building owners are installing automatic sprinkler systems to further protect structures in Chicago.

Several things worked in this fire, from LaSalle Bank’s detection system (which sensed the fire and activated alarms) to communications systems operated by educated building management, firefighting personnel who instructed people on what to do, 911 and building occupant communication links with firefighters, occupants trained through fire drills, stairwell doors that opened once the building systems sensed fire, and Effective Compartmentation fire resistance-rated floors that stopped fire from spreading fast vertically for several hours.

One element that worked in this incident was the structure itself. The intensity of the fire exposure may have caused other buildings to collapse and fire to spread vertically, including more than just the floor of origin in the blaze. The LaSalle Bank building’s fire safety features, rooted in Chicago’s concept of Effective Compartmentation and structural fire protection, paid dividends. The exterior wall system, made of non-combustible elements, and a strong structural column and floor system helped the building withstand a fire for more than five hours without progressive collapse.

The question has been raised by many: Could 135 S. LaSalle St. have been equipped to provide better fire protection? Absolutely. Implementing the City of Chicago’s Life Safety Evaluation, which requires attention to Effective Compartmentation—firestopping, fire doors and frames, fire and smoke dampers in fire resistance-rated construction, Effective Compartmentation features, and sprinkler systems—can make a building safer for those who work and visit there each day.

The LaSalle Bank building management should be congratulated for educating building operations personnel and occupants through fire drills that helped people understand the exit procedure during a fire event. Additionally, for excellent performance under fire, Chicago Mayor Richard M. Daley and his “City That Works” —including Cortez Trotter, Fire Department Commissioner, and Alderman Bernard Stone, chair of the City Council’s Committee on Buildings—should be commended for life-saving legislation and codes that made this structure perform well past most building code requirements in the United States, which only require two or three hours of protection under fire attack.

Another Chicago high-rise fire occurred at the Cook County Administration Building in October 2003. As a result of efforts by Chicago’s Committee on Buildings—which listened to testimony from the Effective Compartmentation industry, such as the Firestop Contractors International Association (FCIA) as well as the sprinkler industries—the Life Safety Evaluation was created. In the press, the evaluation was nicknamed the “sprinkler ordinance” because it created a mandate to sprinkler high-rise office buildings slated for completion between 2012 and 2017.

What was not reported was that there is an option on the Life Safety Evaluation that allows an exception for older buildings. Many historic and multi-family high-rise structures were constructed using Effective Compartmentation as the main fire protection feature in the buildings. Since the major investment was already in place with compartmentation, FCIA, the Chicago Association of Realtors, and others recommended that these types of buildings be allowed to reinvest in the existing compartmentation. Maintenance of the compartmentation was allowed as a substitute to the sprinkler mandate in these occupancies, allowing multi-family homeowners the time to budget for sprinklers and add them as can be afforded by the owners.

FCIA members believe in Effective Compartmentation as a major measure to protect life safety in buildings. If properly designed, installed, inspected, and maintained, Effective Compartmentation components provide reliable protection.

Top questions to ask when purchasing firestop systems that have insulation as a component
  1. What Tested and Listed Systems is the insulation tested in?
  2. Is the insulation part of a tested and listed system?
  3. Is the insulation specified by name in that tested and listed system?
  4. Show me that System!
  5. For more information about products, materials, systems and selection, testing, visit www.fcia.org and order the FCIA firestop industry Manual of Practice.

Firestopping is a matter of matching the tested and listed system with conditions as they exist in the field exactly. There are no ‘construction tolerances’, ‘make it fit’ or other variations allowed, unless specified in the tested and listed system. Once a contractor understands that philosophy, makes it part of the corporate culture, from office to field, then successful firestopping projects can take place.

There’s an old expression: Good enough just isn’t good enough. For writers of the standard building codes, that expression is pretty accurate. Each time the code is reviewed, it is a sure bet that there will be changes. Some of those changes lighten up restrictions to take into account significant technology improvements. More often, restrictions become tighter in an attempt to eliminate recognized potential errors in system design or installation that can cost the lives of building occupants and/or first responders.

Certainly, the latter is the case regarding changes in the code section concerning perimeter fire protection in mid- and high-rise buildings. While there was only one change in this section, allowing the perimeter void installation to conform to the new ASTM E2307 test method, that single change had quite an impact.

Two code references are of particular importance in perimeter fire containment. It is worth digging up a copy of the International Building Code (IBC) code book—old or new version—to highlight the important sections.

The first code reference is in section 704.9. In this section, the code writers try to protect against the vertical spread of fire on the exterior of a building. The code requires three-foot or greater vertical spandrel girders, or at least 30” horizontal protrusions such as balconies, on buildings more than three stories high when not equipped with an automatic sprinkler system.

Next, consider Section 713.4, Exterior Curtain Wall/Floor Intersection, which focuses on maintaining the integrity of the floor slab. This section requires filling the void (safing area) between the floor slab and the exterior curtain wall, which must be done to protect against the interior spread of fire between the floor slab edge and the curtain wall. The void is to be sealed with an approved system or materials to prevent passage of flame and hot gasses, and must maintain the same fire resistance rating as the floor assembly. A change in this section of the code adds that the installed material can either meet the requirements of ASTM E119 or it can be a system “installed in accordance with ASTM E2307,” a recently adopted two-story fire test.

Now, as is so often the case, an important caveat emerges from practical application of the code.

Section 704.9, Vertical Separation of Openings, provides that separating devices such as spandrel girders or exterior protrusions are not required for buildings that are three stories or fewer in height, or that are equipped throughout with automatic sprinkler systems.

On the surface, Section 704.9 language eliminates the need for spandrel panels in sprinkled buildings. However, the code language does not eliminate Section 713.4. Taken in connection with Section 713.4, it is clear that the assembly of the spandrel area along with the perimeter void must be protected and must remain in place to provide at least the same fire-rated performance as the floor slab.

Without a tested assembly to ensure that the curtain wall structure will not be compromised in event of a fire, there can be no assurance that the protection in the perimeter void will remain in place. If the curtain wall gives way, perimeter void protection fails.

This has already been proved in a testing environment. Mineral wool safing was installed between a floor slab and an unprotected glass curtain wall. Just five minutes into the test, the curtain wall glass failed, allowing the safing insulation to dislodge.1 In other words, even though the void between the curtain wall and the floor slab edge was filled to meet the intent of the code requirement, the assembly failed to meet the fire-rated expectations of the building codes.

Breach of a floor barrier in a five-minute span calls into question the exceptions stated in the current code under Section 704.9. Is it really reasonable to expect fire department response time to be better just because a building is less than three stories tall?

Prudent readers of the code will recognize that properly protected spandrel panels at the curtain wall/floor slab intersection are essential for truly meeting code requirements. Assemblies tested to ASTM E2307 meet those requirements. There are no exceptions.

References:

American Society for Testing Materials, “ASTM E2307-04Standard Test Method for Determining Fire Resistance of Perimeter Fire Barrier Systems Using the Intermediate-Scale Multi-story Test Apparatus,” Volume 04.07, Building Seals and Sealants, Fire Standards: Dimension Stone, 2005. International Code Council, International Building Code, Section 704.9, “Vertical Separation of Openings” and Section 713.4 “Exterior Curtain Wall/Floor Intersection,” IBC 2006. Loss Prevention Council, “Fire Spread in Multi-Storey Buildings with Glazed Curtain Wall Facades,” LPR 11:1999. Shriver, James C., and Cordts, Brandon, “Clarifying Curtain Wall Firestop Standards,” Technical White Paper, 2001. www.fcia.org, Firestop Contractors International Association website, 2006. www.firestop.org, International Firestop Council website, 2006. www.afscc.org, Alliance for Fire and Smoke Containment and Control website, 2006.

Continued steady world oil demand growth, combined with only modest increases in world spare oil production capacity and the continuing risks of geopolitical instability, are expected to keep crude oil prices high through 2006. The price of West Texas Intermediate (WTI) crude oil is projected to average $65 per barrel in 2006 and $61 in 2007. Retail regular gasoline prices are projected to average $2.50 per gallon in 2006 and $2.40 in 2007. Summer (April 1 to September 30) regular gasoline pump prices are expected to average $2.62 per gallon, 25 cents higher than last year’s average of $2.37 per gallon. Retail diesel prices are also expected to average $2.62 per gallon this summer.

World oil market conditions, growth in U.S. demand, and ongoing implementation of domestic fuel quality requirements are expected to keep consumer prices for motor fuels and other petroleum products high in 2006. Higher crude oil costs together with higher margins (retail price minus crude oil cost and taxes, per gallon) are also expected to contribute to increases at the pump. Higher gasoline margins are likely because: 1) gasoline consumption is expected to grow solidly following weak growth in 2005; 2) Tier 2 gasoline requirements mandate further reduction in sulfur content this year; and 3) phase-out of methyl tertiary butyl ether (MTBE) from the gasoline pool is likely to put significant pressure on ethanol and gasoline prices. Higher diesel fuel margins are expected because of the additional cost of producing ultra-low-sulfur diesel fuel later this year.

By September 2006, fuel prices are expected to be much lower than last year because of the crude oil and natural gas production and refinery outages caused by Hurricanes Katrina and Rita in 2005. With another active hurricane season possible this year, news of any developing hurricanes and tropical storms with a potential to cause significant new outages could add to volatility in near-term prices in the latter part of the summer. The projections in this outlook do not reflect a scenario with significant new production or refinery outages. Natural gas prices are projected to be down sharply during the late summer and fall compared to the hurricane disruption-related highs of 2005. The expected average for 2006 for Henry Hub spot prices of about $8 per thousand cubic feet (mcf), while down about $1 from the 2005 average, is still well above the pre-2005 historical maximum of about $6, reached in 2004. The outlook for 2007 includes Henry Hub average prices moving closer to $8.40 per mcf, assuming normal weather and continued economic expansion in the United States.

This forecast has been reprint with permission from the DOE. For expanded information
from EIA, contact Mark Rodekohr at mark.rodekohr@eia.doe.gov or Neil Gamson at neil.gamson@eia.doe.gov. Or, visit the EIA website at www.eia.doe.gov/steo.

If you have ever driven past an oil refinery, the first thing you might have noticed is the size. Refineries are, in a word, huge. Oil refining is big business in every aspect of the word. Many refineries are complex facilities worth billions of dollars, often located on thousands of acres of land, employing thousands of people.

Naturally, facilities as large as oil refineries have numerous large vessels, piping systems, and equipment, much of which is insulated and operating at temperatures ranging from 250° F to over 1,000° F. It is not hard to imagine that refineries require large amounts of energy to operate.

With facilities like these, it would seem likely that refinery management would place a high priority on insulation and its proper maintenance as a tool for good energy management. Historically, however, insulation has not been a priority. Why? The first reason is that oil refineries are producers of energy. When the cost of energy is relatively inexpensive, they always have plenty of fuel and energy available, so managers have concentrated their efforts in other areas that seemed more productive and profitable. Second, the economic benefits of insulation were not widely known or understood. Third, given the vast amounts of insulated pipe, vessels, and equipment, a little bit of damage here and there did not seem like a real problem. Finally, with so much equipment continually operating at high temperatures, refinery personnel were accustomed to working around hot surfaces.

However, the increasing cost of energy, along with an increased focus on benchmarking—see the sidebar on Solomon Associates’ Energy Intensity Index (EII)—is causing many refineries to integrate energy management into their overall plan to control cost and increase revenue. For a company whose product is energy, this may seem an odd goal until one takes into account that energy in all its forms accounts for 50 to 60 percent of an oil refinery’s annual cost. To put it another way, oil companies are deciding that it is better to sell energy than consume it.

One oil company that recognized the benefit of insulation management and made it an integral part of its successful energy plan is Sunoco R&S. Sunoco is among the largest oil refining companies in the northeastern United States, with five refineries in four states. With the newest addition of its Eagle Point Refinery in southern New Jersey, Sunoco has four refineries processing more than 600,000 barrels/day of oil. All of these are older, established refineries—some dating back to 1900 and earlier—yet, with the exception of the Eagle Point Refinery, they operate in the low 80s on Solomon’s EII, with 100 being average for the industry. The Eagle Point Refinery is not operating at the same standard as the other facilities because it is such a new acquisition, but Sunoco has an aggressive plan to bring it up to the performance standards of the other three refineries within a few years. Since the late 1990s, when Sunoco recognized the value of insulation as an energy management tool, it has performed more than thirty-five insulation upgrade projects at its three refineries in the Pennsylvania area, realizing more than $5 million in energy savings.

The Benefits of Insulation Management

Although Sunoco had an aggressive energy management plan prior to the late 1990s, insulation upgrades had no part in it. This changed, however, after a group of Sunoco employees attended a National Petrochemical and Refiners Association conference and heard a presentation on insulation. They returned from the conference and explained what they heard to Mike Sanders, then the energy coordinator for the Philadelphia refinery, suggesting that he talk to the presenters. Sanders did and the rest, as they say, is history. He learned how much energy could be saved by upgrading and maintaining a refinery’s insulation systems, as well as the exceptional rates of return for each dollar invested, and he worked hard to win over his management. Sanders performed the first couple of projects in two process areas where piping and equipment are very large and temperatures are high. Both projects worked very well, with energy savings of half a million dollars annually.

Once the cost savings and operational improvements were recognized throughout the refinery, Sanders encountered a new problem: more unit managers wanted insulation energy assessments performed, and projects executed, in their production areas than he could accomplish in any one year. He found himself in the position of having to prioritize needs and perform insulation upgrade projects that offered the best savings opportunities, telling many unit managers that they would have to wait their turn.
Word spread throughout the company and people at other locations started to pay attention. At one of the annual conferences that refinery energy coordinators attend, Sanders discussed the status of energy improvements at the Philadelphia and Marcus Hook refineries-together with the Eagle Point refinery, are referred to as Sunoco’s Northeast Refining Complex—including the insulation upgrade projects and their respective savings.

Charles LeBlanc and Kirk Miller, energy coordinators at Sunoco refineries in Toledo, Ohio, and Tulsa, Oklahoma, heard about the benefits and were interested. After a bit of time and effort, plus a large dose of persistence, both had insulation energy assessments performed and insulation upgrade projects started at their refineries. The project in Toledo started by LeBlanc is currently underway, and Miller has nearly completed one in the Tulsa refinery. Each refinery is already working on the next projects.

Saving Energy Saves Money

For Sunoco, the principal reason for these insulation upgrade projects is to save money on energy costs. This includes nearly all vessels, piping, and equipment operating at elevated temperatures and not part of the process of intentionally being cooled. Steam and hot-process piping are two of the more prominent examples. However, as these projects are completed, the facilities realize other benefits as well. An obvious benefit is that there are significantly fewer high-temperature surfaces on piping, vessels, and equipment posing a burn hazard to personnel. Second, two production units have reported back to Mike Sanders that their units are now much easier to control and operate. In fact, Pat Riley, unit superintendent at the Eagle Point Refinery, told Sanders, "After the exchanger cleaning and the insulation upgrade project, the unit hasn’t run this well in years." Finally, a manager at one of the units in the Philadelphia Refinery made a point of calling Sanders after the first maintenance turnaround after the insulation project was completed. He told Sanders that as a result of specifying and installing removable insulation covers around high-maintenance areas of piping and heat exchangers, the unit was up to full operating capacity at least two months faster than previous turnarounds.

Sanders and Sunoco management were not content to use the same insulation systems, installed the same old way as in the past. Every time Sanders submitted an energy project to senior Sunoco management for approval, he was pressed about what new and better technology the insulation project would deliver. Sanders did not need much motivation on this subject. He had his own reasons for seeking better ways to accomplish energy savings with longer lasting and more durable insulation systems. As an engineer with nearly thirty years in the oil refining and chemical business, with an emphasis on engineering and maintenance, Sanders already knew that installing better performing insulation systems would mean more energy savings and a lower long-term installed cost, with less maintenance needed-a triple win for Sunoco. With the help of insulation consultants, initially from the DuPont Company and then from Irwin Services and MJL Consulting, Sunoco adopted a number of improvements.

  • New Insulation—Sunoco changed the insulation materials the company had been using to a product that offered more structural rigidity and moisture resistance, two crucial characteristics insulation systems need to achieve long-term performance in the tough operating environment of an oil refinery.
  • New or Added Jacketing—In several locations, the insulation jacketing was changed to smooth versus corrugated aluminum for horizontal pipe and equipment. This is a seemingly small change but one that reduces the chance of water seeping into the insulation, which ruins insulation efficiency and adds the risk of corrosion under insulation (CUI). Additionally, membrane vapor retarders are now being used on cold services pipe and equipment wherever possible instead of applied mastic materials. This improves the resistance to water vapor while lowering the installed cost.
  • Removable Covers—A new standard was introduced to use removable, reusable insulation covers installed on all piping and equipment where high-maintenance activity is likely (e.g., tube ends of exchangers, valves, and steam turbines). Now, insulation in these areas is removed for maintenance activity and reinstalled more quickly, without damage. This significantly reduces the cost of maintenance and improves the production unit’s ability to get back up to full operating efficiency more quickly.
  • Specific Equipment/Design—When new pipe and equipment need to be installed, or when existing systems need extensive renovations, they are looked at as individual cases to design the best insulation system for the specific circumstance. An excellent example is the extensive renovation to the boiler feed water plant filter tanks. Due to the nature of these tanks, their orientation, and required maintenance, they require extensive scaffolding and maintenance activity on the top of the filters, resulting in damage to the existing aluminum jacketing gores where water entry into the insulation system can cause extensive CUI. A new insulation system was introduced consisting of structurally rigid insulation combined with a membrane-like jacketing with high abuse and chemical resistance.
  • Procurement—Sunoco already used specialty insulation contractors as a cost-effective method to perform insulation work. Now, it is looking at different ways to contract the work to get the best value. One method is to group a number of these projects together, creating a larger total project and making it more attractive to the insulation contractors, allowing them to work more cost effectively by spreading some of the fixed costs (mobilization, office trainers, trucks, and equipment, etc.) over a larger volume.
  • Training—Sunoco, with the help of MJL Consulting, has trained more than one hundred of its engineering, maintenance, and contract administration personnel on how to specify, administer, and inspect an insulation project. This makes the entire refinery better able to get value for each insulation dollar and helps ensure a long-lasting, efficient insulation system.

Sunoco R&S and Mike Sanders have been doing these projects since about 1999 but view it all as a work in progress. Refineries are simply too large-nobody has the budget to tackle everything at once. However, with more than $5 million in energy savings already realized, plus a better running and safer workplace, they intend to keep at it!

Figure 1

Exchangers—Pre-Project

Figure 2

Exchangers—Pre-Project

Figure 3

Exchangers—Post-Project

Figure 4

Exchangers—Post-Project

Figure 5

Exchangers—Post-Project

Figure 6

Exchangers—Pre-Project

Figure 7

Exchangers—Pre-Project

Figure 8

Exchangers—Post-Project

Figure 9

Exchangers—Post-Project

Figure 10

Process Equipment—Pre-Project

Figure 11

Process Equipment—Post-Project

Figure 12

Steam Piping Header—Pre-Project

Figure 13

Steam Piping Header—Post-Project

Emissions will be a topic of concern for many years to come thanks to the Environmental Protection Agency’s (EPA’s) Clear Skies Act and the ever-growing preference for coal fuel. Interest in coal is increasing because it is easily transported and costs about $3 to generate 1 million Btu, compared to more than $7 for the same amount of natural gas or oil, according to the U.S. Energy Information Administration. To meet the goals of the Clear Skies Act, the power industry will spend more than $50 billion on new air pollution equipment over the next decade.

Insulation and lagging are key components of these air pollution systems. As with any major component in a large construction project, job planning for installing insulation and lagging is key to the project’s success in finishing under budget and ahead of schedule.

The better a job is planned, the better the chances of meeting project goals. Construction and scheduling requirements make an emphasis on insulation and lagging increasingly important. Insulation and lagging are no longer being installed at the end of the project on completely erected air pollution systems. Instead, the norm now is either to install the insulation and lagging during fabrication of the air pollution equipment and flues on the ground at the plant, or install them before the air pollution equipment and flues reach the plant.

Any delay or problem with the insulation and lagging system could impact the entire construction schedule, and a successful insulation and lagging job begins with good planning. The following steps should be considered to successfully plan a lagging and insulation project.

1. Understand the Job Scope

Prior to starting a job, each and every detail of the application must be understood. This means reviewing all contract specifications and drawings; and, given the opportunity, completing a job site visit. If a job site visit is allowed, it is always beneficial to read and review all drawings and specifications beforehand. This will clarify the job scope. Even if no visit is scheduled, site conditions must be taken into account because they will affect man loading, material handling requirements, and expected productivity.

2. Recognize That Layout and Take-off Work Are Essential

Project layout and take-off work are essential for labor control, material handling requirements, scheduling, and productivity expectations. The take-off and layout work will most likely be done from arrangement and detail drawings, although field measurements also may be required. These layouts and take-offs will act as a control document and a source of information to help verify that all contract specifications and requirements are being met. They also can be of great value as historical documents, offering an advantage when putting together bids on similar work in the future.

3. Review Material Handling

Proper material handling also is important and will help attain the expected work productivity. Having materials available at the specific work locations will eliminate wasted time. Unfortunately, space is usually at a premium, and material storage is most often far from the actual installation area. The materials stored in these areas must be protected from the weather.

Bringing materials from a storage area to a specific work location can sometimes be difficult, especially if the weather has caused sloppy work conditions. Regardless of the conditions, plan ahead. One rule of thumb: Have enough material at work elevation (or within one elevation) for the entire work shift. This will ensure that there are no wasted man hours. No matter how difficult it is to bring the materials to the work location, materials must be at location for the work to be completed.

4. Know Your Craft Labor

Being familiar with the labor crafts working in and around the work area is vital because labor will make up 65 percent or more of the installation costs. Cooperation between the labor crafts is a must for a smooth-running job. Without coordination of craft labor, there will be confusion at the work area; loss of productivity; and, most importantly, unrealized goals. Different crafts claim different parts of the work. Special attention should be given to understanding the distinctions of each craft. For example, on a craft union project, the welding of insulation and lagging attachments might be claimed by several crafts, depending on what the attachment is being welded to (e.g., air pollution plate, flue work plate, or external stiffener). This is referred to as the "first weld." This concern is especially true for a project using craft labor from a union. Each union has its own unique job classifications and bylaws.

For a misunderstanding (jurisdictional dispute) to develop, there must be competing claims for the same work. To prevent such disputes, each union writes up an agreement that defines crafts and area jurisdiction pertaining to their union and craft. However, this does not in itself prevent a jurisdictional dispute between two or more rival unions competing for the same work.

When there is a dispute, an agreement or amendment must be written and agreed upon by the disputing unions that clarifies the issue. For example:
A dispute occurred between the Boilermaker Union Local 27 and 363 and the Asbestos Workers Union Local 1. The dispute was over who will claim the installation of fasteners used for installing of insulation. Insulation requires a fastener that must be welded to the surface of the to-be-insulated surface. The two sides reached an agreement that the Boilermaker will do all stick welding (sometimes called tack welding) on all Boilermaker installations for the purpose of fastening insulation (i.e., boiler and furnace membrane walls).

The above scenario is based on an actual jurisdictional dispute between two unions. The end result was a settlement agreement between the two unions.

Another possible labor problem would be disagreement on craft jurisdiction within a union itself. Craft jurisdiction is a claim to exclusive control over the type of work performed by union members in a given territory, and exclusive right to organize employees performing the work of that trade within a definite geographical area. The difficulty arises when a union is made up of a number of different crafts and two or more crafts within the same union claim responsibility for that work.

The point is that when a labor issue comes up, it can slow or stop a project. One way to eliminate any potential labor issues is for the respective unions to agree to work under the National Maintenance Agreement. In short, the agreement states that all parties (customers, unions, and contractors) agree that there will be no strikes, lockouts, work stoppages, or picketing arising out of any jurisdictional disputes. Work will continue, as originally assigned, pending resolution of the dispute.

5. Estimate Expected Productivity

Estimating work productivity will allow good field control. The initial expected productivity will be based on experience, past studies, and established database. Properly calculating the productivity is the difference between making and losing money. A key to calculating realistic productivity for field labor is to have a pre-job meeting and a walk-down of the entire plant area with the field supervisors. The supervisors are important because they oversee the individual crews and will have the most impact on the ability to reach expected productivity levels. Their familiarity of the local work force will help get the job done on time.

A walk-down and meeting with field supervisors also provides an opportunity to discuss expected productivity (e.g., square foot of coverage per day), craft responsibility breakdown, and material handling requirements. This will ensure that the field supervisors and project manager/superintendent are on the same page, ready to monitor specific work areas quickly and effectively with little or no misunderstanding as to the expected productivity needed to meet schedule.

6. Man-load Each Work Area

Man-loading specific work locations is key for a smooth-running job. It will help to ensure a continuous flow of work, with each work process flowing easily into the next (attachment application, insulation application, and lagging application). The specific work area must be scrutinized and planned to ensure a well-managed job. Nothing can be overlooked, including the amount of space available for material storage, the accessibility to unreachable areas, and the amount of workspace available for pre-engineering that can only be done at the site. Such pre-engineering is required for the lagging installation (flashing of seams, corners, penetrations, and openings requires special, pre-formed shapes and sizes).

Always break down an air pollution system and flue work by the wall, and draw a sketch or layout of each wall area. Add to this sketch the square-foot area, quantities of attachments, material types and thicknesses, number of crew required, expected productivity for installing each component of the system, and how many days it will take to complete. This layout will become a useful tool for monitoring the work area for proper installation, checking on the progress of the work, answering questions, and billing (percentage of work complete).

7. Set up a Layout Area

In addition to man-loading work locations, having a layout area at or near the work location will keep the work flowing. After calculations at the layout area are finished, the calculations and/or sketches are taken to the sheet metal shop for fabrication or used right at the work area for cutting and fitting. Just like the scaffolding, pre-engineering done at the layout area is very important and must be in place prior to starting the work. The key point is to eliminate any wasted manpower. Air pollution systems, along with their flue work, are quite large and require major cutting and fitting on the outer rib lagging and the doors. They also have extensive flashing requirements.

It is highly recommended that flashing around corners and doors be field measured and fabricated at the site. This ensures a proper and tight-fitting lagging system. Two workers doing this together can easily keep ahead of a crew to lay out around the corners and doors and get the material cut, broken, and bent to the work location before the crew is ready to install.

Conclusion

Problems occur even on the best-planned jobs. However, following the above steps will help minimize the possibility of problems occurring and can only enhance the chances for a successful and profitable project.

A year ago, the industry was buzzing about how the availability of commercial and industrial insulation materials was taken for granted until two catastrophic fiberglass manufacturing facility fires in 2003 created a disruption in supply.

The disruption affected not only the fiberglass segment but also alternative materials segments, as they stepped forward to fill the void. Importing and the acceptance of foreign manufactured materials became immediately more agreeable. The effect of those fires changed the way many professionals examine supply chain alliances, and how they view demand versus supply or manufacturing capacity. Now, a year later, what is different? Have those views changed?

Domestically Manufactured Materials Versus Demand

This topic has many components and an unexpected degree of complexity. For the purposes of this article, “domestic manufacturing” is defined as materials being manufactured by the associate members of the National Insulation Association (NIA) for the “NIA World.” The term “NIA World” encompasses the commercial and industrial insulation market segments, which include all facets of mechanical insulation, a significant portion of commercial building insulation, metal building insulation and a portion of the heating, venting and air conditioning (HVAC) market. It is generally accepted that the NIA World does not include the majority of insulation-related activities in the HVAC, residential, original equipment manufacturers, automotive, appliance, aerospace or other specialty markets.

Overall, there appears to be sufficient capacity in all domestically manufactured material groups to meet the expected demand in 2006 and beyond; however, this subject requires some explanation and discussion.

The two manufacturers that suffered the most direct impact of the 2003 fires should be commended on their recovery efforts. They remained committed to the industry and devoted the resources necessary not only to replace but to expand their lost capacity. The details of how they accomplished their recovery are beyond the scope of this article. However, it is estimated that depending upon the product line, they have recovered between 70 and 100 percent of their pre-fire capacity. In addition, when the new and expanded plants and production improvements are complete, overall industry-manufacturing capacity will exceed pre-fire levels.

Other companies also should be commended for their commitment to the industry and for stepping forward to fill the supply void. These are the other suppliers of fiberglass and materials including calcium silicate; perlite; cellular glass; elastomeric and polyethylene foams; mineral fiber wool; and polyisocyanurate, polystyrene, phenolic, melamine, polyolefin and polyimide foams. Without these suppliers’ efforts, a bad situation would have been much worse.

Most insulation manufacturers that participate in the NIA World also support other industry segments. This is normally not a concern. When other markets—such as the residential market—are stronger, however, some production line or manufacturing capacity can be diverted from NIA World materials to those consumed in the stronger markets. The issue is simply tied to the law of supply and demand and is intertwined with corporate-shareholder objectives to increase profitability. The NIA World materials are competing for production time within their own manufacturing facilities. This is a long-standing conflict that sometimes affects one or more channel participants and materials. In a world where all market demands are relatively consistent and product line profitability between markets is similar, this is not a problem. Where is that perfect world, though? Businesses certainly do not operate in that perfect world.

The internal competition of product lines has created extended lead times and planned availability. Even allocation has occasionally occurred with some manufacturers within specific product lines. 2005 is no exception. These situations have created a variety of hardships for all channel participants and have challenged some relationships. Although the challenges are generally viewed as short-term and manageable, not all would agree with that generalization.

The Acceptance of Foreign Manufactured Materials

Without question, the NIA World became more amenable to the acceptance of foreign manufactured materials following the 2003 fires. That applies to all materials. The question that remains, however, has to do with the quality of those imported materials. Are they equal to or superior to domestically manufactured materials?

Several manufacturers that are major contributors to the U.S. market also have plants outside the country. These companies routinely supplement their U.S. manufacturing from their domestic plants. This practice has existed for years, but increased in the post-fire era. The discussion of equality in this article is not focused on those materials, but on the materials that are imported through a variety of other channels.

Some domestic manufacturers are importing materials from China, India and other countries. Marketing and financial reasons motivate those manufacturers to ensure that those materials are of basic equal quality to their domestic manufactured materials and are acceptable in the market. Overall, this has worked quite well. If anything, it has improved the quality of those imported materials over time.

Some materials continue to be imported by companies—basically brokers—that resell them, and by a few distributors or contractors. Has that quantity grown to be of significance? Probably not. Immediately following the fires, the quantity of imports increased dramatically, but that has since decreased. By some estimates, they may now have a 1- to 2-percent U.S. market share, but that number cannot be verified. The more relevant question is, Will imports continue to add to the supply?

One of the possible long-term effects of the 2003 fires is an adjustment in the way companies examine supply chain alliances, how they view supply versus demand and their concern for supplier dependency. These factors alone may drive the continual investigation of the value of imported materials, which will, in turn, affect the continual presence and threat of foreign manufactured materials. Numerous factors—including many outside the control of the NIA World, like the value of the U.S. dollar, globalization of the market, manufacturing or exporting subsidies by other countries, worldwide demand versus supply, tariffs, cost of energy, politics, etc.—will directly affect how many materials are imported.

Acceptance of the quality of imported materials is, however, in the control of (or at least significantly influenced by) NIA World participants. Companies that consider using foreign manufactured insulation materials should continually raise a caution flag. They need to ensure that the composition, quality and performance standards of those materials are measured on the same basis as domestically manufactured materials. Many imported insulation materials are equal to or at least generally comparable to U.S. materials, but others are not being measured to the same standards. If those materials that are “assumed comparable” are indeed inferior and ultimately fail, the industry pays the price. And if a material does fail, are its manufacturers or importers there to back it up? This is an interesting question, for which there are various responses.

Imported Materials and Their Potential Effect on the Supply Channel

The supply channel today is very typical of a standard distribution channel model. However, it was not always that way. During the past 10 to 15 years, manufacturers have become more supportive of the distribution channel and have turned away from directly selling to contractors and others. It is now estimated that 90 to 95 percent of material purchasing in the NIA World flows through the distribution channel. This has allowed each of the channel participants to focus on their specific area of expertise: manufacturing, distribution or contracting. Many believe that this has streamlined the supply chain model and helped to increase earnings at all levels.

What happens when importers cannot find support or gain acceptance within the distribution segment? Will they try to go around distribution and “sell direct?” That approach, although threatening and certainly disruptive in the short term, would in all likelihood not succeed on a wide-scale basis in the long term, due to the opposing views on extended shipping intervals, minimum shipment quantities and overall service requirements. Even if importing companies were to establish a distribution center or a series of warehouses, many of the same obstacles would present themselves. Of course, there are exceptions.

The other possibility is that importers could turn to distribution companies that are not currently participating in the NIA World and, accordingly, be the catalyst for enticing them to “cross over” into the NIA World. Crossover strategies, in both directions, are not new to any segment of the industry. Many contractors, probably the majority, perform work outside the parameters of the insulation industry—work like painting, scaffolding, general mold removal and even demolition. Distributors are crossing over in a similar manner with products such as building materials generally used in the residential and HVAC markets, exterior insulation finishing systems, etc. Manufacturers, as previously discussed, support and participate in multiple markets.

Do crossover strategies work? The answer depends on who is asked. As a general rule, the strategies can work well for contractors who have proven supervision and an experienced work force. It is not quite that simple for distributors, though. If the crossover strategy is based upon a single material or an incomplete product line, it can be distributed extremely easily on multiple fronts and is normally contained to local markets or even specific customers. The more primary insulation or accessory materials available to a distributor, the more real the possibility of a meaningful crossover.

Independent manufacturer representatives can be the information nucleus for importers in identifying potential distribution, direct-sell and crossover candidates. What has always been interesting in the industry is the number of varied and sometimes conflicting objectives between the industry segments and the people who work within them. Each fills a vital role, but sometimes they resemble the Abbott and Costello routine, “Who’s on First?”

Importers that employ and solely rely upon a crossover strategy have a long and tough road to follow. However, the crossover option will always be an attractive alternative that many will investigate and pursue. Crossovers could have a profound effect on the long-term profile of the commercial and industrial distributor and contractor segments and, accordingly, the industry.

Are Material Costs Still Increasing?

Unfortunately, costs are continuing to increase. Energy and healthcare continue to lead the parade. Each channel participant strives to pass along cost increases in various forms, as they should. All channel participants should be entitled to make a fair and reasonable return on their investments relative to the risk they are incurring. Without passing through real cost increases on a timely basis, that theory is put to rest very quickly.

That said, it is the responsibility of companies in the channel to examine and address the cost components of their respective businesses, including productivity, to obtain their desired level of profitability. Relying solely on price increases to obtain targeted profit threshold is a dangerous strategy. The NIA World is highly competitive. Manufacturers, distributors, fabricators/laminators and contractors can attest to that. No one in the industry is immune to that reality.

Immediately following the 2003 fires, there were a number of price increases driven by cost. Many believe these were simply opportunistic. One should never put aside the opportunism angle, but let’s not forget about energy costs. The price of natural gas was increasing at double-digit annual rates back then, for example, and additional costs were incurred to respond to the disruption of available materials. In addition, other costs were still applicable. A more likely scenario was that the 2003 events motivated companies to more quickly and carefully examine costs, productivity and their product line and/or business unit profitability levels, which ultimately supported the need for increases.

There is still no statistical data, in units or dollars, related to historical, current or anticipated demand for the NIA World materials that are available in the public domain. As such, it is extremely difficult, if not virtually impossible, to reasonably measure overall industry growth (or lack thereof), or to determine if that growth was driven by units or dollars. Some believe that there has been some price erosion from the peak of price increases after the 2003 fires. Depending upon the product line and the person asked the question, unit growth has been flat to up 5 percent. The net overall NIA World market probably yielded a flat to 5-percent growth over the past year. However, many segment participants indicate that they are busier now than before September 11, 2001. Without statistical data, it is at best an individual guess based on personal experience, with results varying widely on a geographical basis.

Overall, however, the NIA World appears to be strong and is expected to have moderate unit growth in 2006, implementing additional price increases, with energy costs being the primary driver. Dollar growth is projected to be 2 to 4 percent higher than unit growth, which reflects moderate (depending on one’s definition of moderate) inflation. Some combination of unit and dollar growth could yield overall growth between 3 and 5 percent in 2006, with slightly lower rates expected in 2007.

Projecting growth rates in the NIA World always has been a troublesome task. Depending upon who is asked, what data is used, from what perspective the information is prepared and what geographical area the information encompasses, the projections can vary so widely that it makes one wonder if they all even relate to the insulation market. And, of course, projections always include the standard list of caveats. For consistency, the projections in this article are broad—industry-wide in scope—for the U.S. market. They come with the usual caveats.

Increasing Energy Costs and Insulation’s Role

Insulation is the Rodney Dangerfield of energy conservation initiatives in the commercial and industry market sectors; it gets “no respect.” With today’s high cost of energy, industry participants are baffled over why companies are not knocking down their door with requests for quotes or at least a serious desire to explore how insulation can help reduce their energy costs. Energy conservation is a major focus of the residential sector. Why not the commercial and industrial sectors?

When the price of gasoline was $3/gallon and higher, there was continuous discussion about the impact of higher energy costs on all sectors of the economy. Now that gasoline prices have dropped and remain between $2.25 and $2.50/gallon, the previous concern over the perceived crisis seems to be gone. Have companies accepted this pricing level and returned to their old habits?

Have the commercial and industrial markets just accepted insulation’s role as “it is what it is?” Or do they lack an understanding of the role that insulation can play in energy conservation, emission reduction, personnel safety, workplace environment improvement, increased productivity, etc.? Facility owners, engineers and architectural firms are investigating and spending mega-dollars on energy conservation initiatives like lighting, pumps and compressors, just to name a few. Why not insulation? It must be that the benefits derived from a properly designed, installed and maintained insulation system are invisible. The results are not measured on fancy gauges and graphs. Insulation is just not “exciting.” Maybe that’s the answer: Make insulation exciting!

Not to be misunderstood, insulation is being used for energy conservation on numerous applications. But insulation is not being utilized to its potential. Insulation has been taken for granted for a variety of reasons. The value of insulation gets little respect. The educational and awareness initiatives being undertaken by NIA leaders are extremely important. With education and awareness comes increased opportunities, which equates to industry growth and the respect this technology deserves. Is that one of the primary reasons the residential sector is successful? Have continual and repetitive industry-wide education and awareness initiatives clarified and marketed the value of insulation? Think about it.

Other topics worthy of contemplation as they relate to material supply and demand, costs and other aspects of the industry are:

  • Will interest rates stabilize or continue to increase? Will further increases slow construction activity?
  • Will energy costs continue to increase? Which energy form will lead the increase: natural gas, gasoline, electricity?
  • The United States continues to consume an enormous amount of energy. This will cause significant growth in the power segment. The questions are when, where and how much?
  • Will pollution control the environment and once again take center stage in some markets?
  • What will be the annual rate of inflation for 2006 and 2007— 2, 3, or 4 percent? Will energy and healthcare costs continue to be the drivers, or will a new area emerge?
  • Will the “green movement” continue to gain momentum? Does this movement provide new opportunities for mechanical insulation?
  • Will there ever be a meaningful federal energy policy that provides obtainable incentives for commercial and industrial energy conservation?
  • Will newly adopted state energy codes, and ones yet to be adopted, be enforced and have an impact?
  • Will industry consolidation once again gain momentum? If so, in which segments: manufacturing, distribution/fabrication or contracting?
  • Will the “big-box” distribution segment find a successful means to cross over and be a significant player in the NIA World? Or is the better question, When will this happen? If that threat should emerge or occur, how will industry participants respond to that challenge, and how will the profile of the industry change?
  • Will asbestos legislation ever be passed? If not, how will the companies with real or perceived liability ever rid themselves of that burden?
  • Many companies in the NIA World are considered “old line,” with ownership and/or management that may be approaching the time for an internal or family succession plan, or even the sale of the company. For others that may not be old line but are considering similar options for a variety of reasons, how will this change the profile of the industry and its participants?
  • What if there was a national plan and standards that provided the support, justification and technology for conservation of energy, emission reduction, increased worker safety, improved productivity and comfort and process productivity, etc., through better engineering and applied mechanical insulation? How would that affect industry growth and the professionalism of the industry?
  • Will there be sufficiently trained field work forces in the future or does the industry need to implement recruitment and training programs?
Insulation’s Future Looks Bright

Each of the questions asked above, and others related to the United States and global economies, can be addressed another day. Today, the NIA World is stronger than it is has been in years, and it continues to grow. The industry is not without its challenges, but the opportunities are abundant.

Based on the positive recovery from the 2003 fires, the number of new and expanded plants and the improvement initiatives that have been completed in the last year or will be completed in the near future, there appears to be sufficient capacity in all product lines to meet the expected demands. One might even envision a potential excess capacity scenario for certain products lines in late 2006 and into 2007.

Some may look back over the past year and conclude that not much has changed, while others will say that there have been many positive changes. This author believes the latter position is a more accurate assessment. The industry responded with enthusiasm and an unwavering commitment to a potentially destiny-changing event in 2003. That response truly demonstrated the resolve of all industry participants.

The industry has embarked on new initiatives to stimulate growth through education and awareness programs on the value of insulation. It has begun the task of addressing the problem of old and inadequate specifications, the lack of recognized and accepted application best practices, the confusion that exists over testing procedures, and the need for guidelines or standards that are universally adopted within the industry and by state and federal agencies. It has continued and expanded its outreach educational initiatives with allied organizations, which may include distance learning opportunities in the near future, even at the collegiate level. These activities and others occurred as the industry and the vast majority of its participants enjoyed a prosperous 2005.

This is an exciting time for the industry and the NIA. The NIA World is a good place to be.

Figure 1

Figure 1. Energy Costs—2005 (Average) Through 2007 (Projected)

Figure 2

Figure 2. Projected Increases in Winter Heating Expenses by Heat Source

Figure 3

Figure 3. 2006-2007 Projected Increases in Demand for Natural Gas

The National Insulation Association (NIA) is the premier resource for and voice of the insulation industry. Since 1953, NIA has provided practical and useful information about the value of insulation, its uses and applications, and its economic benefits to the commercial, mechanical and industrial markets throughout the United States and beyond.

Today, through its many methods of outreach, training and resources, NIA is bringing insulation to the forefront of “green building,” demonstrating how insulation is one of the best ways for businesses to save energy and reduce operating costs and, in turn, underscoring the organization’s importance and relevance to the industry. This article explores how NIA’s work continues to benefit the insulation industry, as well as professionals in many related fields.

Organizational Structure

NIA is an organization led and paid for, in part, by its 400-plus member companies, including contractors, distributors, fabricators, laminators, manufacturers and others who provide thermal insulation, insulation accessories and components to the nation. NIA members are some of the leading providers of top-quality products in the industry.

The association’s mission is to enable its members to increase their success and professionalism, grow the industry, advance standards by which the industry operates, and elevate the industry’s image. NIA provides selected services, education, training and information to its members as it works to advance and expand the industry. NIA also represents its members and the insulation industry, as necessary, before the federal government through advocacy, industry labor organizations and other groups.

NIA operates using a committee structure. Committees and task forces review and assess the issues affecting the insulation industry and recommend actions to the NIA board of directors, which then implements solutions.

Six regional associations collaborate with NIA to assist with membership development and outreach activities in the United States: the Eastern States Insulation Contractors Association (ESICA), Southeastern Insulation Contractors Association (SEICA), Midwest Insulation Contractors Association (MICA), Central States Insulation Association (CSIA), Southwest Insulation Contractors Association (SWICA), and Western Insulation Contractors Association (WICA).

NIA also interacts with international insulation organizations through meetings, programs of common interest, and information sharing. These organizations include the Thermal Insulation Association of Canada (TIAC); World Insulation and Acoustic Congress Organization (WIACO); and FESI, the European Federation of Associations of Insulation Contractors.

“By communicating with our regional associations and with the international organizations, we gain a better understanding of what is affecting the insulation markets and how trends are changing,” explains NIA Executive Vice President Michele Jones. “We then relay that information to our members and the industry.”

Outreach Efforts To Nurture and Educate Industry

As the voice of the insulation industry, NIA fosters outreach to other organizations and businesses that affect the industry’s growth and set trends. The NIA Foundation for Education, Training and Industry Advancement is playing the largest part in broadening that exposure. The NIA Foundation promotes the benefits of commercial and industrial insulation to end users such as specifiers, architects, energy managers, plant operators, building owners, facility managers, government agencies and others. The Foundation’s mission is to establish NIA as the recognized authority in the insulation industry, increase industry professionalism, provide educational tools and resources, and increase awareness of the need and benefits of insulation.

Through the Foundation’s efforts, NIA has been able to enter into strategic partnerships with several industry associations including the American Society of Mechanical Engineers (ASME); Plumbing, Heating, Cooling Contractors Association (PHCC); American Institute of Architects (AIA); Mechanical Contractors Association of America (MCAA); and Construction Specifications Institute (CSI). NIA’s partnership with each organization is customized to meet the needs of the organization’s respective members by providing relevant information that increases their awareness of insulation.

NIA is scheduled to do business presentations at many of these organizations’ chapter and annual meetings. NIA business presentation titles are “Insulation, the Forgotten or Lost Technology,” “Putting the Power of Insulation to Work,” and Innovations in Insulation Materials and Systems.”

NIA recently joined the efforts of the National Institute of Building Sciences (NIBS) and its newly established National Mechanical Insulation Committee (NMIC) for Building and Industrial Applications. The NMIC brings together major government agencies, private industry and organizations that are concerned with the design, installation and maintenance of mechanical insulation. NIBS asked NIA to lead this important committee, and former NIA President Ron King is serving as chairman.

The overall objective of NMIC is to identify, develop and disseminate information related to mechanical insulation in building and industrial applications by examining current policies, procedures and practices; identifying research or testing needs; developing recommendations using the best science and information available; providing education and awareness programs as to the merits and value of proper insulation systems; creating a roadmap to implement improvements in design and insulation system selection; and establishing application best practices.

NIA also is an associate member of the Alliance to Save Energy, which is a strong advocate for promoting energy efficiency to achieve a healthier economy, a cleaner environment and greater energy security. NIA is one of more than 90 corporations and business trade associations that work together through the Alliance to promote greater investment in cost-effective energy efficiency. Alliance associates participate in a range of programs and activities, including international trade and investment, the Federal Energy Productivity Task Force, and policy breakfasts with decision-makers and other noted speakers. NIA specifically has been involved in the Alliance’s BestPractices Steam Program and related workshops. Jones is chair of the Best Practices Steam Marketing Subcommittee.

Training and Advancing Technical Knowledge

NIA is the premier resource for seminars, continuing education classes and certifications for professionals who work with and maintain insulation systems.

The Insulation Energy Appraisal Program (IEAP), for example, is a fully accredited, two-day certification program. The program is a major industry initiative designed to give facility/energy managers a better understanding of the true dollar and performance value of an insulated system. The program quantifies the amount of energy and actual dollars a facility is losing with its current insulation system.

To date, more than 350 industry professionals have earned the title of Certified Insulation Energy Appraiser. Accreditation and third-party certification ensures that an energy proposal made by a certified appraiser will be viewed with more respect and credibility than an unsupported bid for products or services.

In the IEAP class, students learn how to evaluate the thermal performance of insulated versus un-insulated piping and equipment; determine the actual amount of energy and dollars a facility is losing with its current insulation system; interview customers to gather information for the appraisal; conduct a facility walk-through; use the 3E Plus® Insulation Thickness Computer Software Program provided by the North American Insulation Manufacturers Association (NAIMA); complete a final customer report; and market their new appraisal skills. The program teaches the appraisers to outline a facility in its current state of energy use and efficiency. They can also demonstrate scenarios that may improve energy efficiency and the environment, as well as save money.

The National Insulation Training Program (NITP) is another two-day program that covers all aspects of commercial and industrial insulation as a powerful technology for enhancing energy, cost efficiency and process performance. The objective is for students to acquire a working knowledge of insulation and insulation system design to avoid costly mistakes that result in system failures and injury of plant personnel. Students learn basic insulation science, systems design and materials, insulation thickness determination, general insulation system installation considerations, the specification process and insulation system maintenance.

NIA also offers a 3E Plus training workshop—a four-hour, comprehensive session that introduces users to all aspects of the 3E Plus software program. Users review program capabilities; the data necessary for appropriate insulation thickness calculations; and how the program calculates the energy, economic and environmental savings when insulation is applied to a process system. They also learn how to take advantage of some of the other options available in the program, such as how to customize insulation criteria by inputting specific manufacturers’ K-values. The hands-on session walks attendees through a series of commercial and industrial insulation system scenarios with various insulating criteria.

Finally, for 50 years NIA has provided its members and other visitors a tremendous opportunity for networking and education at its annual convention. In March 2006, NIA will host its 51st Annual Convention in San Antonio, Texas. The four-day event includes committee meetings, industry sessions, technical papers and keynote presentations.

Resources, Products and Services

Through its many resources and publications, NIA communicates its work and accomplishments and provides up-to-date information affecting those in the insulation industry.

In Insulation Outlook, NIA seeks to provide practical and useful information about the value of insulation, its uses and applications and its economic benefits. More than 7,000 professionals hold subscriptions to this premier monthly trade magazine.

The annual NIA Membership Directory and Resource Guide is a vital resource of contact information for all NIA members. The specialties of each contractor, distributor, fabricator and laminator are profiled in an easy-to-read grid, with geographical locations of headquarters and branches. Category charts in the Buyers Guide section list the various insulation products offered by our manufacturer members.

E-News Bulletin, NIA’s electronic means of communicating information, is a free, subscription-based service that delivers up-to-the-minute association news on such topics as training, meeting reminders, program and legislative updates, and more.

NIA’s “Products & Services” brochure provides an unparalleled annual list of publications, resources and services available from NIA and various organizations and companies to help professionals in construction-related trades build on their expertise and expand their knowledge of industry best practices. The “National Commercial and Industrial Insulation Standards Manual (5th Edition)” is one example from the brochure. Because of its wide acceptance throughout the United States and other countries, the insulation specifications and applications in this manual have become established industry standards, making the manual the definitive working tool for professionals involved in commercial and industrial insulation.

One of the most comprehensive resources NIA provides is its website, www.insulation.org. No other source delivers such a broad range of information on both the association and the insulation industry as a whole. Visitors can read current industry news, get updates on featured events and programs, access the membership directory, find out about industry job openings, read the organization’s published articles and research back issues of Insulation Outlook magazine. Visitors can also search the Manufacturers Technical Literature database, download the newly updated “Guide to Insulation Product Specifications,” shop the NIA bookstore, register for classes and much more.

2006 and Beyond

After more than 50 years working with other organizations and government and industry professionals, NIA—through its leaders and staff members—works diligently to raise public awareness of insulation’s critical role in increasing energy savings, protecting plant equipment and personnel, preventing condensation and excess heat and fire hazards, controlling excess noise and reducing greenhouse gas emissions, among other benefits.

“Through the support of our members and industry partners, NIA will continue to promote the value of the industrial and mechanical insulation industry,” says Jones.

Macroeconomic Situation and Outlook

As has been the story for the past several years, the U.S. economy in 2005 was driven by consumer spending and residential housing investment. The industrial sector gained traction during 2005, despite higher energy prices, and business investment accelerated. The economy added 2 million jobs in 2005, and the unemployment rate fell from 5.4 percent at the end of 2004 to 4.9 percent at the end of 2005. Consumer prices rose at a relatively fast 3.4-percent clip, as energy prices and core demand strengthened. In response, the Federal Reserve System continued its tightening, raising interest rates eight times, to 4.25 percent at the end of 2005. Overall, gross domestic product (GDP) grew by 3.6 percent during 2005.

As the economic cycle matures, 2006 will be characterized by moderating expansion. Look for GDP growth of 3.3 percent during 2006, as the business sector fuels growth and consumer spending slows. Stable gains in wages and job growth will support consumer spending in 2006. However, saddled with higher energy bills, higher minimum payments on their credit card debts and slower real estate price appreciation, consumers may be ready to cut back, especially for big-ticket consumer durables and expensive vacations. As a result, consumer spending is expected to grow by 2.8 percent in 2006, down from 3.5 percent growth in 2005.

Conditions are favorable for the business sector, which likely will advance 9.5 percent in 2006. Toward the end of 2005, new orders for non-defense capital goods such as machinery, transportation and business equipment were up by 18 percent from the previous year, suggesting momentum in business investment. Additionally, the ratio of unfilled durable orders to shipments, a measure of pent-up demand, was the highest since 2001.

Manufacturing capacity utilization is returning to pre-recession levels for many industries; and the manufacturing sector will benefit from global growth and a weaker dollar, which will spur exports. However, corporate profits will slow as businesses are squeezed by higher energy and other commodity prices. As the economy matures further, productivity growth will slow and unit labor costs increase. These higher costs, combined with slower revenue growth, will squeeze profits and dampen business-sector investment going into 2007.

Energy

Even before Hurricanes Katrina and Rita knocked much of the U.S. energy production infrastructure offline, energy prices were at historic highs for both petroleum and natural gas. The hurricanes caused unprecedented damage to the energy sector. According to the Minerals Management Service, by mid-January 2006, 26.5 percent of petroleum and 18 percent of natural gas production in the Gulf of Mexico remained shut-in. During 2005, petroleum averaged more than $56 per barrel, and natural gas prices averaged $8.40 per million Btu during the year.

As the imbalance between growing demand and constrained supplies grows in 2006, so, too, will energy prices. The Energy Information Administration (EIA) projects petroleum prices to average $63 per barrel and natural gas prices to average $9.90 per million Btu during 2006. Energy prices are projected to remain above historic levels for several years to come. This will provide added incentive for the business sector, which must compete globally, to make additional energy efficiency investments.

Construction Outlook

The star of the 2005 economy was the nearly unquenchable thirst for new housing (see Figure 1, Construction Spending). Low mortgage rates and the improvement in the labor market propelled the housing industry to a record 2.05 million housing starts during 2005. Spending on residential construction rose 11.2 percent in 2005, following an 18.2-percent increase in 2004. Higher mortgage rates, moderating income growth, and stricter credit rules are expected to chill residential investment in 2006. New housing starts will slow to a 1.85 million-unit pace, and residential construction spending will contract by 0.5 percent during 2006.

At the end of 2005, new orders for construction materials were up 3.3 percent on a year-to-date basis, indicating continued growth in the construction sector. However, as residential construction slows, nonresidential and public building will provide the growth for the construction sector, which is expected to grow by 2.9 percent in 2006.

Growth in nonresidential investment of 6.5 percent will be led by increases in office, retail and manufacturing construction. According to Reis Inc., a real estate research firm, the average vacancy rate for office rental space nationwide declined to 14.7 percent by the end of 2005, down from 16.3 percent at the end of 2004. The office rental market absorbed a net 61 million square feet of office space during 2005, and effective rents gained 3.2 percent for the year. Following several years of decline, office construction spending turned around in 2004. Corporate mergers and layoffs may have dampened demand for office space, but job growth will drive the market for office space in 2006. While some rebuilding of hurricane-damaged areas will occur this year, much of this investment will likely be postponed pending land use decisions. Continued improvements in the manufacturing sector will drive investment for new production capacity.

Public construction is another area for growth in 2006, as state revenues have risen during the economic growth. Of course, as the price of energy has risen so substantially in the past few years, many new projects may increase investments in energy efficiency, including insulation. One risk to construction growth is the cost of construction materials, which has risen more than other commodities in recent months. This could cause projects to be delayed.

Industrial Outlook

Industrial output in the first half of 2005 averaged 3.4 percent, bringing production levels in many industries back to where they were prior to recession (see Figure 2, Industrial Production). While output growth was slowing during the third quarter, it was the unprecedented double impact of the two hurricanes that knocked critical parts of the industrial sector offline during August and September. As energy supplies tightened and prices surged, the availability of many key industrial products was curtailed, including petrochemicals and plastics. Outgoing Federal Reserve Board Chairman Alan Greenspan remarked that these energy disruptions held down industrial production by 0.4 percentage points in August and an additional 1.7 percentage points in September. Nevertheless, industrial output growth resumed at the end of the year, and industrial production grew 3.1 percent during 2005.

Looking forward, industrial activity will continue to grow during 2006. Despite the cooling of the housing market, a key market for many industrial goods, the business sector will continue to improve, and spending on business investment in structures and equipment will grow at above-trend rates. Hurricane-related rebuilding also will generate additional demand for industrial goods. Look for industrial production to rise by 3.5 percent in 2006 and 3.2 percent in 2007.

Outlook for Insulation End-Use Markets Chemicals

Last year was a dramatic one for the $556 billion chemical industry. The industry was challenged from the start due to the high price of natural gas, a key input for petrochemicals, but customer demand was strong and the chemical sector grew at above-trend rates during the first half of the year. Then, it suffered a one-two punch during the hurricanes. First, Hurricane Katrina severely damaged the nation’s natural gas infrastructure, causing prices to reach above $15/MMbtu. Since approximately 70 percent of the U.S. petrochemical sector depends on natural gas feedstocks, many chemical producers felt the pinch of feedstock curtailments and price increases. Then Hurricane Rita struck, knocking out power and causing moderate damage to chemical facilities in the Beaumont, Texas, and Lake Charles, Louisiana, areas. As a result, chemical production in the Gulf Coast region declined by 19.2 percent in September.

Total chemical volumes fell by a modest 0.3 percent in 2005, with increases in pharmaceuticals, consumer products and specialty chemicals offset by a 6.8-percent decline in the production of basic chemicals, largely related to the hurricanes. Production of industrial gases, which was harmed by the hurricanes, declined 3.2 percent for the year. As the business sector continues to strengthen, chemical production will increase by 2.7 percent in 2006 and 2.9 percent in 2007, according to the American Chemistry Council (ACC). ACC projects further tightening of chemical capacity utilization rates during the next few years, which will drive capital investment.

Food Processing

A $520-billion industry, production of food, beverages and tobacco grew 2.0 percent during 2005. Like much of the industrial sector, capacity utilization in the food and beverage processing sector has tightened to pre-recession levels. Capacity utilization was above 80 percent by the end of 2005 for the first time in six years. Food processors were challenged by high energy prices and some temporary shortages of plastic packaging as the result of the hurricanes. Investment in food processing equipment will be driven by the growing demand for convenience foods, changes in food packaging, inventory control systems and food supply security.

Gas Processing

The 2005 hurricanes heavily damaged the gas processing infrastructure along the Gulf Coast. Following Hurricane Katrina, 5.55 billion cubic feet (bcf) per day of capacity was offline. At the end of 2005, 5.25 bcf per day of natural gas processing capacity was still inactive. Natural gas production is expected to have declined 3.1 percent in 2005, mainly due to the heavy damage sustained during the hurricanes. EIA projects that production will grow 3.8 percent in 2006 as demand continues to rise and remaining production and processing infrastructure is repaired.

Shipbuilding

Production of ships and boats was up 5.7 percent in 2005, a trend likely to continue as global trade continues to rise. An important shipbuilding market for insulators is refrigerated tankers to transport liquefied natural gas (LNG). As demand for natural gas has surged in the United States and worldwide, shipments of LNG are expected to increase dramatically over the next decade as remote reserves are put into production and gasification and transportation infrastructure is built. According to EIA, U.S. imports of LNG are expected to increase 375 percent by 2015.

Petroleum Refining

By the end of 2005, much of the crude oil refining capacity damaged by the hurricanes was restored. According to EIA, refinery capacity utilization rates will tighten from 93.0 percent in 2005 to 94.0 percent in 2006. Refinery capacity will grow from 17.0 million barrels per day to 17.1 million barrels per day during 2006.

Pulp and Paper

The U.S. pulp and paper industry continues to be challenged by increasing imports, competition with other materials for packaging and the increasing reliance on electronic communications and transactions. The U.S. market produced 41.3 million tons of paper in 2005, down 0.5 percent from 2004. Looking to the year ahead, plastics prices have risen due to higher energy feedstock prices, which may help some paper producers. However, any gains are likely to be offset slightly by dampening demand for paper due to postage rate increases. According to the American Forest and Paper Association, following several years of capacity contraction, capacity growth in the pulp, paper and paperboard industry will remain nearly flat through 2007.

Power

As with any modern economy, growth in electricity generation tracks economic growth. Electricity generation grew 3.0 percent during 2005 as the industrial recovery gained traction. EIA projects that electricity generation will grow by 1.4 percent in 2006 and 1.6 percent in 2007. Following a rapid capacity build during the past decade—especially of natural gas-fired generation—capacity growth at electric generators has moderated in recent years. According to EIA, only 70 gigawatts of electric generating capacity is planned through 2009. Not surprisingly, as natural gas prices are projected to remain historically high for some time to come, coal-based generation accounts for more than half of planned capacity additions in 2009.

Conclusion

The outlook is for moderate growth in 2006, with consumers, who have fueled GDP growth during the past five years, taking pause as the housing market cools. The business sector will take the baton and push the economy forward this year. Growth in construction spending will shift gears and be led by business fixed investment rather than by housing, and industrial output will continue its expansion as capacity utilization tightens and production grows beyond pre-recession levels. High energy prices remain a real risk both for consumers and businesses; however, they underscore the need for higher investments in insulation in 2006 and for years to come.

Figure 1

Figure 1

Figure 2

Key Indicators