The article “CUI: An In-Depth Analysis,” which appeared in the November 2006 issue of Insulation Outlook,1 described the mechanism of corrosion under insulation (CUI) for carbon steel and stainless steel, as well as prevention tools and techniques available to minimize CUI’s effects. This article, published in the September 2007 issue of Insulation Outlook magazine, provides a more in-depth analysis of the non-traditional—but perhaps more effective—CUI prevention measures.
Innovative Prevention Measures
Conventional techniques for preventing CUI, especially on carbon steel, rely on application of an organic coating. Expensive, non-destructive inspection is conducted periodically. After 3 to 7 years of service, the insulation often needs to be stripped and the carbon steel equipment prepared to be recoated and re-insulated. Emphasis is placed on designing and installing the insulation system to avoid water ingress on the metal surface. Many insulated 300 series stainless steel systems are inadequately being non-destructively examined, and only the design and installation of the insulation system is relied upon to prevent CUI. Some stainless steel systems also have been coated using an organic coating to act as a water barrier. The conventional CUI prevention techniques rely heavily on inspection and maintenance, and they are expensive. Often, the cost of inspection makes up more than 80 percent of the cost of recoating a pipe system.
In recent years, the CUI prevention philosophy of many large petrochemical companies has been an inspection-free, maintenance-free concept. Insulated systems—particularly piping systems—are expected to have a service life of 25 to 30 years. Evaluation of life-cycle savings has led to consideration of new, simple approaches to preventing CUI. Some of the newer techniques include the following:
- Applying thermal spray aluminum (TSA) on carbon steel to prevent general corrosion, and on austenitic stainless steel to prevent stress corrosion cracking,
- Using aluminum foil wrapping on austenitic stainless steel pipe to prevent stress corrosion cracking,
- Using duplex alloys for better stress corrosion cracking resistance,
- Using wire personnel protection cages in cases where insulation is used for personnel protection.
Thermal Spray Aluminum
There is no doubt that the reliability and lifetime of an insulated system is primarily dictated by the coating system. To achieve a lifetime of more than 25 years, corrosion experts recommend TSA for carbon steel. It has been documented that one TSA-coated vessel has been operating with wet insulation in CUI conditions for more than 50 years with no maintenance or recoating throughout its lifetime. It is highly likely that the use of TSA coatings will increase significantly in the petrochemical industries in the next few years.
TSA also works well in conditions too severe for organic coatings, such as temperature cycling above and below 300°F (149°C) for more reliable, maintenance-free service. TSA coatings can be used up to a service temperature of 1,000°F (537°C). It protects equipment by acting as a barrier and serves as a sacrificial anode, protecting the substrate at the sites of any chips or breaks in the coating.
The U.S. Navy has demonstrated that using TSA has substantially reduced the cost of its corrosion-control efforts aboard ships.2 Several large petrochemical companies have increased the use of TSA in their plants and have shown that large savings can be obtained based on life-cycle costs.3 Over a 20-year cost analysis, replacing or recoating an existing carbon steel pipe with a TSA-coated carbon steel pipe—versus replacement with painted carbon steel (which needs to be painted at least once during this period)—resulted in a savings of more than 100 percent.3 The development of more mobile thermal spray equipment with high deposition efficiency is likely to increase the use of TSA in the chemical processing industry.
Figure 1
Basic TSA Techniques
All thermal spraying processes rely on the same principle of heating a feedstock, accelerating it to a high velocity, and then allowing the particles to strike the substrate. The particles will deform and freeze onto the substrate. The coating is formed when millions of particles are deposited on top of each other. With TSA, these particles are bonded to the substrate mechanically.
The first step of any coating process is surface preparation. This is done by cleaning and white metal grit blasting the surface to be coated. Masking techniques may be adopted for components that only need specific areas coated. The second step is to atomize the aluminum, which is done by introducing the feedstock material into the heat source. The heat source may be produced by either chemical reaction (combustion) or electrical power (twin wire arc spray). Next, the particles are accelerated to the substrate by the gas stream and deform on impact to make a coating. Finally, the coatings are inspected and assessed for quality by either mechanical or microstructural evaluation.
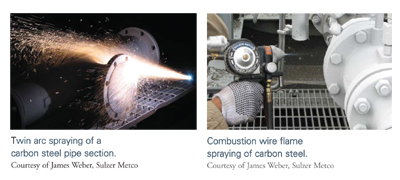
The two common thermal spray techniques used to apply TSA to components are wire flame spray and twin wire electric arc spray. Adhesion to the substrate is considered largely mechanical and is dependent on the work piece being very clean and suitably rough. Roughening is carried out by grit blasting to a white metal condition with a sharp, angular profile in the 50-to-100 micron (2-to-4 mil) range. Flame and arc spraying require relatively low capital investment and are portable; they are often applied in open workshops and on site. Consumables used for TSA with these processes are more than 99-percent purity aluminum wires.
Figure 2
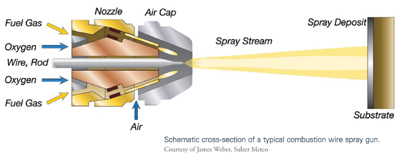
Wire Flame Spraying
This technique—the oldest of the thermal spraying processes—also is referred to as combustion wire or oxyfuel wire spray process. It is useful for applying relatively inexpensive coatings. A wide variety of materials can be sprayed by this process, and the vast majority of components are sprayed manually.
The wire flame spraying process employs a set of drive rolls powered by an air turbine or an electric motor to draw a metal alloy wire through the combustion spray gun. At the gun nozzle, fuel gas of acetylene, propane, propylene, or natural gas is mixed with oxygen in precise volumetric proportions using a siphon plug. It is then ignited to create a flame, which is shaped at the gun’s air cap by compressed air. The metal wire is fed concentrically into the flame, melted, and atomized by the compressed air. The molten droplets are propelled toward a prepared surface, where they solidify and bond to the substrate to form a coating. This technique is preferred to electric twin arc because of its greater than 90 percent deposit efficiency rate when spraying aluminum. In addition, it generates less smoke or dust.4
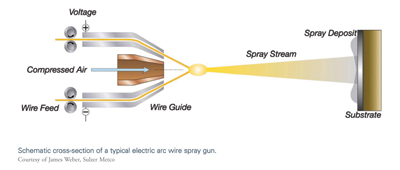
Twin Wire Electric Arc Spraying
The electric arc wire spray process uses two metallic wires, usually of the same composition, as the coating feedstock. The two wires are electrically charged with opposing polarity and are fed into the arc gun at matched, controlled speeds. When the wires are brought together at the contact point, the opposing charges create enough heat to continuously melt the tips of the wires. Compressed air is used to atomize the now-molten material and accelerate it onto the workpiece surface to form the coating. In electric arc wire spray, the weight of coating that can be deposited per unit of time is a function of the electrical power (amperage) of the system, and the density and melting point of the wire. Push, pull, or push/pull mechanisms can be used to feed the wire at a constant rate, depending on the columnar strength of the wire.4
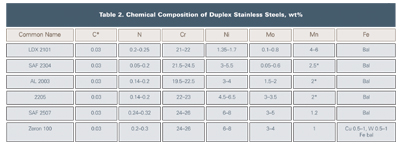
Figure 4 (Table 2): Chemical Composition of Duplex Stainless Steels
Aluminum Foil Wrapping
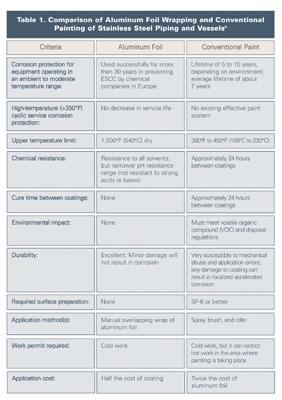
Aluminum foil wrapping of austenitic stainless steel has been used successfully for more than 30 years by chemical companies in Europe to prevent ESCC. (This technique has not been widely accepted in the United States.) The aluminum foil provides a moisture barrier and electrochemical protection by preferentially undergoing corrosion and maintaining a safe potential for stainless steel. The system relies on good weatherproofing and the prevention of immersion conditions. It can be applied by the insulation contractor, takes less time to apply than a coating, and requires minimal substrate preparation.
Wrapping pipe with 46 SWG (wire gauge) 0.1-millimeter (mm) aluminum foil can prevent CISCC of stainless steel pipe operating continuously between 60°C and 175°C. The pipe should be wrapped with 50-mm overlap, formed to shed water on the vertical line, and held with aluminum or stainless wire. The foil should be molded around flanges and fittings. Steam-traced lines should be double wrapped, with the first layer applied directly onto the pipe, followed by the steam tracing, and then more foil over the top. On vessels, the aluminum foil is applied in bands held by insulation clips and insulation support rings.5
The comparison between aluminum foil and conventional painting of austenitic stainless steel piping and vessels is illustrated in Table 1.
Figure 3 (Table 1): Comparison of Aluminum Foil Wrapping and Conventional Painting of Stainless Steel Piping and Vessels (Footnote 6)
Duplex Stainless Steels
To eliminate ESCC, higher nickel, chromium, and molybdenum-containing alloys (super stainless steels) and lower nickel/higher chromium duplex alloys can be used. These alloys are more resistant to SCC and resistant to ESCC under insulation. Although some of the duplex alloys are slightly higher in cost than the 300 series austenitics, analysis shows that the duplex stainless steel alloys (especially the lean duplexes) may offer a low life-cycle cost alternative.
Duplex alloys have seen a significant increase in usage in the chemical industry as end users and fabricators in North America have become more comfortable with them. Table 2 shows the chemical composition of the various duplex stainless steel grades. The duplex alloys are characterized by their austenite and ferrite microstructure, which results in high strength and excellent chloride stress corrosion cracking (CSCC) resistance, as well as localized and general corrosion resistance. The established 2205 duplex grade accounts for 80 percent of duplex usage, although newer duplex grades have been developed for niche applications.
The “lean duplex grades” developed in recent years include LDX 2101 (Outokumpu), SAF 2304 (Sandvik), and AL 2003 (Allegheny Ludlum). These alloys have low molybdenum additions and are less prone to sigma phase formation during processing. LDX 2101 uses manganese rather than nickel to obtain the proper ferrite-austenite phase balance. The corrosion resistance of LDX 2101 is considered better than 304L stainless and is, in most cases, comparable to 316L. Because of the alloy’s CSCC resistance, it is a good candidate to replace 300 series stainless steels where CSCC due to CUI is a problem. SAF 2304 is essentially a low-molybdenum, more cost-effective version of 2205. SAF 2304 has similar pitting and crevice corrosion resistance to 316L, but it offers far superior CSCC resistance. AL 2003 was designed to exceed the corrosion resistance of type 316 at substantially lower cost than type 2205 duplex. The alloy has similar localized corrosion resistance to 317L and offers superior CSCC resistance.
The highly alloyed “super” duplex stainless steels have found applications in the chemical industry are Zeron 100 (Weir Materials) and SAF 2507 (Sandvik). Apart from having excellent CSCC resistance, these alloys have similar localized corrosion resistance to the stainless steels that contain 6-percent molybdenum.7 Note that duplex alloys are less susceptible to CISCC but are not immune.
Figure 5
Wire Personnel Protection Cages
In many instances, thermal insulation is used for personnel protection from hot surfaces. The unnecessary use of thermal insulation creates a location for potential corrosion. In these cases, wire “standoff” cages should be used instead. These cages are simple and inexpensive, and they eliminate CUI concerns.
Conclusion
This article provides discussion of the current CUI prevention philosophy and the techniques being implemented by large petrochemical and chemical companies to address CUI. The problem of CUI directly affects insulation end users across industries, and these techniques and considerations can greatly benefit those who choose to implement them.
Acknowledgements
Members of the European Federation of Corrosion Committee EFC WP 15 and NACE Committee RP 0198 have been active in producing recommendations to prevent CUI. The author recognizes the efforts of respective committee chairmen Stefan Winnik of Exxon Mobil and Murry Funderburg of Shell Global Solutions. The author also acknowledges James Weber of Sulzer Metco for providing his expert advice on TSA coatings.
References
- (1) Hira Ahluwalia, “CUI: An In-Depth Analysis,” Insulation Outlook, Volume 51, Number 8, November 2006
(2) R. Parks and R. Kogler, U.S. Navy experience with high-temperature corrosion control of lagged piping system components using sprayed aluminum coatings, “Corrosion under Wet Thermal Insulation,” CORROSION 1989 Symposium, pp. 71–76, NACE Publication, Houston, Texas, 1990
- (3) B.J. Fitzgerald et al., CORROSION 2003, Paper No. 03029, NACE Publication, Houston, Texas
- (4) James Weber, Sulzer Metco, james.weber@sulzer.com, private communication
- (5) R. Smith, Eutech, Oral Presentation at Stainless Steel World Conference, Netherlands, 1999
- (6) European Federation of Corrosion (EFC) WP 15 Corrosion in the Refinery Industry, CUI guidelines. Not yet published as of September 2007.
- (7) Hira Ahluwalia, “Newer Nickel-Containing Alloys for Aqueous Corrosion Applications in the Chemical Processing Industries,” Stainless Steel World, Jubilee Issue, p. 68, Summer 2005.
Copyright statement
This article was published in the September 2007 issue of Insulation Outlook magazine. Copyright © 2007-2018 National Insulation Association. All rights reserved. The contents of this website and Insulation Outlook magazine may not be reproduced in any means, in whole or in part, without the prior written permission of the publisher and NIA. Any unauthorized duplication is strictly prohibited and would violate NIA’s copyright and may violate other copyright agreements that NIA has with authors and partners. Contact publisher@insulation.org to reprint or reproduce this content.
Disclaimer: Unless specifically noted at the beginning of the article, the content, calculations, and opinions expressed by the author(s) of any article in Insulation Outlook are those of the author(s) and do not necessarily reflect the views of NIA. The appearance of an article, advertisement, and/or product or service information in Insulation Outlook does not constitute an endorsement of such products or services by NIA. Every effort will be made to avoid the use or mention of specific product brand names in featured magazine articles.