Category Archives: Global

3E Plus is a highly promoted and widely distributed computer program used for calculating insulation thickness, energy use, emissions and cost savings for mechanical systems that require insulation. The North American Insulation Manufacturers Association (NAIMA) created the program and recently released Version 4.0. The software is being promoted as a universal tool applicable to all insulation types. This article will address some of the drawbacks to the program, which, if used carefully can be an extremely useful tool; however, as this article will demonstrate, the 3E Plus® insulation thickness program must be modified to avoid generating misleading and erroneous information.

ASTM Standards

Listed below are some of the disclaimers published in the material standards of ASTM International (originally known as the American Society for Testing and Materials). Their message is clear: the properties listed in these standards are to be used for material specifications and not as design values for engineering purposes.

  • “This standard is designed as a material specification, not a design document.” (ASTM C591-01)
  • “The values stated? may not always be appropriate as design values. For specific design recommendations using a particular product and for supporting documentation, consult the manufacturer.”(ASTM C534-03)
  • “Thermal conductivity tests shall be used for classification purposes only.”(ASTM C 1126)
  • “Note that the apparent thermal conductivity requirements in the table are based on samples tested under the conditions specified in 12.1.2. These are comparative values for establishing specification compliance. They do not represent the installed performance of the insulation under use conditions differing substantially from the test conditions.”(ASTM C533-04 and C552-03)

Despite these disclaimers, the default thermal conductivity values used for insulation listed in 3E Plus are taken directly out of ASTM material standards. The thermal conductivity values listed in the standards represent the maximum acceptable value of any given sample of a particular insulation as manufactured. Therefore, the use of the ASTM maximum thermal conductivity values in the 3E Plus program can lead to results that call for larger insulation thickness (in some cases more than 1 inch greater) than is really needed. Users need to know and remember to first load the manufacturer’s recommended design values, which represent the actual properties of a particular product as an average as opposed to an entire group of samples.

Could Some Insulation Materials Gain Unfair Advantage?

Users might assume that using the software will “level the playing field” for different types of insulation materials, but that is not the case. For example, the cost of closed-cell insulation is usually significantly higher than fibrous insulation. Any computer program that recommends greater-than-necessary insulation thickness will have the unintended result of widening the cost disparity in comparing alternative systems.

Consider, for example, a 6-inch line operating at 25 F (-4 C) with an 80 F (27 C) ambient temperature, 80 percent relative humidity, and 2 mph wind. Using the default thermal curve contained in 3E Plus for “Cellular Glass Pipe C552-00 Gr 2,” the resulting data indicates 2-inch thick cellular glass pipe insulation (with metal jacket) is required to prevent condensation in these conditions. If the manufacturer’s design values for cellular glass insulation are used, the results indicate 1½-inch thick cellular glass is needed to prevent condensation. The extra ½ inch called for when using a thermal curve generated from ASTM maximum K values represents a 30-percent increase in the material cost of the insulation system. In an ideal world, the increased insulation thickness is a positive: the system will be more efficient and will be protected from condensation in more extreme conditions than it was designed to endure. However in the real world of value engineering, tight budgets and competitive pressures, the extra half-inch thickness is more likely to get a particular product eliminated from the project.

As another example, consider a 16-inch chilled water line operating at 40 F (4 C) with an ambient temperature of 90 F (32 C), 80 percent relative humidity, and 2 mph wind. According to 3E Plus Version 4.0, 1½-inch thick polyisocyanurate (PIR)—with all-service jacketing—is required to prevent condensation in these operating conditions; yet at least one manufacturer’s literature recommends 1-inch thick PIR for these conditions. In this case, using the 3E Plus data would eliminate PIR from consideration on any projects that require ASTM E 84 25/50 flame spread/smoke development surface burning characteristics, since PIR systems are currently limited to a maximum of 1-inch thick when ASTM E 84 25/50 is a project requirement.

Solution: Place Design Values in the Program

One solution is for users to enter the manufacturer’s recommended design values in the program at the beginning. However, this can be time consuming and requires each user to take the initiative to obtain the design values from each insulation manufacturer and enter them in the program.

In order for a user to insert the design values, the following steps are required for every insulation material added to the program:

  1. Open 3E Plus Version 4.0 and click on the “Options” tab.
  2. Click on the “Insulation Materials Maintenance” tab.
  3. Click on “Add” to insert a new insulation into the program.
  4. Enter the name of the new insulation material.
  5. Enter the material’s maximum-use temperature in the”Max Temp (°F)” box and the minimum use temperature in the “Min Temp (°F)” box.
  6. Click the down arrow in the “Active” box and select “True.”
  7. Click the down arrow in the “Generic” box and select the generic material type.
  8. Select either “Paired Data” or “Polynomial Constants” in the “Conductivity Data Type” box, as indicated by the manufacturer.
  9. Enter the data from the manufacturer, then click “Apply.” The new material will be added to the bottom of the program’s material list.

Currently, users who download the program directly from the NAIMA website see no indication that they need to contact insulation manufacturers for recommended design thermal conductivity values. The program does not state that the default thermal curves may not be in agreement with the manufacturers’ recommendations. An enhancement for future versions would be to include manufacturer’s design values from the start. At least one engineer interviewed for this article observed “?it is unlikely that engineers will take the time to modify the program. Engineers will expect the program to be correct out of the box and will use it that way.” At the very least, a note in the download instructions (or somewhere else in the program) should warn users that insulation manufacturer’s recommendations may differ from the results of the 3E Plus program, and they should consult the manufacturer for design information.

Instructors of the National Insulation Association (NIA) 3E Plus training classes do inform students that they should contact manufacturers to get the best data available on a product. It is unlikely, however, that everyone using the program will take the class.

Other Program Issues

Another issue with 3E Plus is the warnings that appear if the program is run using insulation in conditions outside the manufacturer’s recommended temperature range. In this case, one of the following warnings will appear.

  • The insulation has a minimum temperature that is higher than the process temperature. Please use caution.
  • The insulation has a maximum temperature that is lower than the process temperature. Please use caution.

Despite issuing a warning, however, the program still will generate values. For example, it will generate a recommended thickness for personnel protection using phenolic foam on a line operating at 1,000 F (537 C) even though the maximum use temperature for the product is 257 F (125 C). The warnings are good and should deter anyone from actually using this data, but it would send a stronger message if the program was designed to prevent such data from being generated.

In addition, 3E Plus generates data for insulation thickness starting at 1/2 inch, increasing by half inches regardless of insulation type or pipe diameter. Some insulation is not available in thickness less than 1 inch, while other insulation, (e.g., elastomeric) is available in 1/4 and 3/4–inch thickness. A possible point of confusion, then, is that the program output will include 1/2-inch and 1-inch thickness for cellular glass insulation on a 36-inch diameter line, even though the manufacturer’s minimum recommended thickness at this diameter will be 1½ inches.

Finally, the examples of 3E Plus issues related to cellular glass, elastomeric, PIR and phenolic foam insulation discussed in this article may indicate that similar or other issues exist with other products such as polystyrene, perlite, calcium silicate, etc. 3E Plus users should contact the respective manufacturers for verification of their product’s design values.

Conclusion and Recommendations for Future Versions of 3E Plus

Although 3E Plus is potentially one of the most valuable tools recently developed in the insulation industry, the new Version 4.0 does not address these issues or potentially other important product issues. Those taking the NIA software training courses will be informed about how to customize the program and enter thermal curves with the manufacturer’s data. A better solution, though, would be for the software to include manufacturer’s design thermal conductivity values. That, along with the other modifications suggested above, could greatly improve the 3E Plus program and provide users more accurate and cost-effective insulation recommendations.

Insulation Outlook recently spoke with tape manufacturers about the basics of proper use and maintenance of tapes in mechanical insulation systems and asked for their forecasts on the future of tape manufacturing.

The Role of Tape in the Insulation Industry

According to Darrell Peil, national sales manager for Ideal Tape Company, Inc., the main role tape products play in the mechanical insulation arena is to protect the owner’s investment in insulation. For many systems, particularly those that operate at cold temperatures, condensation is a major concern. Tapes complete the vapor barriers (vapor retarders) so that moisture does not penetrate and destroy the insulation.

While an industry guide is not available, consumers can research manufacturers technical literature (MTL) online either using the MTL Online (www.insulation.org/MTL) resource or going to the individual manufacturer’s website where most companies offer detailed listings of their products’ specific capabilities and applications. Ed Sore, a product manager at Venture Tape Corporation says “There are about 50 different insulation tapes available… Realistically, there are only a few dozen ?workhorse’ products; however, every application is different and every manufacturer is different, and therefore we see hundreds of different tapes in the industry.” Peil says that some of the ?work horses’ currently used in the industry, include polyvinyl chloride (PVC), foil/scrim/kraft (FSK), smooth aluminum foil, filament, cloth, white metalized propylene (WMP) and all service jacketing (ASJ) tape. Smooth aluminum foil, for example, has a number of different applications. It is considered a standard vapor barrier product for any kind of insulation material used in the industry. FSK is designed to be a cost-effective type of finish system that is usually more concealed; while ASJ provides a neat, clean-looking finish for the insulation system. While all are designed to complete the vapor barrier, they also do it in a way that matches the finish. Peil notes that insulation is the finished appearance of the mechanical system. While the goal is providing protection, customers are more satisfied if the system looks good and they can actually see the value in their investment.

Recent Trends in Taping

Current trends in taping, according to Peil, include different facing stocks. There is a drive in vapor retarders to go toward more plastic materials, getting away from paper-based materials. Users are looking for high-performance adhesives with higher bond strengths that can operate in extremely low and extremely high temperatures as well as in difficult environments.

Users are also looking for installer productivity improvements—especially those that can translate into decreased labor costs. Sore says, “In the future, all insulation tapes will include mold-inhibiting features. This helps prevent a host of problems from occurring. The trend will continue to find ways to save labor costs. Typically, jobs are 60 percent labor and 40 percent materials. Speeding installation and reducing labor costs for insulation contractors will continue to be the standard.” Ben Wong, vice president of sales and marketing at Compac Corporation, agrees that future focus areas include improving mold resistance and the contactor productivity. He believes that other hot products will be tapes “that will match the future generation of the jacketing the customers will be using. I believe a lot of the customers are concerned about mold and the mold-resistant properties in the tapes.”

Players in the Tape Industry

According to Peil, there are four or five tape manufacturing companies participating in the National Insulation Association (NIA) world today. The three primary suppliers to the NIA membership are Ideal Tape Company, Inc., Compac Corporation and Venture Tape Corporation.

To find out what new insulation products are being developed, and thus ensure that his company is aware of trends and innovations, Peil turns to insulation manufacturers such as Johns Manville Corporation, Owens Corning, Knauf, CertainTeed Corporation, and Manson Insulation, Inc. Says Peil, “They are the companies that typically drive things.”

Peil also tries to keep in touch with other manufacturers and contractors to find out what their customers are asking for. “One of the things I’ve promoted for the past 15 to 20 years,” Peil says, “is that mechanical construction is about systems construction. If any one particular component—be it the insulation, be it the tape, be it the jacketing—is not designed correctly or is not installed correctly or is of low integrity, the whole insulation system is only as good as the weakest link.”

Choosing Tape

According to Peil, one of the key differentiators that distinguishes a quality product is its adhesive property—how strong the adhesive is and how high and low a temperature it will withstand. There are different kinds of adhesive-type tapes in the industry at present: rubber-based adhesives and acrylic adhesives. Peil predicts, “We’re going to get into other areas of adhesives as products change.”

Also important is the actual material the tape is made of. There are varying degrees of thickness, and thicker material is usually better quality. How quickly the product sticks to the insulation when it is applied is another consideration. In terms of the actual adhesive application to the tape substrate, there are several methods for applying adhesive to tape, and some work better than others. Some provide more uniform adhesive coating, and some provide better bonding of adhesive to the tape material.

To determine which tape is right for a given job, Peil advises asking customers what they are trying to accomplish, what they currently have in place and what problems they are seeing. Many questions need to be answered, including what kinds of operating conditions the tape will be subjected to—how high and low a temperature it will experience, will it be indoors or outdoors and are there chemical environmental concerns. The last point is important because chemicals (as in a chemical plant) are typically used to remove adhesives.

Installation Considerations

It is important that installers be well versed and educated in working with tape. The biggest mistake is when an insulation contractor or installer applies the tape and then uses staples to secure it. Peil stresses that no additional adhesives or coatings should be put on top of tapes. Tapes are designed and manufactured to give “all of the needed adhesive at a very high-quality, high-bond strength to stick that tape in place.” Staples and other unnecessary fasteners can compromise product soundness.

Problems also occur if an installer uses a solvent-based adhesive. The solvent actually softens and weakens the adhesive in the tape. Peil observes, “Where they think they’re doing a better job, they are in fact reducing integrity of the job.”

Sometimes installers will try to put the product on dirty or wet surfaces, but pressure-sensitive tapes are not designed to go over such surfaces. Additionally, pressure-sensitive tapes—as their name implies—are designed to be installed with sufficient pressure. According to Peil, sometimes an installer “will just stick it on there, rub it down with his hand and call it good. That’s not correct. They need to apply pressure with a tool… and unless that tape is applied with adequate pressure, they can expect that it will let go.” Sore notes that this is especially likely “when a large section of tape is installed, contractors tend to use their hands rather than a squeegee. This results in uneven pressure on the [pressure sensitive tape], causing an uneven and inconsistent installation. [Some manufacturers] provide their customers with squeegees to ensure the most consistent and reliable end result.”

Selection of the wrong product is also an issue. Peil notes that in the drive to reduce installation cost, people may select less expensive products that are not appropriate for a given application. When paying $35 to $40 an hour for labor, trying to save a dollar or two on a roll of tape is false economy, particularly if the products selected are not a good fit for the application.

Tape Maintenance

Peil advises regular visual inspections of the insulation system so that small items are noticed and can be corrected. If, for example, any edges are coming loose, they can be re-secured. These inspections also can give early warning of larger problems—not necessarily with the tape, but with the insulation envelope. One possible red flag is staining on the tape.

Jerry Maratea, vice president of sales and marketing at Ideal Tape, adds that while staining could warn of a problem in whatever is being insulated, bubbling or puckering would indicate that there is something in the duct underneath and liquid or vapor is seeping out.

If someone doing maintenance work happens to damage the tape, Peil warns, the vapor barrier is damaged; and the vapor barrier must be complete to keep the insulation system working. Examples of situations to look out for and to correct include someone crawling or leaning a ladder up against the system and accidentally tearing the tape. In cases like these, the tape needs to be fixed right away.

If there is a reason to remove existing tape, typically the whole insulation system will go with it. Removing just the tape involves a careful procedure of slowly peeling it back. After the tape is removed, a solvent will be needed to clean the surface of the insulation material to be re-taped. Once the surface is cleaned of adhesive residue, it is important to make sure that the solvent is gone, too. Since the solvent is what cleans the old adhesive, any solvent that remains will likely have a negative effect on the new adhesive. After removing the solvent, the installer can re-tape the insulation system, if necessary.

Removing tape is a task that plant maintenance personnel can do. It is not necessarily difficult, but, says Peil, “It’s fussy. It’s time consuming. It’s slow, and [you] have to be willing to take the time to do it.” Maratea adds that if plant maintenance personnel need to know how to clean adhesive residue before they re-tape, a call to the manufacturer will provide the answer quickly.

Tape and Mold

Mold and mold-related issues are concerns that the whole industry is looking to evaluate what the problems are, and tape manufacturing is no exception. Peil notes, “That’s part of what’s driving the desire for new vapor barrier materials. It’s not necessarily anything that’s easily resolved, simply because it isn’t just the material that causes mold and mildew, it’s the conditions that the materials operate in. The [heating, ventilation, and air conditioning] (HVAC) industry very specifically took a look at this from about 1989 to the mid-1990s. They did extensive studies and the insulation manufacturers were heavily involved. The conclusions are that mold and mildew can grow on anything: plastic, metal, insulation, wood, you name it. All we can do as manufacturers is try to create products that will create the greatest resistance to mold and mildew possible.”

He adds, “One of the things that people don’t realize is that the vapor barrier stocks are already tested for mold and mildew growth. If they do promote mold and mildew growth, you’ve got to go back to the drawing boards?There is no single silver-bullet answer for mold and mildew. Is it playing a role in our business? Absolutely. We’ve got to watch out and make sure that we’re in tune with what the mold and mildew issues are.”

Tape and Energy Savings

According to Peil, energy savings can be realized whenever there is an insulation envelope that tape can seal. For example, if tape is used to seal up HVAC ductwork, the conditioned air is kept inside the ductwork and is delivered to the space(s) it is supposed to reach.

Maratea agrees that if tape seals everything up, the system will run more efficiently, which will result in energy savings. He adds that people must take the time to put the tape on correctly to completely seal the system or the system will be inefficient.

When asked if the increased cost of energy is affecting the tape manufacturing business, Maratea observes, “We use an awful lot of electricity, and the cost of our electricity has doubled. Additionally, we use a lot of gas—we’ve got gas-fired ovens—and gas is up 120 percent. So, absolutely those costs have impacted the cost of manufacturing products, and it is causing our costs and prices to go up.”

Looking Ahead

Peil observes that the insulation industry is expected to grow 2 percent per year over the next five years, and tape manufacturers are expected to ride the same tide as the mechanical insulation industry. He notes, “Vapor retarders are changing significantly. As the products that the insulation manufacturers are using change, we have to be in a position to respond and make things that match those new products.”

Pressure-sensitive/adhesive-containing products continue to grow in all segments of the construction industry. Peil predicts that the industry will see new uses, new products and a growth in ways to use pressure-sensitive tapes in the mechanical insulation business.

Maratea adds that their business increases when commercial building is up. If the trend is down, and if the economy weakens, they see that in their business, too. He adds that they have an ongoing development program to look for ways to improve adhesives (so that there are advantages to the insulation installers) and to increase the longevity of the tapes when they are applied to a system. According to Maratea, “We’re always looking for new substrates, new ways to use tape.”

Peil adds that building codes are changing significantly. He notes that tapes have been among the options that people considered last up to now, but with increases in energy efficiency and the desire for longevity, code officials are requiring higher quality tapes. Where lower integrity products have been used previously, codes now demand and dictate higher integrity, longer-lived products with more certifications behind them.

Challenges for the Future

Cost containment is the biggest challenge every tape manufacturer faces now and in the near-term future. Product development is not necessarily a fast process, so when a company decides to make a change or is looking for a new way of doing something, doing it quickly and doing it cost effectively is always a challenge. Then, says Peil, “creating the new facings or other compatible products is always something that is a challenge for us.”

Resources

Darrell Peil and Jerry Maratea are at Ideal Tape Co., Inc. (headquartered in Lowell, Massachusetts) Peil has been national sales manager for Ideal Tape for two years and has been involved in mechanical insulation for 23. He can be reached at peil@abitape.com. Maratea, vice president of sales and marketing, has been at the company for 13 years, specializing in HVAC and insulation industries. He has 38 years of experience in the pressure-sensitive tape industry. Jerry Maratea can be reached at maratea@abitape.com.

Ed Sore has been a member of the insulation industry since 1968. He has worked with Venture Tape Corporation for the past 23 years, including 11 as insulation sales manager. He can be reached at 800-343-1076 (U.S.) or (0)800-962-957 (U.K.).

Ben Wong is vice president of sales and marketing at Compac Corporation, a position he has held for the past year. He can be reached at 800-631-9350.

It is now more than 2 years since the space shuttle Columbia disintegrated during re-entry to the earth’s atmosphere on February 1, 2003, killing all seven astronauts aboard and, in the process, putting a spotlight on foam insulation.

In the years since the tragedy, the U.S. National Aeronautics and Space Administration (NASA) has sought a solution to a well-publicized problem with the foam insulation on the space shuttle’s external fuel tank. While the shuttle’s insulation problem is no longer headline news, it has not been resolved, nor has it disappeared. If NASA does not find and implement a solution, the space shuttle fleet could be grounded. How did this exciting, highly technological space exploration program come to be threatened by something as seemingly mundane as foam insulation material?

Background

Lockheed Martin is NASA’s fuel tank contractor. The company also spray-applies the polyurethane foam insulation over the shuttle’s external fuel tank. Within the external tank is liquid hydrogen fuel in one cavity (at -427°F) and, in another cavity, liquid oxygen (at -297°F). Both of these temperatures are considered cryogenic. (For comparison, natural gas is liquefied at about -310°F and typically transported and received as liquefied natural gas [LNG] at -260°F.) The foam insulation has a minimum thickness of 1 inch and a design density of 2.4 pcf. In some areas, such as around protruding structural members, it is applied even thicker than 1 inch. Lockheed Martin applies a coating over the insulation to help protect it and to act as a vapor barrier, but a separate vapor barrier sheet has not been applied over the foam insulation—a step usually considered necessary by those in the insulation industry.

A June 2003 article in the publication Florida Today reported that a study of NASA records showed that all 113 shuttle missions flown before the Columbia disaster were damaged by launch debris. It was noted that connectors to the external fuel tank, known as the intertank, shed the most foam. This area also is most susceptible to harboring ice. The article explained that when workers apply foam to the intertank and bipods (which protect the connector between the fuel tank and the orbiter’s nose), they shave the protective coating and poke tiny holes into the foam. The shaving and the holes can provide paths for both gas and moisture to penetrate the insulation. The absorbed moisture can subsequently freeze and turn to ice, which can then cause the foam to pop off during flight. Clearly, foam with ice can be much heavier than pure 2.4-pcf foam and can cause more serious damage to the shuttle orbiter’s thermal shields. In addition, the fuel tank is often exposed to rain and humidity while the shuttle sits on the launch pad waiting for appropriate launch conditions. Before its last flight, Columbia sat on the pad for 39 days during heavy rains.

Accident Investigation

In March 2003, NASA convened a “Shuttle External Tank Technical Forum” consisting of 25 specially selected scientists and engineers from academia, government research centers and industry to study the foam insulation problem and make recommendations.
Then, in June of that year, NASA investigators reported that they found the smoking gun—proof that a piece of foam insulation did, in fact, damage a heat shield. At the Southwest Research Institute in San Antonia, Texas, NASA tested a 1 2/3-pound piece of foam by firing it with an air cannon at a panel taken from another shuttle’s wing. At speeds up to 530 mph, the foam blew a 16-inch square hole into the wing panel. A hole of only 10 inches across would have been enough to lead to the disintegration of the space shuttle upon re-entry.

A year and a half later, NASA officials reported that super-cooled chemicals inside the tank caused ice to form outside as the shuttle prepared to launch and confirmed that the use of 1-inch foam insulation merely reduced the amount of ice formed (rather than prevent ice formation).

The View From One Engineer’s Perspective

Review of the brief history since the Columbia disaster and the prominent role of the spray-applied polyurethane foam insulation raises several questions. First, how can 1 inch of polyurethane insulation adequately insulate a surface at -427°F and prevent ice formation, even assuming that no cracks or voids form?

This author does not have access to the specification of NASA’s spray-applied polyurethane insulation but offers for consideration the American Society for Testing and Materials (ASTM) specification C1029-02 for spray-applied rigid cellular polyurethane thermal insulation, which covers material with a temperature range only from -22°F to 225°F.

ASTM C1029 does not provide thermal conductivity values but does give an R-value of 6.2°F – ft2 °F / Btu for a 1-inch thick sample at a mean temperature of 75°F. Taking the inverse, 1/R-value, gives a thermal conductivity, or K-value, of 0.161 Btu/h ft2 -°F. At a mean temperature of -200°F (approximately what the foam insulation would experience on a -427°F tank in a 75°F environment), the thermal conductivity should be considerably lower.

A broad thermal evaluation yields one possible alternative—a rigid foam insulation that can be used to -200°F, ASTM C578-04, Type XIII polystyrene insulation. While this material probably has a different thermal curve than spray polyurethane, its thermal behavior is also likely to be similar enough to that of spray polyurethane to use as a surrogate. Inputting into the computer program 3E Plus® Version 4.0 (available free from the North American Insulation Manufacturers Association at www.pipeinsulation.org) using the default thermal conductivity values for the Type XIII polystyrene in the program, this author estimated the insulation thickness required to prevent ice formation in a 75°F, 75 percent RH environment with a 5-mph wind (likely an unrealistically mild scenario). This thickness is predicted to be somewhere between 1 and 1.5 inches. Based on these mild weather conditions, it would appear that another 0.5 inch or so of foam insulation would need to be added to the 1 inch NASA currently uses to prevent ice formation under very mild launch conditions.

Re-run the 3E Plus evaluation with more realistic ambient conditions—a cool February morning in Florida, a 50 F air temperature, 80 percent RH, and 0 mph wind—and the scenario changes dramatically. In that case, one would need between 3.5 to 4 inches of foam insulation to prevent ice formation on the skin of the insulation. While these scenarios certainly do not provide scientific proof, they do offer an argument that the foam insulation used on the space shuttle’s external fuel tank may be under designed—at least from a thickness perspective. In particular, the insulation could be underdesigned on the bipod and intertank areas, where pieces of foam insulation have become dislodged during past takeoffs.

But why does ASTM C1029 spray-applied rigid cellular polyurethane insulation have a lower temperature limit of only -22°F, 400 F higher than the -423°F temperature of liquid hydrogen? While I don’t know for certain, I believe that it is likely due to dimensional instability (i.e., it shrinks significantly at cryogenic temperatures). Furthermore, at some cryogenic temperatures, the blowing agent gas would condense and freeze. It is not clear how this has been accounted for. If, as has been reported, Lockheed Martin uses an HFC blowing agent, is it a special HFC blowing agent?

Another question is how NASA has accounted for an increase in thermal conductivity with time, characteristic of organic foam insulations over their first 6 months of life. While Lockheed Martin tests the booster rocket with the cryogenic liquid fuels, it likely does so with foam insulation that is fresh, maybe only a week or 2 old. In contrast, the external fuel tank is typically insulated 6 months or so prior to an actual launch.

The next question, then, is what about the formation of cracks and gaps? Any crack that forms in foam insulation in a cryogenic application can create a direct opening to the cold surface. One such crack, even on a pipe or tank that does not move, can be catastrophic due to the subsequent formation of ice. An ice ball will grow rapidly in a humid environment until the insulation is split and separated from the insulated surface. This is a major reason why LNG pipe insulation—even when it is cellular and has a very low vapor permeance—is covered with a thick, rubber vapor barrier. (A vapor retarder is insufficient for cryogenic pipe insulation applications). Surveying all of the known information, NASA’s fuel tank foam insulation has a coating, but not a separate vapor barrier, applied over it. Can a coating effectively prevent moisture from intruding into foam insulation and prevent cracks from forming in the insulation itself?

The ASTM C1029 value for water vapor permeability is a maximum of 3 perm-inches, which is not a particularly low value (compare this to ASTM C552 cellular glass insulation, which has a water vapor permeability of 0.005 perm-inches, a value that is 99.8 percent lower than that of polyurethane insulation). Further, the water absorption value in C1029 is a maximum of 5 percent, again not a particularly low value (again compare to C552 cellular glass, which has a water absorption value of 0.5 percent maximum, 95 percent lower than that of polyurethane foam insulation).

Lessons Learned

As a result of the investigation into the Columbia tragedy, NASA implemented several changes. As early as June 2003 it was reported (Florida Today) that NASA was redesigning a bipod ramp as a solution to the problem of insulation breaking away from the shuttle’s 15-story fuel tank. NASA itself reported in December 2004 that redesign of the external fuel tank included the addition of heaters at key points to prevent ice formation before launch.

Earlier this year, prior to the launch of the shuttle Discovery, NASA reported that while it was likely that some foam insulation would be dislodged during that shuttle’s liftoff, the pieces would be of insufficient size to damage the shuttle’s thermal shield tiles. Operating under the motto “Return to Flight” since the Columbia disaster, NASA engineers focused on minimizing foam insulation loss during launch and eliminating foam insulation from the bipod connecting the fuel tank to the forward part of the orbiter. Engineers modified several of the tank’s external fixtures so that the foam insulation could be sprayed on more uniformly, without voids, and could expand during launch to keep from dislodging. NASA engineers reportedly ran millions of computer simulations of various sizes of foam insulation pieces being fired at the reinforced carbon heat shields.

In July 2005, NASA reported that they changed the foam insulation a decade earlier, switching from a foam-blowing agent that used an environmentally damaging chlorofluorocarbon (CFC) to one using a more benign hydrofluorocarbon (HFC) blowing agent. The newer HFC-blown foam insulation is a significant change since it is reported to be more brittle than the originally specified insulation material.

The Return to Space

After spending $1.5 billion to fix the fuel tank and implement other safety upgrades, NASA successfully launched the space shuttle Discovery July 26, 2005. However, 2 minutes after liftoff, photos showed a large piece of foam insulation coming off the external fuel tank (although it did not appear to hit the leading edge of the shuttle). NASA estimated the piece to be 24 to 33 inches on one side, 10 to 14 inches on the other, and 2 to 8 inches thick—approximately the same size as the one that critically damaged Columbia 2 years earlier. Although the Discovery landed safely at Edwards Air Force Base in California at the end of a 14-day mission that included in-flight repairs on damaged heat shields conducted by one of the astronauts, NASA suspended future shuttle flights because of risks posed by falling foam insulation debris.

Additional Modifications

Now, NASA is removing the 37-foot “prototuberance air load ramp,” a long foam insulation protrusion designed to smooth airflow over the tank at high speeds and ease vibration to nearby piping and cables. It is believed to be the source of the 1-pound piece of foam insulation that broke off during Discovery’s launch, nearly hitting the orbiter’s right wing. It will be replaced by a new type of foam insulation that will be applied with more exacting techniques, designed to prevent shedding.

Looking Forward

At a news conference on October 14, 2005, NASA officials target a May 3 to May 23, 2006 window for the next Discovery launch. They reported that shuttle workers will likely replace and modify areas of insulation on the external tank where foam broke loose during the July 2005 launch. Program manager Wayne Hale says that a series of tests over the next several weeks will help further clarify the tank issues. “I think we’re beginning to have our hands well around the technical problems that we have and to find the fixes that are going to be necessary to fly again,” he said.

NASA clearly has studied the foam insulation problem extensively and determined that the causes leading to foam insulation breakage include an imperfect surface and overcooling around structural protrusions, such as the bipod area. The imperfection problem is being addressed by greater attention to the application of the insulation and coating, and the local overcooling problem is being addressed by adding electrical heaters to those areas where ice formation has apparently occurred.

Let’s hope we’ve seen the last of the foam insulation problem.

The newly created SAVE ENERGY NOW campaign designed by the Department of Energy educates the public about simple yet

effective energy choices, assists U.S. industry and the government in reducing energy use, and supports national goals for

energy security. SAVE ENERGY NOW is helping industrial plants find effective ways to reduce the amount of energy they use in

steam and process heating systems so they can operate more efficiently and profitably. This effort also addresses

energy-saving opportunities for compressed air, fan, motor and pumping systems.

The DOE is inviting NIA members to partner with them by communicating this opportunity to manufacturing facilities to help

them thrive during a time of diminished energy supplies and rising costs. We can help them save energy and money with this

program. Here’s what you need to know about this vital program:

Who can join Save Energy Now?

Companies, states, utilities, and other industry groups are invited to join this effort. By taking part, you will help

improve industrial energy efficiency and productivity while helping to ensure a reliable U.S. energy supply.


What does Save Energy Now provide to U.S. industry?

  • Energy Savings Assessments for the nation’s large, energy-intensive plants, performed by teams of energy efficiency

    experts.

  • Priority energy assessments for small- and medium-sized plants, performed by teams from ITP’s university-based Industrial

    Assessment Centers (IAC).

  • Phone consultations and technical assistance provided by experts at the EERE Information Center.
  • Training, Webcasts and workshops on the use of ITP’s powerful software analysis tools and ways to improve efficiency and

    productivity throughout the plant.

  • Access to the Industrial Technology Program’s (ITP) extensive portfolio of helpful information, including tip sheets,

    case studies, handbooks and more.

  • Recognition on the ITP Web site.

What is an Energy Savings Assessment?

Energy Savings Assessments identify immediate and long-term opportunities to save energy and money in your plant, focusing on

steam or process heating systems. If your company is one of the large energy-using plants selected to receive an assessment,

a qualified energy efficiency expert will visit your site for several days and work with you to identify opportunities for

improving energy efficiency and your bottom line.

During your assessment, plant employees will work with the expert to help gather data, learn about software tools, and

perform a system analysis. There is no cost for the energy efficiency expert; however, the time invested by your plant’s

staff can yield benefits to your company in the future. Plants may apply individually, but groups of plants within the same

company are encouraged to apply jointly for these assessments.

If a plant is not selected for an Energy Savings Assessment, can they still benefit?

While only 200 Energy Savings Assessments will be performed, your company could still be eligible for a priority

assessment from one of ITP’s Industrial Assessment Centers, phone consultations, and informational materials to help you

address energy efficiency opportunities.

Who conducts these assessments?

Specialists in evaluating industrial energy systems conduct the assessments. These are industry experts who have

successfully completed the DOE Qualified Specialist program, which includes training in the use of sophisticated software

assessment tools and a rigorous qualifying exam.

How can my company participate?

Get started today. See the Save Energy Now Website at

www.eere.energy/gov/industry/saveenergynow to apply for an assessment and to find out how to partner with ITP in this

important new initiative. Call the EERE Information Center (1-877-337-3463) to learn more.

Non-destructive testing (NDT) inspection of insulated vessels and piping has long been a major challenge. Conventional techniques such as profile radiography and ultrasonics often are impractical or cost-prohibitive because of limited productivity, insulation removal cost or temperature restraints. This article presents an overview of two technologies that are designed for online corrosion inspection of insulated components: profiler portable real time radiography, and pulsed eddy current. It addresses the practical applications, typical productivity, strengths and limitations of each technology.

The need for improved online inspection of insulated vessels and piping has existed for decades. The primary objective of each owner/user facility is to operate as profitably and safely as possible. Many inspection-related issues factor into this goal. Is it necessary to shut down the plant or a portion of the plant to perform a specific inspection? What is the collateral cost associated with performing an inspection (i.e., scaffolding erection, insulation removal, process modifications caused by heat loss)? Additionally, if the insulation contains asbestos, an abatement cost will be incurred. Finally, and perhaps more importantly, what are the risks and ramifications if the inspections are deferred?

This article discusses real time radiography technology (RTRT) and pulsed eddy current technology. These technologies can provide new options/resolutions for some of the above issues.


Real Time Radiography

The RTRT unit is a portable, real time, non-contact density measurement system that provides quantitative wall thickness information using gamma absorption from the low-level exempt isotope Gadolinium 153 (Gd-153). The unit is designed to quickly examine insulated piping for blockage, internal corrosion and corrosion under insulation (CUI). The output of the collimated Gd-153 source is directed to a special scintillator. The
scintillator electronics contain the equivalent of a low-level X-ray camera. In turn, the scintillator is coupled to a photomultiplier tube whose electronics are matched to the scintillator output. The RTRT unit produces an output signal that is sent to the computer. The computer presents a real time digital strip chart of the component thickness. Figure 1 is a schematic representation of the component parts.

The high efficiency of the RTRT process enables a low-strength source to penetrate much denser materials than can conventional RT film. The unit can obtain double-wall thickness measurements of fluid-filled piping up to 13 inches (33 cm) in diameter with nominal 4.5-inch (11.4-cm) wall (pipe wall plus insulation). Larger pipe diameters can be inspected if they are not fluid-filled. The RTRT unit provides a repeatable measurement accuracy of 2 percent of the density.* The equipment can be applied to a wide range of materials including carbon steel, stainless steel, plastic and concrete. As a rule of thumb, the unit can penetrate the equivalent of 1.25 inches (3.2 cm) of steel. The density of water is approximately one-tenth that of steel. The units are equipped with one curie Gd-153 source having a half-life of 243 days.


Calibration

Calibrations are performed by indicating the representative thickness of insulation and water path between the source and detector. Additionally, various thickness of the component wall material (generally steel plate samples) are used to simulate the anticipated range of the thickness to be tested. Through this process, a linear thickness range is established on the computer screen for measurement during the inspection.

The thickness output reflects only the pipe thickness and not the collective insulation and water thickness. Because some variations occur from nonuniformity of the insulation and water path, one should not expect the reported thickness reading obtained by the RTRT unit to have the same accuracy as conventional ultrasonics. Instead, consider the reading an indicator of relative thickness change requiring further interrogation with alternative techniques in the area of concern.


Examination

Examinations are performed with a two-man crew. One person manipulates the measuring unit while the second person monitors the computer display. The system is battery operated, so no external alternating current (AC) power is required. All examination data are displayed in real-time; however, the digital data output can be stored for future evaluation and for reporting documentation.

The unit straddles the pipe and is manually moved down its length. The unit can then be rotated 90 degrees and the exam repeated if four-quadrant interrogation is desired. For two-quadrant examinations, it is reasonable to expect a production rate of 1,000 to 1,200 linear feet (305 to 366 m) of pipe per shift, assuming convenient access to the pipe is available. Pipe rack environments generally yield inspection production rates of 400 to 600 linear feet (122 to 183 m) of pipe per shift.

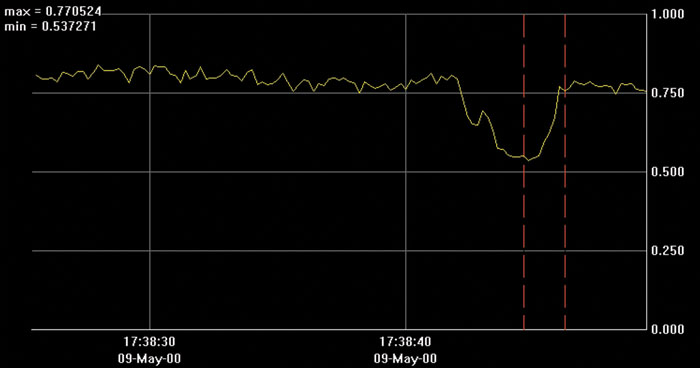
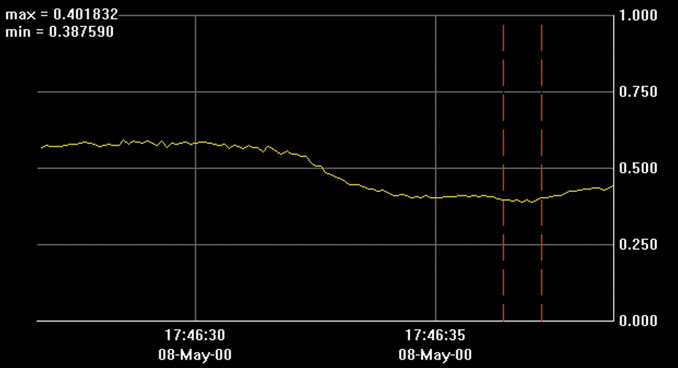
Because the RTRT unit measures all density between the source and detector, the output displays the thickness of both pipe walls. When a change in thickness is observed, however, a scan across the pipe axis reveals which side of the pipe is responsible for the change of thickness (i.e., area of corrosion). The same technique can be applied on jacketed piping to determine which azimuth of which pipe (inside or outside pipe) contains wall loss. Figures 2 and 3 show typical output displays.


Pulsed Eddy Current

The second technology to be addressed uses the principle of pulsed eddy current. This inspection system is used to perform online wall thickness measurements on ferrous pipes and vessels without removal of the thermal insulation.

A probe containing a transmitter and receiver coil is placed on top of the thermal insulation. The transmitter coil is activated and a magnetic field is established in the steel being inspected. The current is then switched off and the magnetic field is terminated, causing eddy currents to be induced into the near surface of the pipe wall. As the eddy currents diffuse through the wall, they decay at a known rate. When they reach the far side of the wall, the eddy currents decay at a much higher rate. The receiving coil detects this change, and the system calculates the distance to the inside diameter and the wall thickness.* The measurement is an average of the remaining wall over the area of the footprint of the probe.

The footprint size can vary because of several factors such as liftoff (insulation thickness), probe selection and insulation sheathing material. Also, embedding chicken wire in the insulation typically increases the footprint size by about 40 percent. As a result, the system is much better suited for measuring generalized corrosion, erosion and CUI rather than very localized pitting; a very localized pit will not have a significant affect on the average thickness under the entire area of the footprint.


Calibration

Calibration typically is performed on the structure to be inspected. First, a reference point is established. All subsequent readings can be compared to the reference point. If the structure is fully insulated (i.e., no reference ultrasonic test [UT] reading can be obtained) and the thickness at any specific location is not known, then the reference point is assigned a thickness of 100 percent. All subsequent readings are presented as a percentage relative to the reference point. The system can display the readings in inches at any point afterward if a thickness reading is provided at one of the measurement points. It may be necessary to establish more than one reference point if any key variables substantially change across the area of the structure.

Key variables include conductivity and permeability. They are affected by component temperature and material composition, including changes caused by heat treatment of the component. The inspection procedure provides all necessary guidance for system configuration as well as probe selection required during the calibration.


Examination

Measurements are obtained in an X-Y grid pattern. With favorable field conditions, one can obtain up to 1,000 readings per shift. The cycle time between two readings typically is 3 to 10 seconds.* The unit is capable of inspecting components online within a temperature range from —150 to 900 F (—101 to 482 C). Wet or irregular insulation does not impede the inspection. The pulsed eddy current system also can be utilized when conventional UT is impractical because rough, encrusted or coated surfaces are present. Components up to 2.5 inches (6.4 cm) in thickness (minimum thickness of 0.12 inches [0.3 cm]) can be inspected with insulation up to 6 inches (15.2 cm) thick. To avoid the effects of curvature, pipe diameters of less than 3 inches. (7.6 cm) cannot be inspected with this system. Battery operated and portable, the system requires no external AC power. Ferrous attachments such as branch connections, nozzles, etc., cause interference in the readings. As a result, measurements are not reliable within close proximity of such attachments (2 times the insulation thickness). The system software allows for onsite hardcopy reporting of inspection results.

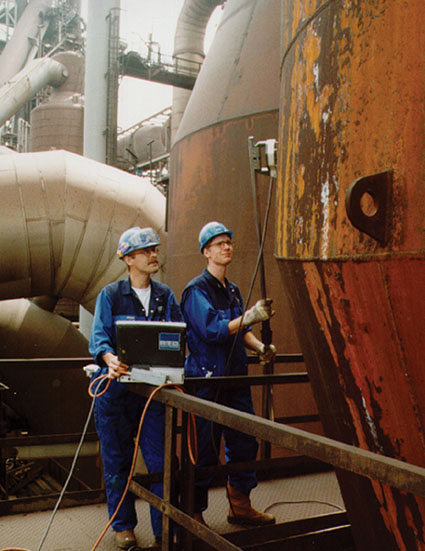
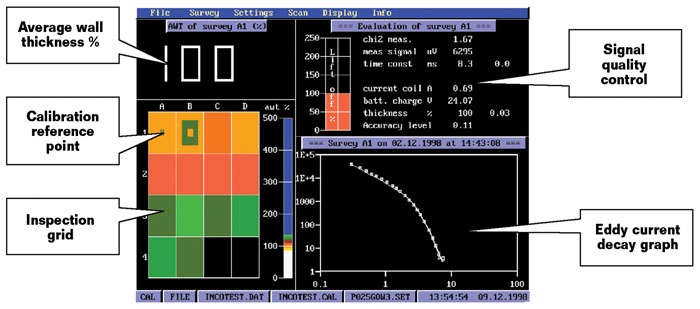
Figure 4 shows the typical field use of the pulsed eddy current technique. Figure 5 shows a typical display.


Conclusions

Effective screening and monitoring of insulated piping and vessels can be of great value in overall facility inspection and maintenance programs. Evaluate key issues such as cost, productivity, disruption of plant operations, and minimization of plant shutdowns when implementing inspection programs.

The two technologies discussed in this article provide options where critical information can be obtained online on vessels and piping with minimal auxiliary cost (insulation removal, etc.). As with all technologies, each has its strengths and limitations. It is very important that end-user expectations are compatible with the capabilities of the technology so that optimum results can be obtained.

Recognize that the RTRT is a high-production screening tool allowing for inspection of long runs of insulated pipe at lower cost than conventional techniques. After identifying abnormalities, perform further interrogation in the area of interest with other NDT methods.

One of the strongest attributes of the pulsed eddy current system is the fact that large-diameter vessels, with up to 2.5-inch thickness, can be inspected online without the need for insulation removal.

* References pulled from proceedings of the 15th World Conference on Nondestructive Testing, 2000, and the 7th European Conference on Non-destructive Testing (ECNDT), 1998.

Reproduced with permission from NACE International, Houston, TX. All rights reserved. Published in the April 2004 issue of Materials Performance. NACE International 2004.

Figure 1
Figure 2
Figure 3
Figure 4
Figure 5

Most facility managers, engineers, and maintenance and construction personnel now know that corrosion under insulation (CUI)

exists and, left to its own devices, can cause serious problems and even catastrophic consequences.

It is also widely known that the results of CUI are costly. How costly? That is harder to define. Most studies on the topic

involve all forms of corrosion and their associated costs without providing the individual cost of corrosion related to

insulation.

What is clear, however, is that the cost of corrosion in the United States continues to increase. A study completed in 2001

by a research team of corrosion specialists enlisted by Congress titled, “Corrosion Costs and Preventative Strategies in the

United States” reported the direct cost of corrosion to be $276 billion per year, with that number potentially doubling when

indirect costs are also considered. Compare this to the first study conducted in 1975, which established the benchmark cost

of corrosion at $70 billion. Factoring in inflation, this is actually an improvement if the data are compared to the gross

domestic product, with 3.2 percent for 2001 versus 4.2 percent for the 1975 study.

CUI is typically difficult to identify because it lies hidden under insulation material, often until it becomes a serious

problem. It is also expensive to inspect for or repair since that usually requires inspection by radiography, ultrasonic or

other forms of inspection but in most cases requires the removal of the insulation system. This is especially true if the

removal involves material with asbestos. A study done by ExxonMobile Chemical and presented to the European Federation of

Corrosion in September 2003 indicated that:

  • The highest incidence of leaks in the refining and chemical industries are due to CUI and not to process corrosion;

  • Most piping leaks (81 percent) occur in diameters smaller than 4-inch nominal pipe size; and
  • Between 40 and 60 percent of piping maintenance costs are related to CUI.

Finally, one of the largest chemical manufacturing companies in the world, E.I. DuPont de Numours and Company, estimates that

the direct cost of CUI repairs and replacements well exceeds $10 million per year, which does not include normal preventative

maintenance costs and indirect costs like loss of production and revenue. This is especially revealing since DuPont is known

internationally as a company with world-class facility engineering, maintenance and workplace safety.
Adding to this problem is the accepted belief that industrial facilities in the United States are aging, being operated and

maintained by fewer personnel, and funded by reduced budgets.

It can therefore safely be determined that CUI remains a large problem for industry, even if it is not clear exactly how big

the problem is today.

For CUI to form there must be two basic ingredients: moisture and warm temperatures. For iron products like carbon steel

piping and equipment, oxygen is also needed. To have chloride stress corrosion (SCC) of 300 series stainless steel, there

also must be the presence of chloride ions. Obviously, oxygen is fairly easy to find, but, maybe surprisingly, so are

chloride ions, which are available in a great number of places from seawater, drinking and process water, and chloride

chemical compounds to roadway de-icing salts. The presence of acids, acid gases, and bases like caustics and salts also can

create and accelerate corrosion.

Additional factors encourage CUI: the environment, insulation design and specifications, installation craftsmanship, and

maintenance. Let’s examine what can be done to reduce the risks.

The Environment

The Cause

Consider the environment as the food source for CUI. It is the first, the largest and the least controllable factor that can

contribute to CUI. However, it is important to remember and understand all the elements of an insulation system’s environment

that contribute to CUI.

Moisture, or water in all of its forms, is the first and most important corrosive element; without it, corrosion cannot occur

to any real degree. Because moisture can take many forms, it can find numerous ways to get under an insulation system.

Rainwater is the most obvious method, but there is also flooding of insulation systems in low-lying areas and water from

pressurized water wash down or local steam leaks. Water also can come from fire protection sprinkler systems, especially

“deluge” type systems that, when activated, spray water from every sprinkler head—literally deluging the area with a

water

spray as bad as or worse than any rainstorm.

The next source of moisture is water vapor penetrating and soaking down the insulation systems operating at or below ambient

temperatures. The final source is ice, normally cold service insulation systems operating below the freezing point. Although

insulated piping and equipment under a layer of ice do not corrode significantly since the temperature limits the available

heat and oxygen (two of the three necessary elements of corrosion), it provides a near ideal corrosion area where the ice is

continually freezing and thawing.

Operating temperature is the next most important element. Above 300 F, most moisture that finds its way into the insulation

system evaporates before it can get to the surface and start corrosion. Below 32 F, because of relatively low energy levels,

corrosion rates are dramatically reduced and the formation of ice limits the amount of oxygen available. However, between 32

F and 300 F is where CUI can happen for carbon steel, and between 140 F and 300 F for 300 series stainless steel. The

“optimum” temperature range for aggressive corrosion on both carbon steel and 300 series stainless steel seems to be between

200 F and 240 F. In this range, there is plenty of heat energy but not enough heat to efficienty evaporate moisture before it contacts the equipment surface.

Chemical exposure is the final major environmental element affecting CUI. Acids and acid gases like chlorine, hydrochloric or

sulfuric acid; strong bases like caustics; and salts are also aggressive corrosive agents and will both cause and accelerate

existing CUI.

The Cure

Since most elements in the environment that contribute to CUI are very difficult or impossible to control, the only hope of a

“cure” lies in properly dealing with the other factors contributing to CUI: design and specification, installation

craftsmanship and maintenance.

Design and Specification


The Cause

Often the original design of the equipment is the start of CUI problems. Piping or manway openings for equipment that are

sized too short to extend past the weather barrier of the insulation system provide an optimal leak area for water, corrosive

chemicals and contaminates to get into the insulation to start corrosion. Facility designs like pipe racks that do not leave

adequate room for insulation to be installed without interfering with the insulated pipe or equipment next to it also provide

a likely spot for future corrosion.

Failure to design and specify a protective coating requirement for carbon and 300 series stainless steel operating in the

temperature ranges likely to cause CUI is frequently a problem. Historically, carbon steel pipe and equipment that were going

to be insulated received no protective coating, in part because the insulation system was looked at as a kind of protective

coating and in part because they were going to operate above 200 F and it was thought that any water would just evaporate.

300 series steel was thought to be corrosion proof when it was first used widely in industry, and protective coatings were

considered unnecessary. Both ideas proved very wrong as illustrated by the following examples:

  • A chemical company in the Texas Gulf Coast area was forced to replace a stainless steel process column when SCC was

    discovered during inspection. There was more than $3 million in replacement costs with more than $2 million in lost

    revenue.

  • An oil refinery in the Northeast was forced to replace an extensive section of uncoated brine feed lines leading to its

    boiler feed water treatment plant when leaks revealed extensive CUI damage.

Equipment and piping design problems aside, often the problem lies with the design and specification of the insulation system

itself. In many cases, it is the result of one of the following:

  • Using an existing specification without considering all the factors that will affect its performance; or
  • Considering insulation material cost factors ahead of performance considerations, ignoring the effects on long-term and

    overall cost.

A number of insulation manufactures are making a variety of insulation products and accessories. Among the best reasons for

such a variety is the fact that no single insulation material, shape, size, configuration, etc., will perform well in every

use. This large variety allows the knowledgeable specifier and end user to select the insulation system that will perform

well over a long time and be cost-efficient. However, when knowledgeable decisions about insulation systems are not made,

problems arise, including CUI. The following are examples of design and specification failures.

An oil refinery in the Northeast with a boiler feedwater treatment plant whose carbon steel filter vessels operate at

about

230 F had been insulated with a low-density insulation material and an aluminum jacket weather barrier. These filters

require some routine maintenance requiring personnel to access the top of the vessels and the piping and manway access

points. The result was sad but predictable. The aluminum jacketing was deformed and damaged by the repeated trampling and

other work access, allowing water to enter the insulation system every time it rained, soaking the insulation system and

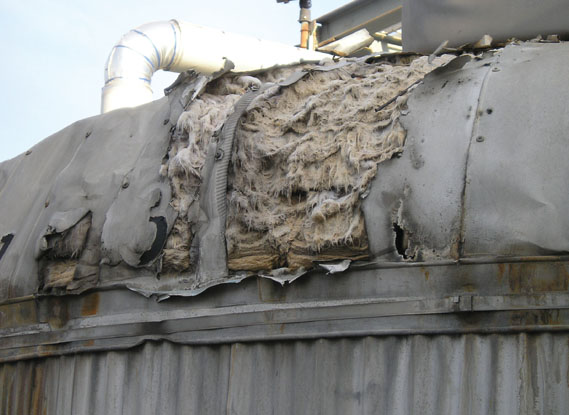
providing a perfect opportunity for CUI (figures 1 and 2). Three of the filters already have been identified with significant

corrosion; two have been extensively rebuilt and one is being considered for replacement. All of this comes at a cost of

hundreds of thousands of dollars for repair.


The same boiler feedwater plant mentioned above had several removable insulation covers installed on many of the feedwater

valves in the unit to help prevent freezing of the water in the lines during the cold winters of the Northeast.

Unfortunately, those removable covers installed on valves oriented horizontally accumulated rainwater inside the covers next

to the carbon steel valve surfaces, especially the flanges. Again, with the operating temperature around 230 F, these valves

ultimately suffered serious CUI problems and had to be replaced. A specification requiring a simple drain hole fabricated

into the removable cover on the bottom side, plus requiring the removable insulation cover to be made a bit longer so it

would overlap the existing permanent insulation system on each side of the valve flanges more completely, would have solved

the problem without the extensive cost and downtime of replacing all those valves.

A water treatment plant along the coast in southern California specified and installed an all service jacketing (ASJ)

on

their insulation system for their low-pressure steam and hot water piping systems. The problem with this specification was

the fact that all of these piping systems were installed in several exposed-top “tunnels” throughout the facility, exposing

the ASJ to sun, rain and wind. Not surprisingly, this resulted in the jacketing quickly deteriorating, soaking the insulation

material and corroding the carbon steel piping (figure 3). Several thousand feet of pipe ultimately had to be

replaced.


The Cure

First, understand the environment the insulation system will perform in. Next, understand the purpose for insulation: energy

conservation, freeze protection, personnel protection, condensation control, etc. Finally, design and specify an insulation

system customized to those unique circumstances to give it the greatest chance of success. As part of a successful design and

specification, be sure to consider the need for and proper type of protective coating for the piping or equipment.

Installation Craftsmanship of Jacketing/Weather Barriers


The Cause

Installation craftsmanship can have a great effect on an insulation system’s performance and life. Little else can undo good

insulation design and specification as much as improper or poor quality installation.

Although a poorly installed insulation system almost always compromises an insulation system’s useful life, performance or

both, it is a critical problem with those insulation systems that operate in the temperature ranges where CUI is a potential

problem (from 32 F to 300 F), cycle in temperatures, or may be shut down for periods of time. A poorly installed insulation

system ultimately lets moisture or corrosive chemicals into the insulation and often to the insulated surface, allowing the

start of CUI. Let’s look at some examples.

Caulking and sealants are the final barrier to moisture intrusion and may be installed improperly in a number of ways. They

may not be installed at all (figure 4) or may be installed incorrectly, either by missing sections or by wiping or smoothing

the sealant bead once it has been installed. Smoothing the sealant is often done to provide a more attractive finished

appearance but results in removing about 80 percent of the sealant material, reducing the life of the sealant and increasing

the chance of a leak.

Jacket materials installed without proper “fit and finish” (figure 5) provide easy water access. Gaps between jacket

components larger than 1/8-inch cannot be successfully sealed with caulking and sealants. Stresses and natural movement

between these parts will cause the sealants to fail prematurely, letting moisture and contaminates into the insulation.

Jacketing or weather barriers can also be installed improperly by not providing a proper rainshed. On vertical sections, this

happens when lower sections of the jacketing material are installed over the top of the upper sections (figure 6). On

horizontal sections, it happens when the lap section is installed close to the top or bottom of piping rather than to the

sides (figure 7). It can also happen when a section of jacketing is wrapped around the insulation such that the upper section

of the jacket horizontal lap is overlapped by the lower section. All of these installation errors allow water into an

insulation system.

Insulation terminations or end caps are other places where jacketing can be installed improperly with dangerous CUI

possibilities. End caps can be and sometimes are omitted entirely, with obvious CUI risks. However, subtler problems can

cause almost as much trouble. End caps installed on vertical lines improperly sealed or without attention to rainshed (figure

8) are almost as bad as having no end cap at all.

Problems with vapor retarders also can encourage moisture contamination of cold service insulation systems. Applied

“mastic”-style vapor retarders installed with inadequate thickness or excessive pinholes allow water vapor to penetrate into

the insulation system almost immediately after it is started up and cooled down to operating temperature. Failure to use a

reinforcing fabric within the applied vapor retarders will allow normal stresses during operation to prematurely crack the

vapor retarder and allow water vapor in. Finally, even the best applied or membrane style vapor retarders immediately can be

ruined when jacketing material is installed using screws as attachments instead of bands. Each screw obviously punctures the

vapor retarder, creating dozens of places for water vapor to leak into the insulation system.

The final installation craftsmanship issue that can lead to CUI is storage of insulation materials. Insulation materials

should always be protected from rain and weather. Insulation materials stored on the ground without any water-resistant

covering simply means the insulation gets installed wet right from the beginning.


The Cure

The clear cure remains:

  • Install insulation systems according to specifications;
  • Install insulation systems using personnel sufficiently trained to install them correctly; and
  • Follow up to ensure the job has been properly done, correcting any problems immediately so CUI problems cannot

    start.

Maintenance

The Cause

Finally, if design/specification and install craftsmanship issues do not create CUI problems, maintenance problems can.

Insulation maintenance is sometimes a case of too little, too late. Sealant problems (figure 9) or small holes in the weather

barrier (figure 10) do not get noticed until the insulation has been wet often enough or long enough to cause extensive CUI

problems and possible equipment failure. Sections of insulation removed for normal operations and maintenance do not get

replaced until whole sections of the insulation systems have been soaked or contaminated with corrosive chemicals.

Sometimes it is a case of not looking for the signs early enough or recognizing what the early signs of CUI look like.

The boiler feedwater plant, mentioned earlier in this article, with the extensive damage to its filters did not notice that

the insulation jacketing on top of the filters was extensively damaged, causing corrosion on the side walls of the vessel. As

a result, after the first two filters were stripped and repaired, the insulation systems immediately started to be wet down

again, since the source of the water had not been identified and repaired. It was only discovered after the third filter was

found to be corroded and someone finally inspected the tops of the filters. All the new insulation had to be stripped again

and reinsulated.

A chemical plant in the upper Midwest used 300 series stainless steel piping and equipment in its manufacturing process. It

was insulated to ensure that the chemicals within the line remained liquid (and for process control). During a plant-wide

insulation assessment, someone noticed extensive insulation system damage. The inspector asked the plant engineer if he had

experienced any SCC problems and he had not. This answer mystified the inspector until additional follow-up questions were

answered. It was learned that the plant engineer knew they had plenty of SCC on their stainless equipment, but they had not

had any “problems” because they had not had any equipment failures from the corrosion yet.

Somewhat curiously, there is a maintenance function that often encourages large contamination and wetting of insulation

systems. The curious part is that it is often caused by personnel and procedures specifically designed to ensure that a plant

site does not suffer from corrosion-related equipment failure. What is the mysterious source? It is cutting sections out of

insulation systems for the purpose of performing equipment integrity inspections and then failing to reseal them either by

patching the insulation or properly installing inspection ports (figure 11).

The Cure

Proper insulation maintenance is a case of “catch it early, fix it early.” Periodically inspect insulation systems to help

identify early failure signs, especially CUI problems. Some staining on jacketing can suggest moisture under the jacket, and

figure 12 shows how some jacket perforations are suggestive of corrosion from the inside of the jacket. Both are telltale

signs that CUI might be happening under the insulation system.
Once problems with insulation systems are identified, they should be repaired as quickly as possible to prevent further

contamination and corrosion, including the resealing of inspection ports.

Summary

We have seen how CUI can be a huge, difficult-to-detect problem that costs millions of dollars. We have also highlighted how

everything from design through maintenance can contribute to CUI. Finally, we discussed how it can be easily prevented

by:

  • Accounting for insulation systems during design;
  • Designing insulation systems specifically for the environment they will work in;
  • Installing the insulation system correctly so it does the job intended, for a long time, with minimal maintenance;
  • Learning to recognize the early signs of CUI and insulation maintenance needs; and
  • Performing insulation maintenance promptly so that CUI can not get a foothold in a facility.
Figure 1
Figure 2
Figure 3
Figure 4
Figure 5
Figure 6
Figure 7
Figure 8
Figure 9
Figure 10

In a 1930s pulp magazine entitled The Avenger, a character walking down a street saw a building explode. He did not hear it

explode because, according to the narrative, the sound was so loud that his hearing was temporarily stunned. He watched as

the building silently collapsed, and his hearing returned to normal a few pages later.

Naturally, a pulp magazine—especially one with a central character who can transform to look like anyone else in the

world—does not have to adhere strictly to the facts. However, in the real world, excess noise and subsequent hearing damage

and loss pose a significant risk in the workplace.

In 1991, the Occupational Safety and Health Administration’s (OSHA’s) Directorate of Compliance Programs issued a memo

instructing regional offices to cite employers for failure to record instances of occupational hearing loss. This is defined

as “an average shift in hearing of 25 dB or more at 2,000, 3,000 and 4,000 Hz in either ear, if an exposure in the work

environment either caused, aggravated or contributed to the case.” The shift must be calculated by comparing the current

hearing test with the original baseline audiogram for the employee, adjusting for age if appropriate. OSHA formally codified

hearing loss recordability as part of its record-keeping rule in 2001, and it was implemented on January 1, 2003. Hearing

loss is now officially recognized as a workplace hazard.


Loud Noise Can Affect More Than Hearing

Catherine Palmer, Ph.D., is director of the Center for Audiology and Hearing Aids at the University of Pittsburgh Eye and Ear

Institute and is an associate professor of otolaryngology and of communications science and disorders at the university. Dr.

Palmer notes there are many reasons why noise can be a problem. Audiologists worry about noise when it interferes with

communication or is loud enough to cause permanent hearing loss. Noise also contributes to the perception of tinnitus

(ringing in the ears), which can be an annoying or disabling condition. In addition, loud noise is known to elevate blood

pressure in some individuals.

David C. Byrne, a research audiologist for the National Institute for Occupational Safety and Health (NIOSH), agrees. “Noise

is often defined as ‘unwanted sound,'” he says. Sometimes the noise level is not loud enough to produce a health hazard, but

it may present a nuisance to nearby individuals. Everyday noise (i.e., loud music, recreational activities, barking dogs,

road/air traffic, etc.) can be annoying and is exacerbated by factors such as time of day, particular location (e.g.,

urban/rural) and the duration, volume and character of the noise. Too much noise can also be an issue in indoor office areas,

particularly where the noise is comprised of conversations that can be overheard between cubicles.

Is this as big a problem as OSHA believes? Byrne thinks it is. “Exposure to high sound levels results in the development of

noise-induced hearing loss, which can be a serious physical, psychological and social problem. Occupational hearing loss is

the most common occupational disease in the United States and is listed among the 21 priority research areas, as described in

the NIOSH National Occupational Research Agenda. Efforts to prevent occupational hearing loss appear to be hindered because

the problem is insidious and occurs without causing pain in affected workers. One consequence of noise-induced hearing loss

is a reduced quality of life due to the inability to communicate with family, friends and the general public. However, this

normally occurs after the hearing loss has progressed too far and the damage is irreversible.”


Absorption, Isolation and the Combination of Both

Dr. Palmer believes that there are several solutions to the problem of excess noise: “Remove oneself from the situation; wear

hearing protection; reduce the actual noise source; or treat the environment to reduce the noise that impacts the

individual.” Many sources of noise in the workplace cannot easily be reduced; therefore, environmental treatment must be

implemented.

Byrne discussed the use of insulation in combating sound, saying, “The important concept to remember here is that there is a

distinction between absorption and attenuation (isolation) of sound.”

Absorption, as measured by the absorption coefficient (a), is desirable for reducing noise within a space, he went on to

explain. Sound absorption is realized by materials—usually porous and often lightweight—that dissipate the acoustical energy

as heat (in negligible amounts) when the sound waves propagate through. Tables containing frequency-by-frequency absorption

coefficients for various materials are printed in acoustical textbooks and manufacturer’s product data. The absorption

coefficient is always a number between 0 and 1 and represents the percentage of sound absorbed by the material (e.g., 0 = no

acoustical energy absorbed; 0.5 = 50 percent absorbed and 0.99 = 99 percent absorbed).

A high sound isolation factor, measured by the number of decibels lost in transmission, is desirable for preventing sound

transmission. This is achieved using materials that sound waves cannot easily penetrate. A good attenuating material is

typically nonporous, dense and relatively heavy. Unlike sound-absorption materials (e.g., soft foam), sound-isolation

materials usually have structural functions (e.g., concrete or bricks). Tables/charts are available that list the sound

transmission class (STC) of common construction materials.
Acoustical absorbers are usually poor attenuators or sound barriers. A good attenuator reflects sound waves and thus has a

low absorption coefficient. Manufacturers often combine materials with different properties to achieve both absorption and

isolation (e.g., urethane foam bonded to a dense substrate).


The Best Type of Insulation for the Job

When asked whether mineral wool or fiberglass is better for sound control, Byrne had mixed feelings. “The answer depends on

exactly what you want the material for,” he said. In general, both materials work on the same acoustical principle of

absorption.

Open-cell or open-structure products are better than closed-cell or closed-structure for acoustical purposes. Some examples

of open-cell products are commonly known. “Mineral wool” refers to three types of insulation that are basically the same:

glass wool or fiberglass, which is made from recycled glass; rock wool, which is made from basalt (an igneous rock); and slag

wool, which is made from steel-mill slag. For many years, mineral wool was the most widely used insulation in the United

States, Canada and Europe. Although mineral wool is much heavier and costs more than fiberglass and cellulose, it offers some

substantial benefits such as being more heat resistant than fiberglass.

Regarding acoustics, the combined effect of the surface openings, internal structure, flow resistance and thickness

determines the absorption coefficient of the material. Proper installation is necessary for optimal performance of acoustical

materials. For example, unless approved by the manufacturer, a material should not be compressed to less than the original

thickness when being installed. Likewise, paint or other surface treatments/coverings may severely degrade a material’s

absorptive properties. To determine the best material for the job, it is helpful to consult the manufacturer or a table of

the representative physical characteristics and absorption coefficients for different forms/thicknesses of fiberglass and

mineral wool. The best-suited material for a particular application may depend on environmental conditions rather than

acoustical considerations.


Important Elements of Sound Control

STC and noise reduction coefficient (NRC) are important elements of sound control. Everything in acoustics, particularly

regarding noise-control issues, is frequency dependent. Significantly different treatments/solutions may be required,

depending on whether the offending noise is at a very high or very low frequency. It can be helpful to condense a set of

acoustical properties into a single number.

STC is a single-number rating used primarily to measure the speech privacy of a barrier or other structure (e.g., walls,

doors, windows, office partitions, etc.). It is determined from a plot of frequency-specific transmission loss data measured

in 1/3-octave bands from 125 to 4,000 Hz. STC is often specified as a performance criterion by architects and engineers for

places where speech privacy is of primary interest. It is important to note that STC is measured in an acoustical laboratory

(where the test specimen is mounted between two reverberation chambers); therefore, the labeled STC value of a product will

be fully realized only if it is installed correctly.

NRC is also a single-number rating. It is typically used when specifying the desired and/or required absorptive

characteristics of a material. The NRC for a material can be obtained easily by taking the mathematical average of the

absorption coefficients at 250, 500, 1,000 and 2,000 Hz. Careful consideration is necessary when using NRC values to compare

or select materials because absorption coefficients can vary widely in frequency even if NRC values are similar.

Sound insulation comes in many forms, including panels with perforated steel coverings that help trap sound and fiberglass

cloth, which can be draped over an object and sealed with vinyl, for a less permanent control attempt.

When asked about a new advance in mastic, or insulating paint, Byrne said, “If you are referring to spray-on

thermal/acoustical (typically cellulose) insulation, then everything [we have] discussed regarding acoustical absorption

applies here as well. Again, the exact characteristics of the material and the final thickness will govern its acoustical

qualities.”

He continued, saying, “It looks like this particular sound-reduction paint coating also works on the principle of acoustical

absorption. In other words, this paint apparently adds an absorptive layer to the wall surface, where the incident sound

waves are dissipated (absorbed) by the coating instead of just bouncing back off the wall. In theory, this should work fine.

However, I would question its usefulness for a couple of reasons. First, the resulting ‘thickness’ is actually so thin that

only the very highest audio frequencies would likely be absorbed (typically, the lower the frequency, the greater the

thickness required). Also, they advertise a 30-percent reduction of sound. I’m not sure exactly what they are referring to or

how they calculated it, but a 30-percent reduction may only be measured as a 1- to 2-decibel difference, which is barely

noticeable to most people.”


Insulation Is Working

Excess sound remains a danger in commercial work areas. Even in an office, free from the sounds of spinning turbines and

pounding jackhammers, excess noise can be a problem. If not for insulation around us, the constant whine of a Xerox machine

or dot-matrix printer would be significantly more grating. At home, a teenager’s loud stereo can contribute to discomfort or

partial hearing loss. To combat such noises, we have the acoustical engineers of the insulation industry. They may not be

able to stop exploding buildings from causing temporary deafness, but they can help keep noise in the workplace under

control.

Not long ago, Europe began working to increase public awareness of environmental hazards to health and comfort, with a focus

on “environmental pollution” caused by noise. Several European directives are now in place, with an aim to reduce unnecessary

noise and protect the human ear where exposure to noise is unavoidable (e.g., in workshops, near busy roads and airfields,

etc.).

To date, only limited research has been conducted on how best to deal with the problems that result from noise. The

Féderation Européenne des Syndicates d’Entreprises d’Isolation (FESI, translated as the European Federation of

Associations of Insulation Contractors), the European partner organization to the National Insulation Association (NIA), has

produced a series of documents addressing both, the theoretical physical background of the production and propagation of

noise, as well as the practical conclusions to be drawn for the task of “sound insulation” through absorption and

attenuation.

This began with a European directive in 1986 (86/188/EWG), which stated that the limit value of noise exposure for the ear is

at an equivalent continuous sound level of Leq = 85 dB(A) over the average 8-hour work day. This leads to a noise-induced

hearing loss of 5 percent in exposed subjects after 10 years. If this level of hearing loss is sustained over the duration of

an individual’s working life (e.g., 40 years), the total loss amounts to 20 percent on average.

This observation sparked an investigation into what makes up Leq, the equivalent continuous sound level. However, because its

physical expression (Figure 1) is not particularly illuminating for the average insulation practitioner, FESI opted to give

more practical explanations and advice for how to deal with environmental noise.

Three of the following documents on this subject were presented at NIA’s 50th Annual Convention held in Las Vegas, March

2005; two are scheduled for completion in 2006.


A2:
“Basics of Acoustics” (available May 2000)
A3: “Product Characteristics—Acoustic Insulation, Absorption, Attenuation” (available April 2002; revised edition

available September 2002)
A4: “Acoustics in Buildings” (available October 2006)
A5:“Acoustics in Rooms” (available May 2006)
A6:“Industrial Acoustics” (available May 2004)

Documents A2, A3 and A6 had been completed before the convention and were outlined in the presentation. Currently,

document A5 is nearly complete, and a first draft of A4 (in French) has been written. The three completed documents are

available from NIA, and it is anticipated that the remaining papers will be presented at NIA’s 2007 convention.

This series provides practical advice from a starting point of “principal considerations” (e.g., What sort of noise

protection can be expected from a wall composed of the following elements?). These principles—”fundamental truths as

bases for reasoning”—are found in document A2. Document A6 details the principles of sound propagation in industrial

environments and places.


Basics of Acoustics

This article is not intended solely for the insulation practitioner. Readers need not understand or be able to draw

conclusions from the subsequent documents. Rather, this is for those who want to learn the physical reasons underlying the

practical advice given in the manuals.

The document on principles (“Basics of Acoustics,” A2, quoted above) first gives a rationale for undertaking this endeavor

and then briefly explains the physical laws that govern sound production and propagation:

Since the mid-1900s, the steadily increasing population, rushing motorization, and the advancing mechanization of workplaces,

in households and in leisure activities have led to a continuous increase of exposure to general noise. The consequences are

concentration and sleep disturbances; damage to the autonomic nervous system, which can result in stomach, heart and

circulatory debilities; and noise deafness, which has been recognized as the number-one occupational disease.

Acoustics has been defined as the science of sound and its influence on human beings. For sound to travel from its source to

the human ear, it must be able to pass through air or other media. In the absence of any medium (vacuum), sound propagation

is impossible.

As sound pressure and frequency levels increase, so does the need to protect the human ear, where hearing ranges from “just

audible” to “painful.” Figure 2 lists the practical sources of noise that are commonly associated with these sound pressure

levels, from the peaceful rustle of leaves (just audible) to the painfully loud launch of a rocket (painful).

However, the sound pressure level has no direct linear relation to the irritation that the sound causes for human beings.

Here, the “physiological-psychological” effect must also be considered, as illustrated in Figure 3.

From these very fundamental considerations, the document goes on to detail the influence of the source geometry on sound

pressure change and sound propagation (Figure 4), and then to give the equations for sound propagation from different

sources, respectively, in reverberation rooms. (Figure 5). All in all, document A2 contains 38 of these equations.


Acoustic Insulation, Absorption and Attenuation

Document A3, “Product Characteristics—Acoustic Insulation, Absorption, Attenuation,” is a tool much more closely geared

toward the day-to-day needs of the practitioner. The focus is on the phenomena (e.g., distance) and material barriers (e.g.,

walls, screens, etc.) that diminish the sound pressure level of the noise propagating from a source, and how they make this

happen.

For instance, this document details the sound-absorbing qualities of “different types of walls” and what can be done to

reduce “structure-borne” and “airborne” sound. It also outlines the influence of material obstacles on the propagation of

sound. Figure 6 illustrates this, showing acoustic energy striking an obstacle and being reflected, absorbed and

transmitted.

This leads to a discussion of the sound-attenuation qualities of single- and double-layer walls, detailing the

sound-attenuation qualities of pipe insulations against the flow noise of media. The document explains the “law of mass”

equation, which predicts that each time the frequency of measurement or the mass per unit area of a single layer wall is

doubled, the transmission loss increases by about 6 dB.

Double-layer walls are discussed in some detail, as they constitute—in practical building applications—the solution of

choice when it comes to “sound insulating” rooms against each other. (Figure 7)

These brief explanations of the physical principles underlying propagation (e.g., the construction of barriers to sound

propagation) have practical implications, such as the sound reduction to be expected for different types of walls. There is a

clear correlation between total surface mass and the sound-reduction results. The sound-reduction quality of a double-layer

wall is increased considerably when a layer of mineral wool is inserted between the two walls. Although this does not

increase the total surface mass to a measurable degree, it does increase the sound-reduction properties.

The principles governing the sound-reduction qualities of double-layer walls, with or without an intermediate layer of

mineral wool, also govern the sound-reduction performance of insulated pipes: The pipe wall is the “first partition,” the

cladding is the “second partition” and the intermediate layer is the mineral-wool insulation. (Figure 8)

Normally, the two partitions are mounted on one frame, since the distancers connect them. Figure 8 shows how using a flexible

substructure between the pipe wall and cladding can diminish this “one-frame effect.” It also demonstrates a method for

increasing total surface mass by increasing the surface mass of the second partition-the cladding-with an added “de-booming

layer” on the inside of the sheet metal. This de-booming layer not only increases the surface mass of the cladding but also

lowers the propagation of the structure-borne sound into the cladding and the airborne sound outward of the cladding.

After traveling through the solid structure, the structure-borne sound is transmitted to the surrounding air, where it

excites a surface able to radiate like a loudspeaker membrane. In Figure 8, the “membrane” is the outer surface of the

cladding. If this transmission to the air around the structure did not occur, the human ear could not hear structure-borne

sound.

It is somewhat self-evident that the smaller the vibrating surface, the smaller the sound level. However, it is less obvious

that an increase in the rigidity of the transmitting structure may also increase the radiation efficiency and thereby the

sound level. This is the reason for the flexible substructure of pipe insulation claddings, where an attenuation of the flow

noise through the pipe is also a consideration.

Of course, as with all sound propagation and sound insulation phenomena, this depends very much on the frequency of the

sound. Figure 9 illustrates the sound-reduction qualities of pipe insulation with claddings and rigid and elastic

substructures, respectively, and the dependence on frequency.


Industrial Acoustics

The last of the three completed documents from the FESI acoustic documentation series is document A6, “Industrial Acoustics.”

This paper focuses on applying the information from documents A2 and A3 to industrial working environments. The document

begins with another short discussion of the principles of sound propagation indoors and out in the open and then concentrates

on “noise control.”

Distance from the noise source is a key consideration because the sound-pressure level decreases by 6 dB per doubling of the

distance between the source of sound and the listener. One important consideration for this “decrease by distance” is the

question of whether the propagation is spherical, hemispherical or quarter-spherical. In the equations shown in Figure 10, Lp

is the sound-pressure level and r is the distance from the source. The increase in sound-pressure level decrease per distance

is dependent on the pressure of sound-reflecting surfaces near the source.

In addition, the principles of industrial noise control are outlined in Figure 11, followed by practical advice on how to

organize and execute noise-control measures in an industrial environment.

This short overview of the content of these three papers is not an attempt at a full report on practical acoustical problems

and their solutions, as explained in the documents. Instead, the aim of this article is to indicate the ways in which

problems can be addressed and to relay the practical advice given in the documents regarding solutions for these problems in

insulators’ daily work.

Figure 1
Figure 2
Figure 3
Figure 4
Figure 5
Figure 6
Figure 7
Figure 8
Figure 9
Figure 10
Figure 11

dilemma: de-‘le-ma, noun—an argument presenting two equally conclusive alternatives

In the July issue of Insulation Outlook, we introduced the idea that managing performance with the goal of sending people

home safe at the end of the day frequently involves balancing dilemmas: two assumptions or conditions that are both true and

in opposition. We looked at the accountability dilemma—where what a supervisor controls is different from what s/he is

responsible for—and the risk dilemma—where acceptable risk differs from acceptable consequences. Both situations present a

real quandary.

In this second installment of our three-part series, we examine two more dilemmas that can send someone rushing off to the

medicine cabinet for migraine relief: the leader dilemma and the measurement dilemma.

The Leader Dilemma

The Hewlett-Packard (HP) board of directors’ decision to part company with CEO Carly Fiorina put the spotlight squarely on a

dilemma every high-profile business leader faces.

It might appear that this dilemma is all about the gap between what a leader is held accountable for and what that leader can

control or influence. That is the accountability dilemma, as described in the first article of this series on managing safety

dilemmas.

The leader dilemma is an entirely different animal, and a very troubling one at that. It is first and foremost about

leadership at the top of an organization. That should come as good news to just about every reader of this article: Most

people work and live a long way from the corporate suite.

But no one should get too comfortable. There is something in the leader dilemma for leaders at any level who want to send

their team members home safe at the end of every day. This gets to the heart of what it takes to be the leader and what

leadership styles produce the best results: Who makes the best leaders?

Let’s start with a question: Which of the following leadership prototypes makes the best business leader?

  • Type A: the high-profile visionary; a superb communicator who is a tough and unrelenting driver of change
  • Type B: the self-effacing, limelight-avoiding tactician who tends to focus on continuous improvement rather than radical

    transformation

These descriptions are oversimplifications of individual leadership styles, designed to make a point. Few leaders exactly

match either description, and there are plenty of good leaders who fit neither.

On the other hand, anyone who has been around an organization for a while has probably seen enough of both leadership

behavior types to recognize them and is likely to have an opinion on which style is the most effective.


So, which type of leader is best?

The modern theory of management teaches leadership techniques right out of the Type A description: Figure out the vision,

sell it to the organization and set about orchestrating the grand strategy to accomplish it. Stay relentlessly on task, but

leave the details to others. This is what “good” leaders are supposed to do (and is exactly why Fiorina was hired).

Type A leaders are not always the easiest bosses to work for, however, and that can play a big role in determining who makes

the better leader.


Working From the Bottom Up: Going From Good to Great

One reliable way to determine the most successful leadership style is to start at the bottom line, find businesses that get

the best results and examine the type of leaders who produced those results. Jim Collins did exactly that, as detailed in his

book Good to Great. The results are surprising.

Collins was a professor at Stanford University’s Graduate School of Business and is the author of Built to Last, a book that

documents the approach taken by businesses that “got it right from the start.” Successful companies that he researched

include General Electric Co., Johnson & Johnson, Wal-Mart and American Express. Ironically, HP was also one of those

built-to-last companies.

Built to Last was a bestseller, and Collins went on the lecture tour, giving speeches that drew crowds. However, audience

members often articulated what you or I would have wanted to say had we been there: “Nice to hear about a company that got it

right from the start, but that’s not my company.”

Collins heard that comment so many times that he finally decided to stop arguing and start looking: Which companies went from

average to great, and how did they do it?

When he started examining good-to-great companies, he set the standard high. “Good” was defined as average returns to

shareholders over a period of 15 years; “great” described shareholder returns that were three times the market average for 15

years. Thirty years of business performance ruled out any one leader’s good or bad effects.


Surprise, Surprise

So who showed up on the list of companies in Good to Great? First surprise: Not high-flying, high-tech companies. The winners

of the 1,473 companies examined were 11 rather standard names: The Kroger Co., Abbott Laboratories, Circuit City® Stores

Inc., Fannie Mae, The Gillette Company, Kimberly-Clark Corporation, Nucor Corporation, Phillip Morris, Pitney Bowes, Walgreen

Company and Wells Fargo.

The second surprise lies in the answer to the question, Was the secret of their success strategy technology, products, IT

and/or service? All played a role?but a supporting one. The foremost role was leadership—more specifically, leader

behavior. It turns out, there is truth to the quote by Peter Drucker, “Companies don’t compete; managers compete.”

What kind of leader behavior was associated with business results that went from good to great, Type A or Type B? The answer

even shocked the author. The leader behavior described as Type B was found as the single-most critical factor in achieving

the business results Collins described as “great.” Companies in the great group were led by a succession of leaders described

as “self-effacing, quiet, reserved, even shy—these leaders are a paradoxical blend of personal humility and

professional will.”

Sure, these leaders could communicate and had a sense of direction, but like the New England Patriots, they were the

consummate no-namers—passionate about getting sustained results but happy to give others the credit, with no need for

the limelight.


The Dilemma, Please

So where is the dilemma? Here’s one: How did these relatively low-profile performers find their way to the top of their

organizations in the first place? Most of those in charge of selection—not to mention those on Wall Street—are

far more inclined to choose Type A leaders, those who make waves and get noticed. More significantly, their leader behavior

styles fit the perceived norm of what leaders are supposed to do.

Were it not for Collins’ bottom-up approach, we probably wouldn’t know who the Type B leaders are. The last place one would

ever expect to see them is on the cover of Business Week. It’s unlikely that even an M.B.A. student could name more some of

the 11 CEOs.

Here’s another dilemma: How do these types get results? The Type B leadership style seems counterintuitive. After all,

leaders are the people making great speeches and heading charges up the hill, right?

Collins’ research suggests a different effect of the Type A leadership style, where the leader becomes the focal point of

everyone in the outfit. The focus is on them, potentially at the expense of performance.


A Different View

Maybe it’s time to rethink what leaders actually do. It turns out that the way they lead plays a pivotal role in sustained

business success and, there is every reason to believe, in sustained safety performance improvement. It makes sense, and that

is the message for everyone who shares the goal of leading people to work and back home safely.

Collins makes the point that the good-to-great leaders are fanatically driven to produce sustained results for the good of

the organization, no matter what it takes and no matter who receives credit. Harry Truman once said, “You can accomplish

anything in life, provided that you don’t mind who gets the credit.”

This type of leadership is needed at every level of an organization where leaders hold the safety of those who work for them

in their hands. The workers must be the focus of leadership efforts, with the goal of keeping them safe to pursue all the

truly important things in their lives.

Keep your eye on that target, and don’t think you have to be a Type A leader to get great results!


Epilogue

At a 1972 executive council meeting at HP—in response to an industry award nomination—Bill Hewlett remarked,

“Look, we’ve grown because the industry grew. We were lucky enough to be sitting on the nose when the rocket took off. We

don’t deserve a damn bit of credit.”

After a moment of silence Dave Packard responded, “Well, Bill, at least we didn’t louse it up completely.”

The Measurement Dilemma

No good deed goes unpunished.

Consider the law of unintended consequences: What starts off as a solution to one problem may wind up creating a far bigger,

unpredictable one.

This maxim explains all sorts of problems. For example, when NASA was worried about leaky O-rings on solid rocket boosters 20

years ago, seal-test pressure was increased to ensure that there would be no leaks. Another example: Two hundred years ago,

gypsy moths were imported to the United States as a potential replacement for silk worms. When the plan failed, a few moths

were released, and they ultimately created a swarm of insects capable of deforesting New England.

Solutions to improve safety performance are also susceptible to this law. In measuring safety performance, the law of

unintended consequences created the measurement dilemma.


Manufacturing Measurement, Then and Now

The sophisticated measurement processes in place in manufacturing operations worldwide are one critical factor in the

revolution of manufacturing productivity and quality seen in the last 25 years.

Those from the baby boomer generation know it wasn’t always that way. In the 1960s, measurement in operations was pretty

crude. Those working in production may have known how much was made, but they probably knew little more. If a product did not

meet specification, that was the quality inspector’s problem, not the workers’.

By the 1980s, that model was crumbling. Demanding customers simply weren’t buying that kind of product quality anymore, and

there were plenty of manufacturers willing to supply better quality products. Thus, industry changed.

Quality and productivity gurus with names like Deming, Juran and Crosby stressed “doing it right the first time.” This

approach required far better information and performance measurement than previously seen. Everyone got into the business of

performance measurement.

Unlike many management fads, this was a change that has not gone away. The world of manufacturing measurement was forever

changed and became subject to the pressure of continuous improvement: Over time, Two Sigma became Six Sigma.


Meeting the Numbers

Anyone who has spent a day in management knows that measuring performance is only one part of the job. Rewards also play a

significant role: Set the goal, measure the performance and then recognize and reward performance. This model has served

management well in the quest for quality.

Paying for performance also has been the source of unintended consequences. Troubles at Worldcom as well as a few other

well-publicized corporate accounting scandals have shown how “meeting the numbers” can go awry. Managers did whatever it took

to meet the numbers that Wall Street expected. Their personal fortunes were at stake.

“The probability that a performance measure will be corrupted is proportional to its use in determining compensation.” This

is Darly’s law, and Darly was right on the money. However, measurement as it relates to improving product quality has one big

factor on its side: It is virtually impossible to make the numbers into something that they’re not. Customers keep the system

honest.

As tempting as it might be to try to make product quality look better, the data are what they are. The process began by

defining quality as “conformance to requirements.” Darly defined the requirements, and the customers are the scorekeepers in

this game.

When it comes to product quality, “meeting the numbers” means meeting the numbers.


Measuring Safety Performance

In managing and measuring safety performance, “meeting the numbers” has long loomed large.

An old story illustrates just how far a company might go to keep its safety record: It seems a poor fellow working for one of

the industry leaders in safety had the misfortune of falling off the top of a smokestack. By the time he hit the ground, he

was fired. That’s one way to meet the numbers!

Measurement processes for safety run directly in the face of both Darly’s law and the law of unintended consequences. Here is

an example of each that has undermined the measurement system:

  • Believing that increasing the number of peer-to-peer safety observations would improve safety performance, a small reward

    was offered to employees making two or more safety observations each month. The number of observations steadily increased,

    but safety performance did not. As a matter of fact, those filling out safety observation cards had an injury rate higher

    than their nonparticipating peers.

  • Convinced that better results from safety audits ultimately would lead to improved safety performance, the internal

    safety audit process was stepped up. Performance rewards and consequences were established based on audit findings. Getting

    “audit-ready” took on a life of its own. Audit grades improved, and that led to even tougher audits. Meanwhile, safety

    performance headed in an independent direction. Over time, audit scores and safety performance no longer aligned.

It is not difficult to see the effect of Darly’s law and the law of unintended consequences in each case. It appears that no

good deed goes unpunished.

Things don’t always go this way, though. There are plenty of success stories on the impact of observation and audit programs.

However, there are enough failures to suggest that the problem is real.


Defining The Measurement Dilemma

Here, then, is the measurement dilemma: Measurement is a vital part of managing and improving safety performance—”If you

can’t measure it, you can’t manage it”—but the process of measuring can alter behavior.

A change in behavior can be beneficial; however, it also may be simply a case of management getting the desired data. In the

latter case, the value of the measurement is diminished or nullified.

Unlike product quality, when it comes to measuring safety performance, there is no customer to help keep the system honest.

The dilemma is more pronounced when behavior is being measured and is particularly acute when the factor being measured is

used as a “leading indicator.”

If that is the case, and if management does not appreciate what is really happening, this can lead to a false reading about

performance improvement.


Results and Consequences

How can you step up measurement without creating unintended consequences? Here are three ideas: Beware of certainty, use

multiple measures and remember Darly’s law.

Naming the beast is the first part of taming it. In physics, this is called the uncertainty principle: You can’t be sure

about everything you observe. For safety, this is the measurement dilemma. The best way to manage the problem is to beware of

certainty: Don’t fool yourself into thinking that the data present an accurate picture of what is really going on.

Multiple measures are better than one. In performance measurement, this is known as the “balanced scorecard” approach: Do not

depend on just one measure of performance or leading indicator as the means of understanding what is happening.

If the factors don’t match up, that should be the tip-off to dig deeper into the numbers to see what is really going on. For

example, audit scores are up, but injury performance is flat or down. Why?

Incentives can be a great way to encourage and recognize the right behavior, but they can also undermine the measurement

system. Ignore Darly’s law at your own risk. If incentives are used, the Darly effect should be considered.

All of this means that leaders have to rely on other means to calibrate underlying behavior and performance, and on other

methods to drive change and improvement. For example, if an incentive for safety observations is to be used, it could be

paired with an independent audit of behavior. If audit performance becomes important, audit scores should be correlated with

bottom-line safety results.

The Final Word

The measurement dilemma should not discourage leaders from applying the techniques of performance measurement to the process

of managing safety. Leaders should just be sure to recognize the various factors that come into play: For this dilemma,

recognition is the name of the game.

The 2005 Group of Eight (G8) Summit, as greatly publicized, addressed the issues of climate change, clean energy and

sustainable development. How will this meeting of the world’s eight largest industrialized democracies affect industry?

Probably more than most professionals realize.

Because the United States reportedly has the highest greenhouse gas emissions per capita, G8 Summit leaders are asking our

country to participate more actively in improving the global climate. These world leaders also agreed to extend more

resources and consideration toward the use of renewable energy in their own regions. However, as trends and numerous

governmental agency reports reflect, the use of fossil fuels aren’t predicted to decline anytime soon.

U.S. industries are some of the largest consumers of fossil fuels, and as a result, top the list in greenhouse gas emissions.

It should be no surprise, then, that our leaders are seeking to promote already-existing programs—and the creation of new

ones—to clean up the industrial processes that require the use of these fuels; most visibly through the recent passage of an

energy bill.

When locating ways to improve energy efficiency, plant managers consider many plant-wide systems, but none have proven to be

more cost-effective than the insulation system. Insulation professionals, be prepared for a potentially growing market.


Causes and Effects of Global Warming

Evidence of the long-term effects of burning fossil fuels was presented at the ’05 summit (www.g8.gov.uk). In the past century, temperatures have risen by 0.6 C and are predicted to

continue rising between 1.4 C and 5.8 C over the next century. This warming causes a domino effect: Record amounts of arctic

ice melt, which causes the sea level to rise, which causes more floods and other natural disasters to occur and more potable

water to become salinated, and so on.

Scientists worldwide believe that most of the warming has been caused by human activity since the mid-1800s because the

amount of carbon dioxide (CO2)—the major gas that causes climate change—in the atmosphere has increased by 30 percent since

then.

The U.S. Environmental Protection Agency (EPA) reports that industrial energy use accounts for nearly 30 percent of total

U.S. greenhouse emissions, which result primarily from electricity use, product transportation, burning fossil fuels to power

boilers and produce steam and using gasoline to power vehicle fleets.


Addressing Energy-Efficient Practices

To address these issues, the G8 leaders agreed, in part, to further promote energy efficiency in their buildings using

existing and newly established building codes and to advance efficiency in industry through better technologies and

evaluations.

Two proven methods of improving industry efficiency are through case studies and plant-wide assessments. These procedures

give plants the opportunity to locate where they are losing energy, where they could decrease greenhouse gas emissions and,

as a result, cut costs and save money.

Numerous resources are available for U.S. plants to assess their facility. The Department of Energy (DOE) has been providing

such procedures—free of charge—through their Industrial Assessment Centers since 1976. Over the years, the DOE has saved

small- and medium-sized American companies more than $700 million through such improvements.

“Surveys done on plants that have had these assessments show that insulation improvements top the list for energy savings,

along with steam-related improvements,” notes National Insulation Association (NIA) Executive Vice President, Michele M.

Jones. “That fact only enforces the mission and 50-year work of the NIA.”

One of the most cost-effective technologies for improving plant efficiency is the insulation system. When plant managers

review their insulation system for maximum efficiency, this can save money with lower fuel costs and reduce plant emissions

as well. More information on locating a certified insulation energy appraiser to perform a plant assessment can be found at

www.insulation.org/training/ieap/appraisers.cfm.