Category Archives: Global

Economic turbulence has left many U.S. business leaders skeptical of resurgence. However, despite recent setbacks, the outlook is bright for many of the industries that benefit from mechanical and industrial insulation–as well as the mechanical and industrial insulation industry itself.

Macroeconomic Situation and Outlook

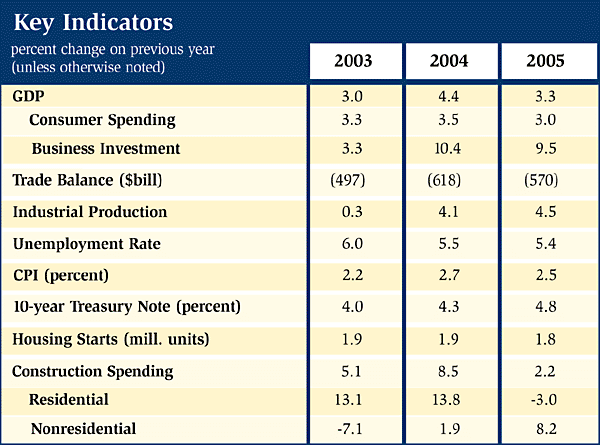
Despite an unexpected steep increase in oil prices and a second-quarter slowdown, the U.S. economy continued its expansion during 2004. Following three consecutive years of job losses, the economy added 2.2 million jobs. While job growth was weaker than expected, those new jobs generated personal income that translated into strong consumer spending, which was up 3.5 percent for the year. A strong showing at the end of the year pushed retail sales up by 7.4 percent. Despite these gains, consumers were somewhat constrained by high oil prices, which spiked to a record high $55 per barrel in October, following supply disruptions from an unusually strong hurricane season on top of already tight supplies.

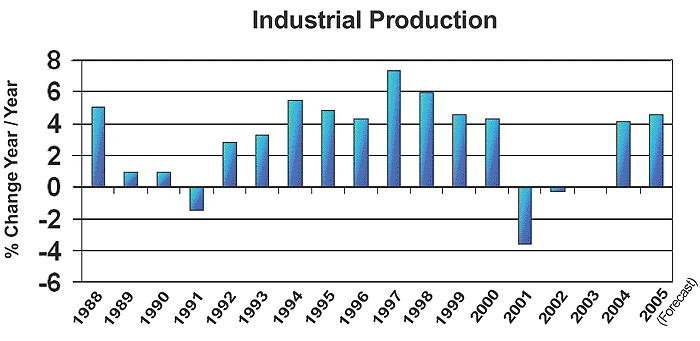
Consumers also faced higher inflation in fuel, food and medical care costs. But the U.S. economy proved resilient, and business conditions continued to improve. Industrial production rose by 4.1 percent, up from stagnant growth in 2003. As the industrial sector improved, so did companies’ balance sheets. The business sector rebounded with investment growing by 10.4 percent, the best year since 1998, when companies geared up for Y2K. And for the first time since the late 1990s, the business sector was the engine of growth. As a result, gross domestic product grew by 4.4 percent, the fastest since 1999.

Despite such a strong showing, several chinks in the armor have emerged, including growing trade and budget deficits and a lower savings rate. Driven by a dollar that is still strong relative to the Chinese yuan (which is pegged against the dollar), and strong domestic consumption, the trade deficit surged from $496 billion to $618 billion in 2004. Exports grew 11.6 percent on a lower dollar (relative to most free-floating currencies), but imports increased 15.8 percent. Also of concern, the budget deficit grew to $412.6 billion from $377.1 billion and the national savings rate dipped to 0.8 percent, the lowest level ever.

While challenges exist, the outlook for 2005 is solid. Expansion is set to continue for a fourth straight year, aided by lower oil prices, more job growth and sustained business investment. The Federal Reserve will continue its interest rate-tightening regimen. Oil prices are expected to be lower in 2005, averaging $42 to $45 per barrel, and inflation will be moderate. As the dollar drifts lower, exports will grow more rapidly than imports for the first time in nearly a decade, contributing to a smaller trade deficit. An additional 2 million jobs could be created this year, raising personal income. Combined with lower oil prices, this will allow consumer spending to rise 3 percent.

During the economic downturn, many companies postponed replacement and upgrade investments. Business investment rose sharply last year as profits returned. As the economy keeps growing, companies will likely maintain higher levels of investment. Business investment will rise 9.5 percent this year, compared to a 10.4 percent gain in 2004. Business investment in equipment and software was up 13.8 percent in 2004, with a surge in the fourth quarter from companies taking advantage of the last year for bonus depreciation. Companies will also continue inventory rebuilding, which will add to growth.

All told, 2005 will likely see the return of the so-called Goldilocks economy–not too hot, not too cold. Look for gross domestic product growth of 3.3 percent this year. According to a recent survey of economic forecasters by the Wall Street Journal, there is only a 11 percent chance of recession during 2005. However, there are several important risks to economic growth: a sharply lower dollar; higher oil prices; low savings rate; and looming trade and budget deficits. Furthermore, no contemporary economic outlook would be complete without the caveat that another terrorist attack could change everything.

Construction Outlook

During 2004, total construction spending rose at a rate of 8.5 percent as nonresidential building returned and homebuilders eked out one more solid year. The Dodge Index, a measure of construction activity, was up 9.5 percent in 2004. Last year, homebuilders posted 1.93 million housing starts, including 1.59 million single-family homes. Nonresidential contractors had their best year since 1998, with construction spending for private nonresidential building up by 1.9 percent, including gains in the commercial and manufacturing sectors.

Following four years of rapid growth driven by the housing market, construction is set to slow down in 2005. The residential sector that has boomed thanks to historically low mortgage rates will cool down as interest rates move back up. New housing starts are expected to fall by 5 percent this year to 1.83 million units. As a result, residential construction spending is set to fall by 3 percent.

However, commercial, industrial and public construction will pick up the pace this year. Retail construction has been growing and is driven by new home construction in addition to expansion by large retailers. Because there is a lag between new housing developments and the emergence of nearby shopping centers, growth in retail is expected to continue through 2005. Office construction is also growing, following several years of near dormancy following the glut of office space vacated by the dot-com bust. Office vacancy rates have fallen from 18.2 percent at the end of 2003 to 17.4 percent at the end of last year. McGraw Hill estimates that 170 million square feet of new office space will be built in 2005, up 9.7 percent from 2004.

Construction at utilities will fall, as much of the 200 gigawatts of new natural gas-fired capacity installed at the beginning of the decade is sitting idle, dampening demand for new generating capacity. Manufacturing construction will be a bright spot, however. The manufacturing recession that began in mid-2000 was the longest and deepest downturn in the post-World War II period. As discussed below, the manufacturing recovery has gained momentum that will continue through 2005. As business conditions and profitability continue to improve, capital expenditures on plant and equipment will rise as companies expand and accelerate capital maintenance projects and new construction that were delayed in years past. Nonresidential building construction will rise by 8.2 percent this year. Overall, construction spending is set to rise by 2.2 percent in 2005.

Industrial Outlook

Coming on the heels of one of the worst downturns in recent history, the industrial sector rebounded in 2004. Industrial production rose 4.1 percent in 2004 following three years of decline. Durable manufacturing, and in particular, high-tech manufacturing posted the largest gains. Capacity utilization rose from 75.5 percent to 78.1 percent, the largest one-year gain in more than a decade.

The Purchasing Managers Index, a measure of manufacturing activity, averaged 60.5 last year (a reading above 50 indicates expansion in manufacturing activity) and reached record highs during the first quarter. Business inventories rose 4.8 percent, but sales advanced at a faster rate, pushing the inventory-to-sales ratio to historically low levels. Much of the manufacturing recession can be blamed on a large inventory correction. As a result, businesses have been reluctant to rebuild large inventories. Additionally, improved supply-chain management practices and the substantial investment in computers and software have allowed companies to hold leaner inventories than in past years. At the end of 2004, inventory growth was picking up, reflecting optimism among market participants.

This year will be one of continued growth in the manufacturing sector. Industrial production will continue to improve, posting gains of 4.5 percent, and capacity utilization will tighten to 80.4 percent as businesses rebuild limited inventories.

Insulation End-Use Markets Outlook

Among the industries that posted gains in 2004, many were major consumers of industrial insulation, including chemicals, food processing, gas processing, shipbuilding, petroleum refining and paper. The outlook for 2005 is for continued gains as the manufacturing recovery moves forward. Not surprisingly, many insulation end-use industries are energy-intensive. Historically high oil and natural gas prices in 2004 motivated energy efficiency investments. This trend is likely to continue as prices are set to remain relatively high for several years to come.

Chemicals

Despite continued high energy prices, the chemical industry had a strong year with shipments up by 9 percent to $501 billion as demand strengthened in many consuming industries. A recovery was seen in nearly every segment of the chemical industry as volumes were up significantly from 2003. Total chemical industry volumes were up by 5.5 percent in 2004 and are expected to grow by 3.4 percent in 2005 and 2.9 percent in 2006, according to the American Chemistry Council (ACC). Petrochemical volumes were up by 5.9 percent in 2004, with gains of 2.5 percent expected in 2005 and 1.3 percent in 2006. Overall basic chemical volumes were up 4.5 percent for the past year and are expected to rise by 2.1 percent this year and 0.9 percent in 2006. ACC projects capital spending by chemical companies to grow 10.3 percent in 2005 to $25.7 billion, with a 13.0 percent gain in capital spending for the chemical industry, excluding pharmaceuticals. In 2006, spending growth will slow to 5.4 percent.

Food Processing

As food processors shifted their product lines toward low-carb and convenience items, shipments rose 5.6 percent following a 2.3 percent gain in 2003. Food processors found themselves squeezed between increasing retail price competition and higher prices for dairy, meat and other agricultural commodities. The outlook for food processing remains solid, with additional growth in prepared foods and nutraceutical foods and beverages. Additionally, exports of food, feed and beverages will rise as the dollar continues its move downward. In 2004, $55.9 billion worth of food products was exported.

Gas Processing

Since the mid-1990s, U.S. consumption of natural gas has grown more than any other fuel. In addition to its use in the residential and commercial sectors, natural gas is increasingly being used by the electric generating sector because of its relatively clean-burning properties. The U.S. Energy Information Administration (EIA) forecasts that natural gas demand will rise by 3.7 percent in 2005. Natural gas liquids (NGLs), i.e. ethane, propane and butane, are stripped out for sale to fuel distributors and petrochemical producers. As petrochemical demand has picked up, so has demand for ethane, the primary building block for ethylene, and other NGLs. The industrial production index for natural gas liquids extraction grew by 5.8 percent in 2004, following an 8.9 percent decline in 2003 as record high natural gas prices, held back the petrochemical recovery. Gas processors will also see a boost in coming years as more liquefied natural gas (LNG) capacity is brought online to meet soaring U.S. demand for natural gas.

Shipbuilding

Reflecting trends in greater global trade, defense and rising consumer spending, shipments of ships and boats grew 9.8 percent in 2004, following a 17.8 percent growth in 2003. The industrial production index for shipbuilding rose 8.8 percent in 2004. At the end of 2004, new orders for ships and boats were up, suggesting continued strength in 2005. Even as defense spending is set to decline, rapid growth in international trade will fuel demand for shipbuilding for the foreseeable future. Of particular interest are new orders for refrigerated tanker ships to transport LNG as world capacity expands. However, these tankers are not currently produced domestically.

Petroleum Refining

Oil prices surged as demand growth far exceeded supply growth, especially in the face of multiple disruptions from geopolitical and natural forces. Crack spreads (a measure of profitability for refiners) in 2004 were the highest in a decade. However, there will likely be downward pressure on margins as supply growth outpaces lower demand growth during the second half of 2005. In 2004, U.S. refinery capacity utilization fell to 92.2 percent, reflecting additions to capacity and hurricane-related shutdowns. EIA forecasts refinery capacity utilization to tighten to 94 percent in 2005 before easing slightly to 93.4 percent in 2006. EIA also projects capacity additions for an additional 200,000 barrels per day in 2005, pushing U.S. refining capacity to 17.1 million barrels per day.

Pulp and Paper

As with several other nondurable sectors, the pulp and paper industry has lagged the recovery. Following a 9 percent drop during longest and deepest downturn in the paper industry, the industry rebounded in 2004, driven by higher demand for packaging paperboard from manufacturers and paper by offices and publishers. The industrial production index for paper rose 1.6 percent in 2004 following a 0.5 percent decline in 2003. Reflecting the manufacturing recovery, the strongest growth occurred in paperboard, which grew 3.5 percent last year. Higher volumes combined with firmer pricing raised shipments of paper products by 7.4 percent in 2004, following 5.4 percent growth in 2003. According to the American Forest and Paper Association, output of paper and paperboard is set to grow by 2.5 percent during 2005. Pulp production typically follows paper and paperboard; so similar gains are expected in that sector as well.

Power

Power generation is dependent on economic growth and the weather. Despite a relatively mild summer, electricity generation grew by 2.1 percent in 2004 on stronger economic growth. EIA forecasts electric generation to increase by 3.4 percent to 4,062 billion kilowatt hours in 2005. New projections by EIA show that 26.6 gigawatts of capacity additions are planned at U.S. electric utilities in 2005, including 23.9 gigawatts of natural gas-fired generation. This is down 28 percent from last year’s estimates, reflecting concern over natural gas supplies and prices.

Conclusion

The fundamentals are in place for this year to see a return to the economic growth trend. Look to the strengthening business sector to drive growth in 2005 as corporate profitability strengthens and business conditions improve. Consumers will provide steady gains. Construction spending will rise slowly as gains in nonresidential building are offset by a cooling housing sector. The outlook for the insulation industry is strong for 2005. Growth in manufacturing construction, and increased capital spending, especially with an eye toward energy efficiency, will drive insulation sales in the coming year.

Figure 1
Figure 2
Figure 3

Commercial and industrial insulation material availability was taken for granted for decades until two catastrophic fiberglass manufacturing facility fires occurred in February and May of 2003. The instantaneous loss of industry capacity created a disruption of supply, not only for the fiberglass segment, but also for manufacturers of alternative materials as they stepped forward to fill the supply void. Within a few months of the fires, the entire industry felt the financial and operational impacts. Many lessons were learned. The availability of insulation materials may never be taken for granted again.

All manufacturers or product lines have extended lead times, planned availability or even allocation at one time or another, for a variety of reasons. However, in the past they were usually short-term in duration, weeks or months versus years. Those situations challenged relationships but were generally viewed as troublesome yet manageable. The supply void created by the 2003 fires may have changed the way many examine supply-chain alliances and their views on demand versus capacity.

As with so many catastrophes, the primary focal point of ensuing discussions related to the hardship caused by the fires. Yet while many individuals and companies incurred some degree of hardship, credit is due to those who stepped forward to address those hardships in a responsible and professional manner, including the two manufacturers, the employees and the families who suffered the personal impact of the fires. The industry responded in a proactive, forward-thinking manner. The strength and resolve of the commercial and industrial insulation industry was evident.

Immediately following the fires, many of those involved in the industry began asking for statistical data related to the current and anticipated demand for insulation materials versus manufacturing capacity in the United States. They were surprised to discover that information was not historically or currently available in the public domain, especially if multiple materials for similar types of applications are incorporated within the data.

The question of demand versus available capacity in the United States is not a simple question–it has many components and a degree of complexity that you would not initially expect. The competitiveness between material groups as well as information confidentiality barriers are certainly some of the reasons why this type of statistical data has not been developed, published and measured on a routine basis. The degree of complexity increases when the geographical scope of the question is expanded to all of North America or beyond. Following are a few examples of these complexities.

Domestic Versus Foreign Consumption

To determine consumption in the United States, manufacturers would need to track shipments based upon point of use, but most of them currently track shipments in great detail based upon point of shipment or destination. Generally, the point of use is within a 200-mile diameter of the destination location; however, there is a portion being exported by distributors, fabricators and contractors. Is that number significant? It could be, especially for materials that require fabrication, for materials that are not produced in the destination country or for those occurrences when the material of choice is produced in the United States.

Domestic Versus Foreign Manufacturing

There are several manufacturers with plants outside the United States that participate in and are major contributors to the market in the United States. Others may supplement their U.S. capacity with materials made outside of the United States. Once again, measurement processes would need to differentiate the point of manufacturing versus point of use.

Distributors, fabricators and contractors are also directly importing materials. Is that number significant? Probably not, but it was of significance within the six to nine months following the 2003 fires. Whether or not it will continue is the more relevant question.

Over time, the importation of foreign manufactured materials could have a noticeable impact on the U.S. market. Buyers and end-users in the United States are more accepting of non-U.S.-made materials now than in the past.

A caution flag should be raised to those individuals and companies that are considering the use of foreign-manufactured materials. They need to ensure those materials are proven, and that their composition, quality and performance standards are measured on the same basis as the U.S.-manufactured materials. Many of the imported insulation materials are on a comparable basis while others may be assumed comparable but are not being measured to the same standards. If those assumed-comparable materials are inferior and ultimately produce a failure, the industry pays the price. While availability and potential economics may support the purchasing decision, assumption of equivalence could offset those values. The wrapper may look the same, but are the application and performance the same or better?

Acceptance of Alternative Materials

When examining industry capacity, there should be a review of the alternative materials available for each particular application or use. That review process was put to task after the 2003 fires. The use of alternative materials was a major contributor to filling the supply void. When considering the dynamics of the market, one could conclude that the only true analysis of demand versus capacity should be by material type and end-use criteria. Simply looking at the demand versus capacity by material type may be too narrow a view.

Alternative materials gained market share after the 2003 fires. Will they maintain those gains? Many agree that they will lose a major portion; however, they will yield a net gain. This exhibits the power of specified and traditionally used material. The power of being the incumbent does not only apply to politics. Domestic specification writers, end-users and insulation contractors are historically reluctant to change material preferences; however, many now view alternative materials in a different perspective.

Manufacturers Supporting Multiple Markets

This article focuses solely on the commercial and industrial insulation market segments, which some refer to as the National Insulation Association (NIA) world. Many agree that the NIA world does not encompass the majority of the insulation-related activities in the heating, venting and air conditioning market segment. Also, the residential, original equipment manufacturer, automotive, appliance, aerospace and other specialty markets are not generally included in the NIA world.

Most insulation manufacturers that participate in the NIA world also support other industry segments, which is not a problem until you delve into market need versus capacity. Simply stated, the issue is the law of supply and demand intertwined with corporate-shareholder objectives to increase profitability.

Many NIA-world materials are produced on, or are fed from, the same equipment that produces material for other markets. If the demand is equal to or greater than the non-NIA-world markets, and those products carry a higher degree of profitability, from the perspective of profitability at that manufacturer, it is easy to surmise which material would get manufacturing time preference.

This is a good example of why the NIA world should reasonably monitor activity in other markets. It also highlights the competitiveness between market segments. In some instances, NIA-world materials are competing for production time within their own manufacturing facilities. Instinctively everyone wants to sell at the highest price, and conversely, buy at the lowest price possible. Therein lies the age-old conflict that sometimes has consequences for one or more channel participants. In a world where all market demands are relevantly consistent and product-material line profitability between markets is similar, this is not a problem. Where is that perfect world?

Although few will openly discuss the importance that all channel participants make a fair and reasonable return on their investment, everyone supports the theory. However, each of these companies operates in a highly competitive environment, often global in scope, which may drive behavior that is in conflict with support of the theory. It is a balancing act for all market participants. This is not new and will not change in the near future. Most in the industry do a good job of balancing these issues within their mutual businesses, but the way businesses are being examined today, both internally and externally, has changed. Those changes may eventually modify the traditional NIA-world buying and selling processes and challenge relationships. Whether those changes are good or bad will depend upon your perspective and the impact they have on your business.

Survey of Market Trends

Knowledge of these complexities does not answer the question of need versus capacity. If anything, it begs more questions. However, armed with this knowledge, NIA conducted an informal phone survey of leading insulation manufacturers in the commercial and industrial industry, all of which were NIA associate members.

The survey included discussion about how best to categorize material groups to provide clarity and meaningful information. It encompassed a wide variety of subjects related to estimates on the current level of U.S. manufacturing capacity currently utilized by material groups, estimated growth rates for 2005 to 2007, and manufacturing expansion or improvement initiatives to meet future demands. The manufacturers who participated were supportive of the intent of the article and the need for the information. Their open-minded and cooperative attitude was much appreciated. A listing of the participating manufacturers is included at the conclusion of this article.

Given the complexity of the subject, the diverse approach utilized by the participating manufacturers, and the differences in their core businesses, this author derived an estimate–albeit a non-scientific 30,000-foot-view–on the industry demand versus manufacturing capacity. In summary, there currently appears to be adequate capacity in all material groups through 2007. Tightness of supply and extended lead times in some material groups may occur intermittently.

With history as an example, there should be adequate capacity to sustain demand should another catastrophe occur, or if demand estimates exceed expectations–which would be a good problem. The combination of production improvements and expansion initiatives, materials available from foreign manufacturers–many of which are affiliates of manufacturers currently supplying the U.S. market-and alternative material solutions should be more than adequate to fill the respective material group market demands.

Examination of the individual material groups supports these conclusions.

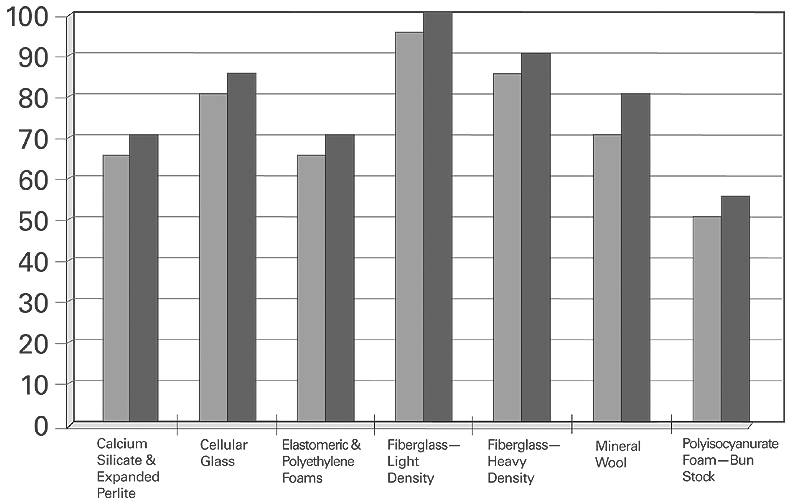
  • Calcium silicate and expanded perlite, with an upper temperature limit of 1,200 F, are primarily used in the industrial market and are estimated to be producing at less than 65 to 70 percent of capacity.

  • Cellular glass is used in applications of -450 F to 800 F. As such, it is used in the commercial and industrial markets. Capacity utilization is estimated between 80 and 85 percent.

  • Elastomeric and polyethylene foams are used in the commercial and industrial markets, applications of -70 F to 350 F. The estimate of capacity utilization for this material group is 65 to 75 percent.

  • Fiberglass (sometimes referred to as mineral fiber) has an operating range of 0 F to 1,000 F. To better review the capacity utilization of this material group, it is necessary to categorize the group into segments. Each manufacturer may categorize the segments differently and even add segments. For simplicity reasons and for purposes of this article, the fiberglass material group was subdivided into two segments: 1. light density, which is generally defined to include building insulation, duct wrap, metal building insulation and similar materials; and 2. heavy density, which includes pipe insulation, duct liner, board and similar materials. The capacity utilization is estimated to be 95 to 100 percent, and 85 to 90 percent, of the respective segments.

  • Mineral wool (sometimes referred to as mineral fiber) is used in the commercial and industrial markets with a temperature range of 0 F to 1,200 F. Similar to fiberglass, this group could be broken down into multiple segments. It is estimated that the combined capacity utilization is 70 to 80 percent.

  • Polyisocyanurate and polystyrene foams, with a temperature range of -297 F to 300 F, is used in the commercial and industrial markets. Polyisocyanurate is manufactured in many different forms. The most widely used form in the commercial and industrial markets is a fabricated end-product commonly referred to as "bun stock." Capacity utilization for polyisocyanurate is estimated at 50 to 55 percent. Polystyrene is used in a vast array of markets and is manufactured in equally as many forms. Because of the diverse manufacturing options by numerous manufacturers, it is very difficult to estimate capacity utilization for a single market. It is fair to say that there is more than adequate capacity available.

  • Other material groups such as phenolic, melamine, polyolefin and polyimide foams are used in a wide temperature range within both segments of the industry. Although these material groups were not part of the survey, it is estimated that each material group has capacity available to supply their commercial and industrial markets.1

Figure 1 represents the estimated current manufacturer capacity utilization range for a variety of materials. Each manufacturer’s capacity utilization may vary from the listed range. The capacity utilization percentages are intended to represent an industry estimate at a given point in time. Estimates could easily vary from month to month.

The next part of the equation is, what are the projected growth rates for each of the material groups? Is there sufficient capacity available to supply the demand during the next three years?

Projected growth rates vary, sometimes greatly, depending on who you ask, what data you rely upon and from what perspective you are preparing the information. As usual, any growth projections include a long list of caveats and can vary widely by geographical area. The projections discussed herein are no different. The usual listings of caveats apply, and the projections are broad-industry-wide in scope for the U.S. market.

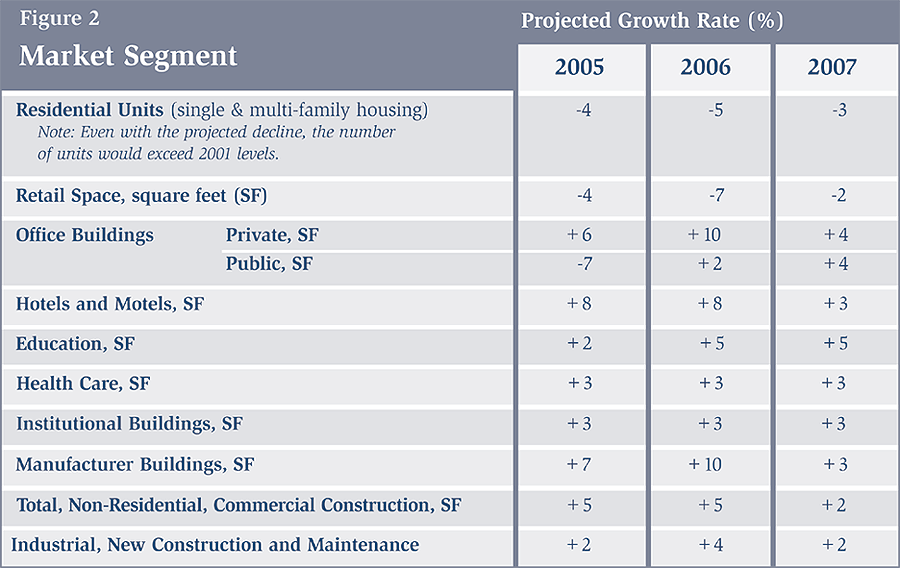
In reviewing forecasts from several economists and construction forecasting organizations, growth "interpretations" could be drawn for specific market segments, such as the ones shown in Figure 2.

There are other market segments that are not shown. It is worthy to note that there are many definitions of market segments and what comprises each segment.

Dollar growth is projected to be 2 to 4 percent higher than unit growth, which reflects moderate inflation-depending on how one defines moderate.

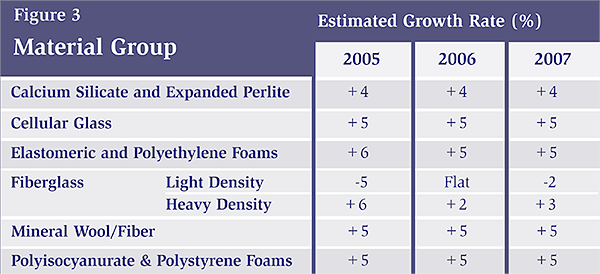
Based upon the informal survey conducted with the insulation manufacturers, the estimated growth–basically an arbitrary average of the responses–was determined by material group. The percentages shown include some combination of unit and dollar growth estimates. Survey data did not provide enough information to demonstrate an allocation between the two. Some degree of inflation is expected. One can assume it might be in the realm of the inflation rate previously discussed. See Figure 3.

A direct comparison between market segment and material group growth estimates is somewhat problematic. Regardless, when comparing either growth estimate to the material available, there appears to be adequate capacity in all material groups. That confidence is further supported by the previously announced capacity expansions and improvement initiatives by many of the insulation manufacturers. The manufacturers are continually examining ways to improve and increase their quality and productivity. There could be some tightness of supply, manifested in occasional extended lead times on some products, and from manufacturer to manufacturer as production lines are taken down for maintenance and during peak demand periods.

Considering the previously announced plant expansion or improvement initiatives, coupled with anticipated future gains in productivity in comparison to projected market growth, this author envisions a meaningful excess capacity scenario in late 2006, or early 2007 for some material groups.

During the survey, several opportunities and observations were noted:

  • Will the high cost of energy continue to increase? It may drive inflation, but it will also potentially increase the number of opportunities for insulation.

  • Will increasing interest rates slow construction activity? The housing market could be the lead indicator, if the decline is greater than anticipated, for example.

  • When will material requirements being consumed by China begin to decline? With that decline will global competitiveness increase within the United States?

  • Health care and all forms of energy, oil, natural gas, diesel fuel and gasoline could be the primary inflation drivers. These costs have had an effect on all industry segments, and will continue to do so.

  • Maintenance in the industrial market has been curtailed in the last few years. The return of that market may be critical to the industrial growth during the next one to two years.

  • The United States continues to increase its consumption of energy, which will eventually drive growth in the power segment.

  • Newly enacted and soon-to-be-adopted state energy codes will drive growth through increased insulation thicknesses.

  • Private energy conservation programs will drive the use of increased insulation thicknesses and new opportunities.

  • There is a need for a federal energy policy that provides incentives for commercial and industrial energy conservation.

  • The green movement will continue to gain momentum. With that, opportunities will be developed, and the search for new or alternative materials and insulation systems will increase.

  • Building vacancy rates may undergo renewed examination as the at-home workforce continues to increase.

  • The environment and pollution control will once again begin to take center stage in many markets, which will create growth opportunities for the insulation industry.

  • Mold removal and prevention will continue to drive growth opportunities.

  • Global events have an increasing impact on our industry every day.

In summary, looking past the numbers–if that is possible–those interviewed felt bullish about 2005 and 2006 while a few concerns were voiced for 2007. The opportunities are abundant. There appears to be sufficient capacity in all material groups, although extended lead times could develop from time to time.

The availability of commercial and industrial insulation materials may have been taken for granted in the past. That confidence was shaken as a result of the 2003 fires, which has an impact on the entire industry. However, that confidence has been or will be restored in the near future. All industry segments–manufacturers, distributors, fabricators/laminators and contractors–did a tremendous job in managing a very bad situation, demonstrating the resolve of the commercial and industrial insulation industry or NIA world–a good place to be.

1Note: NIA’s "Insulation Materials Specification Guide" developed for its National Insulation Training Program was referenced to determine the application temperature ranges listed herein. Some material types have been combined for purposes of this article. Each material type may have a different application temperature range. The temperatures listed do not necessarily indicate that a material is appropriate for use within the temperatures given. Specific manufacturers should be consulted for their detailed recommendations.

Figure 1

Current Estimated Manufacturer Capacity Utilization Range

Figure 2
Figure 3

The power-generating industry uses 90 percent of the coal mined in the United States to produce about half of U.S. electrical power. Coal is easily transported and it is relatively inexpensive. It costs about $3 to generate a million British thermal units (Btu) of power using coal, compared to more than $7 to generate the same amount using natural gas or oil, according to the U.S. Energy Information Administration.

However, coal-related emissions are blamed for a high percentage of the total nitrogen oxide (NOx), sulfur dioxide (SO2), and mercury emissions in the United States. The head of the U.S. Environmental Agency predicted that in order to meet the Clear Skies Act, power-plant owners would need to spend more than $50 billion on new air-pollution-reducing equipment or steam-generating boilers. Southern Company, for example, recently budgeted $5 billion for scrubbers and related equipment to help cut back on air pollution. With these factors in play, it is necessary for the power-generating industry to understand bid prices in order to remain profitable.

Cash flow and profitability are achieved through money management, cost control and the ability to recognize profits unseen by ordinary bookkeeping techniques. What appears to be a low or high price may not be that simple. One must evaluate the pricing formula, based on the four rules of bidding (see below), before deciding whether the price is high or low. Part of this pricing formula recognizes cash flow and the terms of payment connected to the dollars presented in the bid price. This recognition of cash flow and attention to the terms of payment must be included in the evaluation of a bid price.

Determining the size of a major air-pollution project, in terms of material and labor, requires an in-depth understanding of marketing strategy, engineering, manufacturing, labor costs and the proper structuring of the bid price. Major capital projects should never be a cost-plus-markup approach as used on off-the-shelf goods. Both the bidder and the company soliciting the bid need to carefully evaluate the bid price. This means understanding the four rules of bidding:

Rule 1: A bid price should be based on good achievable performance.

Rule 2: A bid price should always reflect the conditions of the day.

Rule 3: A bid price should recognize design considerations.

Rule 4: A bid price should take into consideration the customer’s financial position.

Looking at rule four also means asking tough questions such as: Do you as a bidder recognize cash flow as a profit or loss item? Does the potential customer or bidder recognize cash flow, and do they have a cash flow problem? Do you as a bidder have a cash flow problem?

The ideal way to operate is with other people’s money. But how do you accomplish this? The answer lies in the terms of payment and billing. Depending on the size of the project, terms of payment can be set in many ways, including, 1. as a percentage at the time of the order, 2. as a percentage upon shipments, 3. as a percentage upon completion, 4. as a guaranteed retention, 5. all up front and 6. all upon completion.

Each of these terms of payment alters the bid price. Remember, a bid price is a price that is given or accepted on a real project that is to be completed in a specific time period and tied to a pre-determined set of terms and conditions.

Cost

It is important to understand your cost and how it can be perceived starting from the bid stage to the actual contract work. The cost is the total sum of the fixed and variable expenses to manufacture a product. Fixed costs include the expense of running the business (rent, utilities, office equipment, insurance, salaries, depreciation and property taxes). Variable costs include raw materials, hourly wages paid to laborers and contractors, warehouse and shipping costs and manufacturing efficiencies (efficiencies covering shop loading, employee labor performance and the use of new or antiquated equipment). These variable costs, especially labor performance, once evaluated, become a static value for a semi-annual or annual period of time. This may cause a current spike in costs for a project that may span years to complete. At any given time along the timeline, your costs and profits could vary depending upon how you perceive cost and profit.

Therefore, you must establish or define your cost that will include, or be based upon, your expected attainable efficiency of operation (i.e., the number of bricks laid per man, square feet per day for installing insulation or lagging, etc.) This cost should be time-related to the project timeframe.

Payment and Cash Flow Terms

Once you have established your cost and bid price, you must decide upon terms of payment and cash flow over the span of the contract. In these days of low interest rates, cash flow may not seem so great, but even a small change in the price can affect the outcome of a bid. Therefore, it will be very important to know or establish percentages of completion over time. As stated earlier, it is more desirable to use other people’s money. The best scenario would be to have the customer pay as you go. Rather than dealing in dollar amounts, it will be easier to use percentages to determine how a bid price and payments will flow. First, there is up-front engineering cost (this might be 10 percent of the total cost), followed by material purchasing at different points of the project time line (estimated at 20 percent). Then there may be shop costs (forecasted at 15 percent) and field labor costs (estimated at 25 percent) that need to be factored in. Take into consideration how the customer will perceive your bid price when establishing your terms of payment and cash flow. Ask yourself, can the bid price appear to be too low to the customer because of the up-front money involved? Does the customer evaluate terms of payment in deciding who gets the award? Does the customer recognize the differences and the affects different terms of payment have on the bid price?

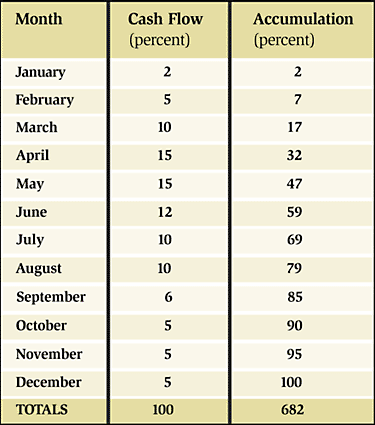
Once you have established your costs over the duration of the project, you can then establish a chart to determine the cost of money or cash flow that you would need to recover during the contract period. Consider an example of a lagging and insulation project spanning 12 months and using a flat percentage of the total cost. See Table 1.

Table 1 shows a base for cost of money or cash flow that can be compared to the cash flow as recovered based on the projects terms of payment (i.e., percentage on order, percentage on shipments, percentage on completion, guarantee retentions, all up front or all on completion).

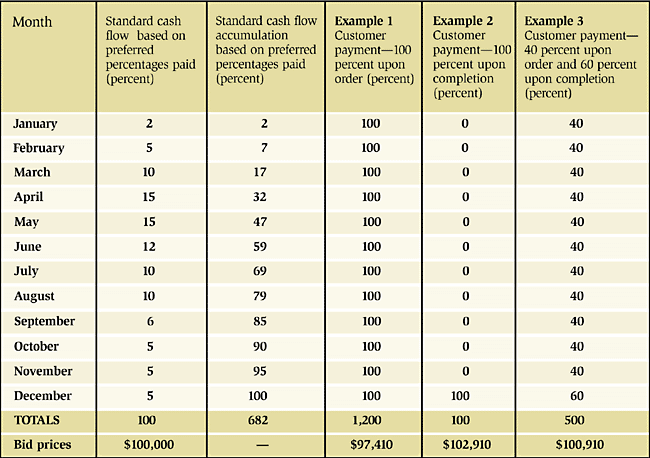
Table 2 shows some typical examples. In example 1, the customer pays 100 percent up front, assuming a 6 percent interest rate. The cost of money = 6 percent/1,200 percent x (682-1,200) = -2.59 percent reduction of bid price. Or, the customer could pay 100 percent upon completion, assuming a 6 percent interest rate. In that case, the cost of money = 6 percent/1,200 percent x (682-100) = 2.91 percent added to bid price.

Having first developed a bid price for the project ($100,000) based on your standard cash flow, this bid price can then be modified to reflect the terms of payment as they are negotiated. This is why experts advise that you take into account the cost of money (cash flow) when determining your base bid price.

Once your base bid price has been established, it can then be altered to appear more attractive. It can be lowered to reflect a positive cash flow (i.e., 100 percent upon order) or adjusted to reflect terms of payment requested by the customer (i.e., 100 percent upon completion). There are many reasons for terms of payment, and they all affect the bid price. For example, the customer may desire to pay a percentage up front, because of a tax issue, and then pay a percentage on completion, due to his own internal cash flow considerations (see example 3 in Table 2).

Conclusion

In the coming years, the power-generating industry will need to invest billions of dollars in costly pollution-prevention equipment. Whether you are a bidder or a customer awarding a large air pollution or new boiler project, understanding the bid price is crucial to staying in business. The recognition of cash flow and attention to the terms of payment are equally important when understanding the four rules of bidding. Cash flow and profitability are all about money management, cost control and the ability to recognize profits. When the power-generating industry begins to recognize and understand what a low bid price is, then everyone wins and stays profitable.

Figure 1

Base for cash flow.

Figure 2

Typical examples of cash flow and payment schedule.

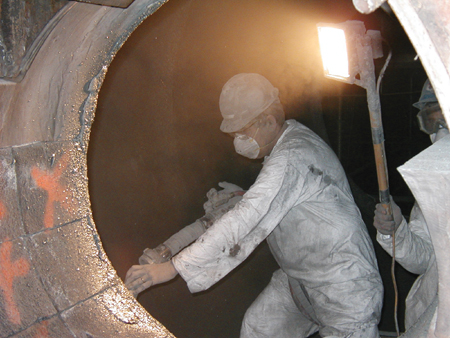
Many power-generating boilers–cyclone fired, refuse, fluidized bed–use refractory inside the furnace and burner area to protect the boiler tubes from the severe environment created by the burning fuel (coal, refuse, wood). The boiler water wall tubes are pin-studded tubes. The pin studs help retain the refractory at the tube wall surface and cool the refractory surface. The refractory material, in turn, protects the water wall tubes and pin studs from the combustion and environment created by the fuel being burned, and it keeps the boiler operating efficiently by its resistance to slag and ash.

When refractory failure occurs, it becomes a complex problem to solve. Refractory linings usually fail due to any number or combination of the following factors:

  • The material selected does not match the boiler environment that exists (i.e., reducing atmosphere);

  • The material selected does not match the fuel being burned (i.e., the alkali, sulfur, hydrocarbons, vanadium and moisture that is present in the fuel);

  • The refractory was improperly stored, applied, cured or dried, which affects the strength of a refractory;

  • When the material was selected, no one took into account the chemistry and corrosive nature of the ash and slag.

Diagnosing Refractory Failure

Finding the root cause of a refractory failure requires several pieces of information. You need to have a refractory material sample for testing and know how and where the material was stored, and for how long. You also need to know when the refractory was manufactured, exactly when the refractory material was installed (in order to compare ambient air conditions), how much refractory material there was, and how it was installed. Finally, you need information on the curing and dry-out procedures that were followed (or not followed), and the chemical analysis on the fuel (coal, startup oil, refuse, wood), ash clinkers and slag.

Slag is the formation of molten, partially fused or resolidified deposits (ash) on the boiler or furnace wall. Slag is a function of deposit temperature and deposit composition. Boilers, for example, are designed to maintain ash in a fluid state. The temperature of the ash leaving a boiler can reach up to 2400 F. Deposit composition is a function of the local atmosphere, particularly for ash with significant iron content. Slag deposits on boiler walls reduce furnace heat absorption, raise gas temperature at the boiler gas exit, cause fouling in the convection or heat recover area of a boiler, cause an increase in the attemperator spray flow, and interfere with ash removal. Air and fuel imbalance (stoichiometry) can also cause slagging, especially when the coal has high iron content.

In order for slag to adhere to a clean surface and form deposits, the particles must have a viscosity low enough to wet the surface. Iron raises all four values of ash fusion temperatures (initial deformation, softening, hemispherical and fluid). Therefore, the greater the iron content in the ash, the greater the difference in ash fusibility between the oxidizing and the reducing condition.

The amount of slagging will also depend on what type of coal is being used. For example, a bituminous coal causes low to medium slagging and has more iron oxides (FeO3) than the sum of the calcium oxides (CaO) and magnesium oxides (MgO). A sub-bituminous coal (powder river basin or PRB) causes high slagging and has higher moisture content than a bituminous coal. A lignite coal causes severe slagging and has more calcium oxides and magnesium oxides (CaO + MgO) than FeO3.

Due to the surface porosity of the refractory, slag can penetrate and cause the deterioration of the refractory surface. To prevent this corrosive attack and give longer life to the refractory surface, you can form a "frozen" layer of slag between the refractory surface and the molten slag. This thin slag layer can be formed only by the combination of the cooling action of studded tube walls, the thickness of the refractory material and the thermal conductivity of the refractory material. Higher hot-face temperatures are less likely to form a frozen slag layer.

Other Factors Affecting Refractory Materials

Alkalis are found in the combustion of the coal, oil or wood. The most prevalent and harmful alkalis are sodium (Na), also known as soda, and potassium (K) or potash. These alkalis could chemically react with silica found in some refractory materials.

Sulfur is also found in the combustion of gas or coal. Sulfur will combine with lime and iron oxides to reduce the strength of a refractory material. In the presence of moisture, the sulfur compounds and salts can form sulfurous and sulfuric acids. These acids could react with the basic components of some refractory materials.

Hydrocarbons are found in the incomplete combustion of fuel (ash). Hydrocarbons normally do not present a problem for refractory materials except when there is a reducing atmosphere. When a reducing atmosphere is present, hydrocarbons can react with the iron oxides in the refractory material and form large carbon deposits. These large carbon deposits could eventually cause a chemical spall on the surface of the refractory.

Vanadium found in low-grade fuel oil can act as a catalyst forming a low-melting alkali-silica compound that could react and break down the basic components of the refractory material.

The temperature to which the refractory material is exposed is also very important. When the operating temperatures are higher than the recommended use-limits of a refractory material, the refractory could melt. The first signs of excessive temperatures are excessive cracking and glazing on the refractory surface.

Selecting a Refractory Material

As stated earlier, when choosing a refractory material, you must take into account the area of usage (such as furnace lining and burner area), application method (gunning, ramming, trowel, pouring or shotcreting), and the boiler environment created by the burning fuel (vanadium, sulfur, potassium, moisture content in the coal, stoichiometry, ash, slag and reducing atmosphere) to which the refractory will be exposed.

There are three basic steps to follow for selecting a refractory material: Examine the existing refractory (or the lack thereof), calculate the base-to-acid ratio of the slag and ash, and select the right materials based on the application, usage and boiler environment.

Step 1: Examine the existing refractory. When replacing old refractory material, don’t automatically use the same material as the original design called for, or what "you always use." It is better to examine the reasons for failure and adjust the selection accordingly. Ask yourself: Did the material spall due to thermal shock? Has it shrunk due to temperatures above its use limit? Does that gouge in the refractory lining indicate mechanical abuse? If the surface appears "glassy," is it due to operating at temperatures above the use limit? Does the lack of material indicate improper installation? The old refractory lining–whether it exists or not–will offer several good clues.

Step 2: Calculate the base-to-acid ratio when ash and slag are present. This will give you a starting point on what type of material to choose.

Here is one way to calculate the base-to-acid ratio. The values are taken from the chemical analysis of the ash and slag samples.

B = Fe2O2 + CaO +Na2O + P2O5 +MgO + ZnO + MnO
A SiO2 + Al2O3 + TiO2

A base-to-acid ratio less than or equal to 0.25 indicates an acid condition. An acid condition indicates that a SiO2-type refractory should be considered.

A base-to-acid ratio greater than 0.25 but less than 0.75 indicates a neutral condition. A neutral condition indicates that an Al2O3, SiC or chrome-type refractory material should be considered.

A base-to-acid ratio greater than or equal to 0.75 indicates a basic condition. A basic condition indicates that an MgO or dolomite-type refractory material would be considered.

Step 3: Select the right materials. Look at all service conditions-including fuel or raw materials being used-including start-up fuel, ash and slag content, gas temperature and stoichiometry-before choosing a refractory material.

Refractory materials vary widely in temperature use-limits, thermal shock-resistance and abrasion resistance. Pick a refractory material with the best combination of properties for your application.

Example 1: The moisture content in the fuel can affect refractory materials. High moisture content, or the moisture content in the fuel combined with a reducing atmosphere, can cause a separation of the silicon carbide base material (grain). This separation occurs when the total percentage of the moisture content found in the fuel is greater than 15 percent, or when the combined total percentage of the moisture content in the coal and the reducing atmosphere percentage is greater than 15 percent. Therefore, if the boiler environment were similar to this example, then a high-alumina product would be preferred to a silicon carbide material.

Example 2: Certain amounts of iron oxide, potassium, sulfur or vanadium found in the fuel, slag or ash, react with cements (calcium-aluminate). This is especially true when a reducing atmosphere exists inside the furnace. Therefore, if the boiler environment were similar to this example, then a phosphate-bonded refractory material would be preferred to a cement-bonded material.

Example 3: Certain startup fuel oils may contain vanadium. Vanadium reacts with the cements (silica and lime) of a conventional refractory. A chemical spall will occur at the surface of the refractory and will reduce the longevity of the lining significantly. Therefore, if the startup fuel oil were similar to this example, then a low-cement or non-cement refractory material would be preferred.

Conclusion

Refractory failure is a major contributor to boiler and furnace shutdowns. Refractory that is properly selected and installed will last longer and help minimize the amount of shutdowns required, leading to savings in annual fuel cost. Eliminating refractory failures begins with understanding ash and slag. That is why experts say, "Refractory designed and installed to save energy also saves money at a rate that is essential for efficient power plant operation."

Figure 1

Gun application of refractory in a cyclone burner.

Figure 2

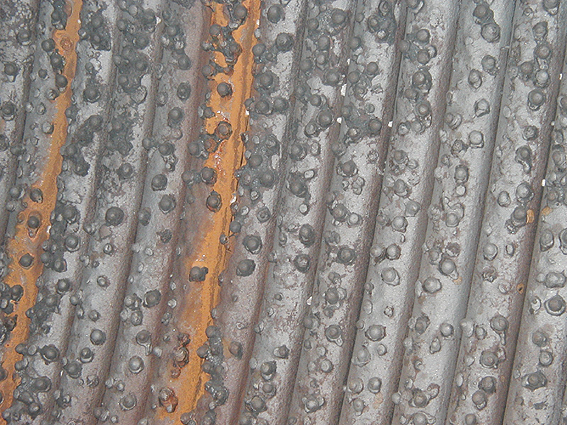
Boiler tubes with unremoved refractory.

Figure 3

Close-up of cyclone burner tubes with unremoved refractory.

Figure 4

Bottom ash samples.

Figure 5

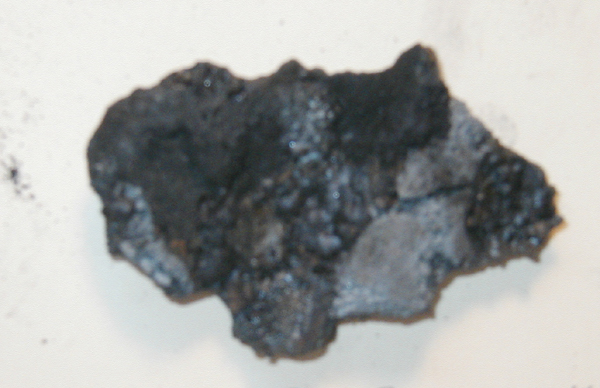
Slag and refractory sample taken from failed furnace lining.

Figure 6

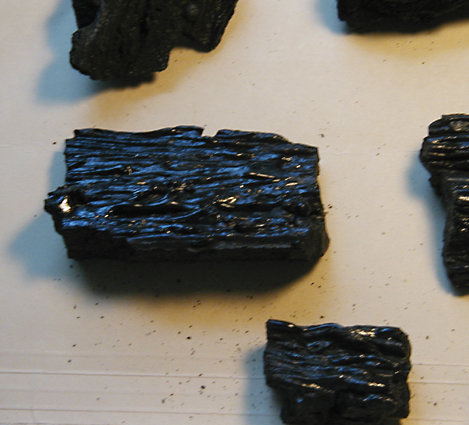
Slag samples.

Figure 7

Close-up of slag sample with pin studs, with no refractory material present.

Operating a business naturally requires finding ways to cut costs and save money. Industries are certainly no different, and case studies and assessments have demonstrated repeatedly that one of the best ways to save money is to save energy, not to mention the benefit it has on the environment.

For many industries, identifying energy-saving methods may seem a daunting, expensive and lengthy process. The good news is that the Department of Energy (DOE) has a long-standing, proven and quick method for helping such industries assess where energy, and therefore money, can be saved. They are called Industrial Assessment Centers (IACs). Within just 60 days, eligible small- to medium-sized manufacturers can be handed a free-of-cost, confidential, no-obligation report of how they can be saving tens of thousands of dollars a year on their bottom-line expenses.

Since starting the IAC program in 1976, the DOE has saved American companies more than $700 million through such energy improvements. And because saving money means saving jobs, the DOE program has also helped to create and maintain more than 1.5 million U.S. industry jobs.

How an IAC Works

An IAC is a DOE-funded program run by a host university where teams of engineering faculty and senior undergraduate and graduate-level students are available to provide detailed energy audits of industrial plants. The purpose of the IACs is twofold: to train engineering students, and to improve energy security and decrease energy and resource consumption in the United States. There are currently 26 such universities around the country involved in the program. See the sidebar on page 20 for a complete list and more details about how they are chosen.

An energy assessment is simply a quick, in-depth evaluation of an industrial plant site, including its facilities, services and manufacturing operations. It must be clarified, however, that the energy assessments provided by the IACs are not as in-depth as plant-wide assessments, also provided by the DOE.

University faculty and students begin their energy audit with a short meeting and interview of eligible plant personnel. The meeting is followed by a one- or two-day visit of the plant site, where university students take engineering measurements as a basis for assessment recommendations. With the help of engineering faculty, the students can then spend time analyzing the measurements to produce specific recommendations with related estimates of costs, performance and payback times. Then, they make cost-saving recommendations for energy efficiency, waste minimization and pollution prevention, and productivity improvement.

Within 60 days following the audit, the university team creates a confidential report with details about their analysis, findings and recommendations. Anywhere from two and six months later, the team will follow up with a phone call to the plant manager to verify any recommendations that will be implemented.

Overall recommendations from IACs average about $55,000 in potential annual savings for each manufacturer, but well exceed that average regularly above $100,000. And changes implemented by a plant as a result of an assessment generally improve energy costs at the plant for as long as seven years. It should not be surprising to Insulation Outlook readers that one of the top recommended changes for energy and cost savings given by IAC centers is insulating bare equipment to reduce heat loss.

The Polymetallurgical Corporation, a metals manufacturer in North Attleboro, Massachusetts, was one such plant that benefited from an IAC energy assessment. In February 2002, the IAC located at the University of Massachusetts Amherst was able to recommend eight changes to this manufacturer of wire, conductive springs, and bonded and inlayed metal products. Recommendations included changes in scheduling, compressed air systems, administrative costs and machine changes, which combined to reduce energy usage and productivity costs by a total of more than $70,000 annually. The plant was able to implement all eight of the recommendations immediately following the assessment, and has since been able to complete six.

Thomas Leverett, facility safety manager at Polymetallurgical Corporation, relays the company’s satisfaction with the IAC program, saying, "It is of great value to save energy costs in today’s market. The information helped us also in uncovering additional ways to conserve energy and minimize waste."

Leverett confirms that he would recommend an IAC assessment to other plants and that his plant has used the experience to locate further cost savings through similar types of assessments, including the proper insulation of the facility’s expanded building space.

More drastically affected by an IAC assessment, the Precision Castparts Corporation, a manufacturer of high-quality precision metal castings in Portland, Oregon, was able to exceed IAC recommendations for total implemented energy, waste and productivity-related savings of more than $240,000 per year. Simply implementing the IAC recommendation of disposing of wax and ceramic waste helped the company realize actual annual savings of more than $116,000.

Who is Eligible for an IAC Assessment?

To be eligible for an IAC assessment, a manufacturing plant must be within Standard Industrial Codes 20-39; generally be within 150 miles of a host campus; have gross annual sales of less than $100 million; have fewer than 500 employees at the plant site; have annual energy bills between $100,000 and $2.5 million; and have no professional staff available to perform the assessment.

Currently, the DOE provides enough funding through the IAC program to conduct approximately 625 audits per year. Plants that are interested in participating only need to contact the nearest IAC center to set up an assessment. Waiting lists are short or nonexistent.

Once an assessment is scheduled, an IAC may request some preliminary data, such as the plant’s energy costs, energy-consuming equipment already in the plant, and information about the plant’s operational procedures.

Continuing Education From NIA

Because the proper use and installation of insulation is a top energy-conservation method for industries, the National Insulation Association (NIA) saw the IAC program as a way to further educate university participants and, as a result, energy assessments beneficiaries about insulation. The NIA Foundation for Education, Training and Industry Advancement initiated a Joint Task Force Program with the North American Insulation Manufacturers Association (NAIMA) in early 2003 in order to maximize efforts and results of insulation education to end-users. With combined manpower and funds, NIA and NAIMA are offering and conducting these free, one-day Mechanical Insulation Specification, Selection and Maintenance workshops to any university program that is interested in extending its education on benefits of properly installed insulation.

The one-day workshop includes segments of NIA’s Insulation Energy Appraisal Program (IEAP) and National Insulation Training Program (NITP). The information presented includes basic insulation science, system designs and materials, a review of the NAIMA 3E Plus® insulation thickness computer program, and what to look for on insulation systems during a facility "walk-through." The course also provides students with tools and techniques on how to identify and classify insulation system damage so that ultimately the facility owner can make an informed decision on maintenance or replacement based on fuel dollars lost or saved. See the sidebar on page 21 to learn more about the IEAP and NITP programs.

The first IAC to participate in the task force education program is West Virginia University (WVU), which received its training in October 2003. The IAC assistant director at WVU, professor Bhaskaran Gopalakrishnan, Ph.D., Department of Industrial and Management Systems Engineering, comments that the training was very beneficial and met the school’s expectations.

He says, "We actually got to see some sample material and that was helpful. We find that in many cases, repairing or upgrading the insulation systems offers the quickest, most cost-effective return on a company’s investment. Our students can certainly benefit from knowledge about the components of an insulation system and what they could suggest as system repair or upgrade."

NIA and NAIMA plan to provide the task force training at as many as 10 additional IACs during 2005. For more information, please visit NIA’s website at www.insulation.org.

Other Free Energy-Saving Resources

If your manufacturing plant does not meet the requirements for participating in a DOE IAC assessment or simply wishes to conduct its own assessment, you can take advantage of several free tools provided by the DOE for identifying energy savings. Through the DOE’s Industrial Technologies Program BestPractices activity, plants can become familiar with system level energy-saving tools and software for steam, pumps, motors, process heating and compressed air, to name a few. Additionally, the IAC program has developed resources that allow manufacturers to do their own assessments through the following methods:

  • The Self-Assessment Workbook for Small Manufacturers-a guide for identifying energy-savings, waste-reducing and productivity improvement opportunities, and on implementing selected projects. The workbook was developed by Rutgers, the State University of New Jersey, to provide plant managers with the resources they need to perform an assessment on their own.

  • The IAC database includes the results of more than 11,000 assessments and allows users to search for the most frequent recommendations based upon plant type and size. It also provides actual implementation costs and payback periods for selected measures. The database is maintained for the DOE by the Center for Advanced Energy Systems at Rutgers and currently contains detailed data, available by Standard Industrial Classification, fuel type, base plant energy consumption and recommended energy efficiency improvements. The data allows an interested plant to identify a similar type of plant and know what types of improvements were most frequently recommended.

For more information on any of these resources, visit www.eere.energy.gov/industry, www.oit.doe.gov/iac or www.oit.doe.gov/bestpractices.

Manufacturers are scrambling for relief from today’s energy expenses and price volatility. Most industry decision-makers seek solutions in the form of the lowest available energy prices. Too often, managers fail to grasp the opportunities offered by energy management, which focuses on both consumption and prices. Industry is often resistant to energy management for a variety of reasons. Simply put, energy management has no traditional place in the typical manufacturer’s chart of organization, job descriptions and performance accountabilities.

While technology is fundamental to energy efficiency, it is people who make it work in an organizational context. DuPont, Frito-Lay, Unilever and Kimberly Clark are a few of the forward-thinking companies that have found ways to build energy management into their daily operations to positive effect. The Alliance to Save Energy is documenting these companies’ experiences in a series of case studies that reflect the organizational and behavioral aspects of corporate-wide energy management. Case studies show that energy management motives and approaches are somewhat varied. The Alliance offers a typology of industrial energy management strategies to illustrate the range of opportunities available to industry. Ultimately, it is a manufacturer’s organizational character that determines its ability to manage energy consumption.

Energy Efficiency, Energy Management and Business Impacts

From the manufacturer’s perspective, fuel and power are merely packages that provide heat. Heat is a catalyst that refines raw materials into finished products. Heat optimization is the real value proposition behind energy efficiency. For manufacturers, energy efficiency is achieved simultaneously with control over thermal resources. With control comes reliability of operations. With reliability comes the ability to fill orders faster, at less expense, and with reduced risk of interruption. Faster order turn-around means more orders can be filled, bringing in more revenue. This is energy efficiency’s contribution to productivity.

As an organizational process, "energy management" contributes to the outcome of improved business performance. "Energy efficiency" refers to practices and standards, orchestrated by an energy management plan, that use energy resources in ways that maximize business value. Energy efficiency contributes to expense reduction, revenue creation and operating risk containment.

Unchecked energy expenditures are like a tax burden imposed cumulatively with each stage of production. Energy management is an ideal opportunity to improve competitiveness through productivity improvement. Plants of all types, sizes and locations use energy; so the potential for energy-driven productivity gains is everywhere. The benefits only begin with reduced energy bills. Other impacts include greater capacity utilization, reduced scrap rates, more effective emissions and safety compliance, and enhanced risk management.

Efficiency should not be confused with conservation. As opposed to conservation (sacrifice), energy efficiency is an indispensable component of any effort to improve productivity. Ultimately, energy efficiency contributes to wealth.

American industry continues to waste energy. No one knows that better than Frito-Lay, Unilever, DuPont, 3M, Kimberly Clark and other manufacturers that have implemented the most aggressive energy management programs. This is more than a "hippies, beads and flowers" issue. At stake is the viability of manufacturing facilities that employ people and sustain local communities. For this reason, the U.S. Department of Energy sponsors the development of the Alliance to Save Energy’s Corporate Energy Management case study series. The intent of this series is to encourage industry observers to learn from their peers.

Many efficiency proponents believe that if you show the projected dollar savings or payback for energy improvements, top managers will accept these proposals. That’s not always true. The Alliance’s case study research reveals the role of organizational size and complexity in defeating efficiency opportunities. Manufacturing enterprises have organizational structures, accountabilities and incentives that are designed to make products and get them out the door. Waste persists because staff bears little or no accountability for waste minimization. Energy management requires cross-functional authority and communications that don’t exist in most facilities. Given this reality, energy waste will continue no matter how attractive a project’s return on investment looks on paper.

A fully developed industrial energy management program is a work plan for continuous improvement. This plan will engage human, technical and financial resources, and its progress will be monitored to meet certain goals. Criteria for action will reflect input from engineering, maintenance, financial and utility staff. Staff will be held accountable for outcomes. The only energy improvements undertaken are those that provide business value to the organization.

A Sample of Energy Management Leaders

Manufacturers throughout industry practice energy management to varying degrees. No one industry dominates the practice. While it is easier to identify energy management leaders among Fortune 500 companies, there are also small, privately held companies that excel at stewardship of energy and other resources.

The Alliance to Save Energy has compiled seven corporate energy management case studies to date. An overview of these companies’ accomplishments is as follows (for full text on these case studies, go to: www.ase.org/section/topic/industry/corporate/cemcases).

C&A Floorcoverings. Based in Georgia, this privately held, five-plant company demonstrates successful energy management by a mid-sized manufacturer. MSE 2000, a certified national management standard for energy developed by Georgia Tech, became a template for an in-house energy management program. In 2004, C&A is close to becoming the first organization to be fully certified per the MSE 2000 standard. As such, C&A has implemented a management system for matching energy efficiency initiatives with business goals. After two years, C&A achieved 10 percent savings on an annual natural gas expenditure of $824,500.

DuPont. With more than 100 plants in 70 countries, energy management practices at DuPont are supported by two, top-level strategies. The first is designating energy conservation as a high- priority corporate issue. The other is applying "Six Sigma" methodology to the energy management process. Through 2002, DuPont merged these strategies to identify and implement more than 75 energy improvement projects across its global operations. The average DuPont Six Sigma energy project nets in excess of $250,000 in annual savings.

Frito-Lay. This leading snack food manufacturer’s energy management features aggressive energy reduction goals with a focus on results. This demands a high degree of monitoring, measurement and communications. Frito-Lay organized the needed engineering talent as its Resource Conservation Group. While surpassing intermediate targets on the way to even larger savings, Frito-Lay’s efficiency initiatives have returned higher than 30 percent on investment.

Kimberly Clark Corporation (KCC). This personal care products manufacturer has a broad mandate for environmental stewardship. KCC’s global portfolio of 165-plus plants practices energy conservation, air emissions abatement, wastewater treatment upgrades, process water use reduction, packaging reduction, landfill elimination, toxic chemical elimination and environmental management system implementation. Five-year plans help coordinate benchmarking efforts across a global facility network. KCC’s energy conservation efforts are currently in the middle of a second, five-year plan, which seeks to expand on the success of the first plan (1995-2000). The first plan led to a corporate-wide, 11.7 percent reduction in energy use per ton of product.

Merck & Co. Inc. This pharmaceutical products and services corporation seeks to build productivity of existing assets while reducing energy expenses. A corporate energy program is mobilized by goals that hold site managers accountable for annual performance targets. Energy costs at manufacturing sites are on a growth-adjusted pace to be cut 22 percent between 2001 and 2005. This equates to at least 250,000 tons of avoided carbon emissions and 11.5 percent energy expenditure savings.

3M. This diversified manufacturer seeks to reduce energy consumed (Btus) per pound of product by 20 percent during the 2000-2005 time frame. This goal will require 3M’s tier 1 plants (52 facilities worldwide) to achieve 3M’s own "world class" energy management label. 3M has already surpassed that target and uses its energy performance in its product marketing. Superior energy cost control reduces the embedded energy cost that customers would normally absorb. Support for energy management at 3M begins at the corporate level. 3M’s executive management believes that resource stewardship makes good business sense. As a result, the principles of energy management are an integral part of corporate culture.

Unilever HPC. Unilever’s health and person care division’s energy management program coordinates 12 facilities by combining energy-use targets with an energy service outsourcing strategy. A simple budget-to-actual spreadsheet compares energy performance at 14 facilities. Because its use resulted in a saving of $4 million on energy and another $4 million in avoided costs, the spreadsheet has captured the attention of individual facility managers and Unilever’s board of directors as well.

As Table 1 indicates, these seven corporations approach energy management as a "process," as opposed to a "project." Accordingly, corporate energy management efforts almost universally feature goals, performance metrics and accountabilities embodied in a lead energy manager or management team.

Motivations for pursuing energy management are surprisingly varied. Perhaps the most obvious reason is to "control energy expenditures," although this is far from being the only reason. Some companies put a premium on resource stewardship, for both public relations and risk management purposes. Other companies wish to sustain and replicate operational improvements that would be otherwise lost in the complexity of multi-facility environments. Table 2 summarizes the motivations for undertaking energy management, as expressed by the seven companies in the case study series.

The summary of motivations in Table 2 clearly reflect the multi-purpose nature of energy management:

  • Energy expense control and management of energy price volatility;

  • Non-energy expense control, such as avoided capital expenditure;

  • Increased revenue potential through replication of capacity improvements;

  • Improved product marketing through visible resource stewardship;

  • Risk mitigation related to environmental liabilities and perational reliability.

Many companies are frankly intimidated by the prospect of implementing process-oriented energy management schemes. After all, competitive pressures have stripped manufacturers to the point where surviving staff are overtasked to simply "keep the car on the road" as opposed to finding time to monitor and adjust performance.

Theory: Corporate Receptiveness to Energy Management

The purpose of this section is to propose a typology of corporate "aptitudes" for energy management. This discussion is based on Alliance observation and research. Until these theories can be properly tested, readers are asked merely to consider this persuasive argument.

Human, technical and financial criteria all contribute to a robust energy management program. Collectively, these attributes constitute a "culture" and receptiveness, not only to energy management, but also to operational efficiency in general. The following is a listing of organizational attributes that enable energy management. Manufacturers will enjoy a wider range of energy management options (moving up on a continuum from "do nothing" to sustained, daily energy management) by adopting as many of these attributes as possible.

How can the presence of these organizational attributes be determined? The appendix at the end of this article offers a checklist of considerations for this purpose.

Fundamental business viability. Companies that are subject to merger or acquisition, labor disputes, bankruptcy or severe retrenchment may have fundamental distractions that will interfere with the attention that energy management deserves. A preponderance of such conditions indicates management turmoil that makes energy management impractical.

Replication capacity. Logical attributes for replication include: 1. a multi-plant organization; and 2. general consistency in process activities and products across plants. Staff’s ability to cooperate across sites and functional boundaries is crucial. Organizations must simultaneously engage many different professional disciplines and accountabilities to maximize their energy management potential.

Energy leadership (or "champion"). Successful energy improvements are usually led by an "energy champion," a manager that: 1. understands both engineering and financial principles; 2. communicates effectively both on the plant floor and in the boardroom; and 3. is empowered to give direction and monitor results.

Energy market capability. This dimension is straightforward: Does the corporation wish to purchase energy through ongoing market activity? If so, the corporation should be prepared to maintain sophisticated search and verification procedures to support its contracting activities. Purchasing decisions should reflect the collaboration of procurement, production and plant utilities personnel.

Leadership intensity. Quality of operations should be demanded, facilitated and recognized by top officers of the corporation. Adoption of professional and industry standards are crucial to attaining this attribute. Energy-smart operations will hold employees accountable for adherence to energy management goals and other quality standards.

Pride intensity. Energy efficiency is as much dependent on behavior as it is on technology. A positive, can-do attitude on the part of staff is helpful in attaining potential energy savings. A spirit of competition within and between facilities can be harnessed to good effect.

Fiscal protocol. The finance question is not always how much. Are purchase decisions made on first cost or life-cycle costs? Who in the organization pays, and who claims the savings? Do savings count for only fuel bill impacts, or include the value of waste minimization and greater capacity utilization? What criteria determine adequate payback?

Engineering protocol. Successful energy management depends on an ability to understand energy consumption. This requires benchmarking, documenting, comparing, remediating and duplicating success stories. Internal skills, procedures and information services are engaged. The likelihood of building value through energy efficiency varies directly with the depth of these technical capabilities.

In the absence of an energy management process, energy expense control is reduced to one-dimensional efforts. Many manufacturers (either wittingly or not) settle for something less than process-oriented energy management improvements due to a lack of time, interest or understanding. The approach taken by individual manufacturers is very much a function of their organizational attributes and business culture.

Energy Management Strategies

The aim of this section is to present the range of energy management options available to industry. Every manufacturer employs some energy management strategy, even if the choice is to do nothing about energy consumption. Accordingly, every manufacturing organization adopts one or more of these strategies:

1. Do Nothing. Ignore energy improvement. Just pay the bill on time. Operations are business-as-usual or "that’s the way we’ve always done it." There will be limited ability to deal with fuel market turmoil, changing emissions criteria, or spotting the opportunities provided by new technology.

Who Does This? Companies that do not understand that energy management is a strategy for boosting productivity and creating value. Or, companies that are subject to merger, buy-out, bankruptcy, union disputes, relocation or potential closure. Or, companies that are extremely profitable and don’t consider energy costs to be a problem.

Pros: No behavior change is required, nor is the investment of time or money into energy management.

Cons: There is no saving. Income is increasingly lost to uncontrolled waste.

2. Price Shopping. Switch fuels, shop for lowest fuel prices. No effort to upgrade or improve equipment. No effort to add energy-smart behavior to daily operation and management (O&M) procedures.

Who Does This? Companies that "don’t have time" or "don’t have the money" to pursue improvement projects. Or, companies that truly believe fuel price is the only variable in controlling energy expense.

Pros: No need to bother plant staff with behavioral changes, or create any more work in the form of data collection and analysis.

Cons: Lack of energy consumption knowledge exposes a company to a variety of energy market risks. There is no knowledge of where waste occurs, nor can opportunities be identified to boost savings and productivity. The company is also exposed to energy market volatility and emissions and safety compliance risks.

3. Occasional O&M Projects. Make a one-time effort to tune-up current equipment, fix leaks, clean heat exchangers, etc. Unable/unwilling to make capital investments. Revert to business-as-usual O&M behavior after one-time projects are completed.

Who Does This? Companies that are insufficiently organized to initiate procedural changes or make non-process asset investments. They cannot assign roles and accountabilities for pursuing strategic opportunities.

Pros: Very little money is spent when just pursuing quick, easy projects.

Cons: Savings are modest and temporary because procedures are not developed for sustaining and replicating improvements. Familiar energy problems begin to reappear. Energy bills begin to creep back up.

4. Capital Projects. Acquire big-ticket assets that bring strategic cost savings. But beyond that, day-to-day O&M procedures and behavior are business-as-usual.

Who Does This? Companies that lack the ability to perform energy monitoring, benchmarking, remediation and replication as a part of day-to-day work. However, they have the fiscal flexibility to acquire strategic assets that boost productivity and energy savings.

Pros: Obtain fair to good savings without having to change behavior or organize a lot of people.

Cons: Forfeit savings attributable to sustained procedural and behavioral efforts. Also, savings from the new assets may be at risk if adequate maintenance is not applied.

5. Sustained Energy Management. Merge energy management with day-to-day O&M discipline. Diagnose improvement opportunities, and pursue these in stages. Procedures and performance metrics drive improvement cycles over time.

Who Does This? Companies with corporate commitment to: 1. quality control and continual improvement; 2. well-established engineering and internal communications protocol; and 3. staff engagement through roles and accountabilities.

Pros: Maximize savings and capacity utilization. Increased knowledge of in-plant energy use is a hedge against operating risks. Greater use of operating metrics will also improve productivity and scrap rates while reducing idle resource costs.

Cons: A lot of in-house talent, cooperation and a capable energy "champion" are needed in order to do this.

It is beyond the scope of this article to comment on which strategies are predominantly encountered in industry. Anecdotal evidence suggests that all industrial energy management strategies can be categorized per one of these five selections. It is also possible for firms to practice multiple strategies simultaneously, for example price shopping for low-priced fuel commodities in concert with a capital projects focus.

It should be noted that all seven of the experiences documented in the Alliance’s case study series can be categorized as sustained energy management. As such, these companies integrate energy management with day-to-day procedures and accountabilities.

Matching Strategies With Corporate Attributes

I want to build on the theory of corporate receptiveness to energy management, as presented above. The energy management strategies available to a manufacturer are a function of its organizational attributes, as summarized in Table 3 (see page 20). Note that this is currently presented as theory.

This typology presumes that energy management for multi-site organizations is more demanding than for single-site companies. Accordingly, adoption of a certain strategy by a multi-site organization requires all the organizational attributes that a single-site organization would be expected to muster, plus the capacity to replicate.

Managers that are contemplating improved energy management are encouraged to consider the case study results and theory presented in this article. To act on this information, the steps are:

1. Refer to the appendix on page 24, "Determination of Organizational Attributes." Note which organizational attributes have been substantially attained by the subject company.

2. Compare the attained attributes to the information in Table 3. The presence (or absence) of certain attributes determines which energy management strategies are available to the subject company.

3. Use these findings to understand what the subject organization can or cannot achieve in terms of energy management.

Keep in mind that this exercise indicates what a manufacturer, given its current organizational attributes and "culture," can expect from energy management. There may be a desire to evolve to a higher level of energy management than what the current organization allows. What if a manager wants to advance energy management in his or her organization? There are windows of opportunity. An obvious example is when energy market turmoil brings top management’s attention to fuel costs. Also, take advantage of annual planning sessions or strategic reorganizations to propose the kind of organizational processes needed to practice sustained energy management. Remember that energy cost control is as much dependent on people as it is on technology. Learn from the case studies shared here.

Conclusion

Volatile energy markets are here to stay. So are competitive and regulatory pressures. Energy price movements will put some manufacturers out of business, while others will decide to move offshore. Surviving manufacturers will not only provide superior products and service, they will maximize value through operating efficiencies. Energy efficiency is an indispensable component of wealth creation.

Energy procurement strategies such as shopping for low energy prices and supply contracts are only partial solutions to soaring energy expenses. Management of consumption is an underappreciated opportunity. While technology is the foundation for managing consumption, it is the human dimension that makes technology work. Organizational procedures, priorities and accountabilities are crucial to energy management.

A few forward-thinking companies have allowed their energy management experience to be documented for industry’s wider benefit. Frito-Lay, DuPont and Kimberly Clark are among these companies. The "best of the best" companies approach energy management as a "process," as opposed to occasional "projects." The most effective corporate energy management programs feature performance goals and metrics, staff accountabilities and procedures that are integrated into daily operations.

A manufacturer’s ability to manage energy consumption is ultimately a function of organizational attributes and corporate culture. This article advances "energy management pathfinding" concepts. The appendix at the end of this article presents the criteria that define seven distinct organizational attributes needed for energy management. While sustained, day-to-day energy management is recommended for providing the greatest and most durable value, it is also the most demanding in terms of operational character. Many companies will find that they are suited for strategies that are less challenging, but also provide less value. The same management diagnostic presented in this article serves as a pathfinder for matching organizational characteristics with appropriate energy management strategies.

ASTM Committee C16 on thermal insulation met in Washington, D.C., October 3-6, 2004. The following is a C16 overview, scope, individual subcommittee scopes, and a summary of some of the activities by task groups reviewing and/or writing standards related to mechanical insulation. You can learn more about ASTM C16 by going to www.astm.org, clicking on "Technical Committees," then "Search for ASTM Committee by Designation," and finally select "C16" from the hundred or so ASTM committees.

Note on the 2004 Book of Standards: Every November, ASTM publishes and releases a new Book of Standards, Volume 04.06, "Thermal Insulation; Environmental Acoustics." This includes all existing standards as well as any new or revised standards that were approved between July of the previous year and July of the current year. The 2004 Book of Standards is now available.

By policy, each ASTM standard must either be reapproved as is, or revised and approved, in either case within eight years. If not, the standard is automatically dropped from the Book of Standards. Therefore, some standards that may have previously been referenced by specifications are no longer published. In all specifications, the number of the ASTM standard should be followed by the year of most recent approval or reapproved. For example, "ASTM C612" is insufficient. A specification should read, "ASTM C612-04."

C16 Committee Overview

ASTM Committee C16 on Thermal Insulation was formed in 1938. C16 meets twice a year, usually in April and October, with approximately 120 members attending more than three days of technical meetings capped by a discussion on relevant topics in the thermal insulation industry. The committee, with current membership of approximately 350, currently has jurisdiction of about 134 standards, published in the Annual Book of ASTM Standards, Volume 04.06. These standards continue to play a preeminent role in all aspects important to the industry of thermal insulation, including products, systems and associated coatings and coverings, excluding refractories.

C16 Committee Scope

The scope of the Committee C16 shall be the development of standards, promotion of knowledge and stimulation of research pertaining to thermal insulation materials, products, systems, and associated coatings and coverings, but not including insulating refractories. These activities shall be coordinated with those of other ASTM committees and national and international organizations having similar interest.

C16 Subcommittee Scopes

C16.16 U.S. Delegation to ISO/TC 163: Standardization in the field of thermal insulation including terminology, test methods, calculation methods and specifications for thermal insulation materials, components, constructions and systems, including a general review and coordination of work on thermal insulation within ISO. Excluded are test and calculation methods that are treated by other ISO technical committees after agreement with these technical committees.

C16.20 Homogeneous Inorganic Thermal Insulation Materials: Develop and maintain standard test methods, definitions and nomenclature, recommended practices, classifications and specifications for all homogeneous inorganic thermal insulation materials under C16.00 jurisdiction, except those assigned to subcommittee C16.21 and C16.23.

C16.21 Reflective Insulation: Develop and maintain product specifications and test methods applicable to thermal insulations that depend essentially on the reflectance of heat for their effectiveness. Test methods are those not generally applicable to other forms of thermal insulation or associated materials. Jurisdiction of this subcommittee on building type constructions include only materials or assemblies consisting of one or more heat reflective (low emissivity) surface(s), such as metallic foil, unmounted or mounted on thin membrane(s), such as paper or fibrous or foam sheets, all less than 1/8-inch in thickness.

C16.22 Organic and Nonhomogeneous Inorganic Thermal Insulations: Develop and maintain standard test methods, definitions and nomenclature, recommended practices, classifications and specifications for all organic and non-homogeneous inorganic thermal insulation materials under C16.00 jurisdiction except those assigned to subcommittees C16.21 and C16.23.

C16.23 Blanket and Loose Fill Insulation: Develop and maintain product specifications; recommended practices and test methods (when not under the jurisdiction of a methods subcommittee) for all thermal insulation materials under C16.00 jurisdiction, except those assigned to subcommittees C16.20, C16.21 and C16.22.

C16.24 Health and Safety Hazard Potentials: To develop and review standards related to potential health and safety aspects associated with the installation and use of thermal insulation materials, accessories and systems.

C16.30 Thermal Measurements (including calculation methods): Develop and maintain test methods and recommended practices relating to the transfer of energy within and through thermal insulating materials and systems.

C16.31 Chemical and Physical Properties: Develop and maintain test methods and practices related to chemical and selected physical properties of thermal insulating materials.

C16.32 Mechanical Properties: Develop and maintain test methods and practices related to selected mechanical and physical properties of thermal insulation and associated materials.

C16.33 Insulation Finishes and Moisture: Develop and maintain material specifications, test methods, recommended practices and classification systems: 1. applicable to coatings, coverings, adhesives and sealants used in association with thermal insulations; and 2. involving the transfer of vapor through thermal insulation and associated materials, involving the accumulation of moisture in thermal insulating materials and systems.

C16.40 Insulation Systems: The development and maintenance of performance specifications and standard practices for thermal insulation systems. The systems include all of the individual components combined in a manner to provide an effective control of heat transfer and moisture transmission within the insulation systems under the operational and environmental conditions of its intended use. Such components, if part of the system, will include the thermal insulation, supports, securements and protective coverings.

Summaries From Washington Meeting

The following are the summaries of recent activities in Washington on individual standards relating to mechanical insulation materials and systems. These are organized by the subcommittee associated with each standard.

Subcommittee C16.20–Homogeneous and Inorganic Insulation Materials

C610

Standard on Mineral Fiber Pipe Insulation: An annex will be added to the standard to accommodate a request from the Navy to add alkalinity and pH. A compression resiliency test will also be added to the annex. These items will be balloted separately by the subcommittee.

C585

Practice for Inner and Outer Diameters of Rigid Thermal Insulation for Nominal Sizes of Pipe and Tubing (NPS System): The task group met and is continuing work on a revised standard.

C592

Mineral Fiber Blanket Insulation and Blanket-Type Pipe Insulation: A new version of this material standard is now in the recently published 2004 Book of Standards, Volume 04.06. The primary change to this revision is the addition of a supplement that includes performance requirements from three military specifications with maximum binder content, maximum shot content, resistance to vibration and water vapor sorption, inclusive of special test procedures. While this supplement is intended for use in marine specifications, it could be included in domestic specifications should the specifier wish to include a simulated durability requirement. Since the supplement is new, it may be difficult to find a laboratory to conduct the tests. One commercial laboratory is R&D Services, of Knoxville, Tennessee (Telephone: 931-526-3348 or 931-372-8871).

C610

Standard on Perlite Pipe and Block: This standard was recently revised and successfully reballoted by the subcommittee. It will next be balloted by the main C16 committee. The revision includes new performance data, particularly thermal conductivity data, but there is separate performance data for block insulation and pipe insulation.

C929

Practice for Handling Thermal Insulation Materials for Use in Contact with Austenitic Stainless Steel: The task group met to discuss the recently balloted for re-approval standard, which passed.

C16.20.01

New Specification for Microporous Insulation: This new task group met in Washington for the first time and developed a title and scope. They will meet again in the spring meeting in Reno to continue development of the new standard.

Subcommittee C16.22–Organic and Nonhomogeneous Insulation Materials: Recent activities on new and existing standards are as follows:

C534

Standard on Flexible Elastomeric Insulation: The task group, along with the task group for C1427–Standard for Polyolefin Foam Insulation, completed the round robin testing among several manufacturers for dimensional stability. A draft will soon be balloted.

C591

Unfaced Preformed Rigid Cellular Polyisocyanurate Thermal Insulation: The task group will ballot a draft with the properties affected by the phase-out of HCFC 141b.

C728

Standard on Perlite Thermal Insulation Board: The task group will ballot this revised standard with new values for tensile, flexural and compressive strength properties.

C1410

Standard for Melamine Foam Insulation: The task group recently balloted a draft, which received some negatives that the task group found to be persuasive. A revised draft will soon be reballoted.

C1534

Standard for Flexible Polymeric Foam Sheet Insulation Used as Thermal and Sound Absorbing Liner for Duct Systems: A new ballot was approved and will receive the 2004 date. However, as the 2004 Book of Standards was just released, this will not be in print until November 2005 when the next Book of Standards is published.

C16.22.01

The task group is writing a new standard for rigid polyimide foam (there is already a Standard for Flexible Polyimide Foam with the designation C1482). This task group recently conducted a ballot on a draft and received a negative, which was resolved. This will be a new standard within ASTM 16.22. There is also a task group writing a new standard for polypropylene foam insulation.

Subcommittee C16.23–Blanket and Loose Fill Materials: This subcommittee addresses a number of standards for mechanical insulation and a number for building envelope insulation. Activity related to mechanical insulation is given below.

C1086-C1086

Specification for Glass Fiber Felt Thermal Insulation: This standard is under task group review, with a recent subcommittee ballot drawing numerous negatives and comments. The balloted revision replaces the words, "glass fiber" with the words, "mineral fiber" in the title and scope; therefore, the scope is being expanded in the revised document to include both glass fiber and mineral wool felt insulation. Review and disposition of negatives and comments is still underway by the task group, which will meet during the Reno, Nevada, C16 meeting this spring.

C1290

Specification for Flexible Fibrous Glass Blanket Insulation Used to Externally Insulate HVAC Ducts: This standard was recently revised and successfully reballoted by both the subcommittee and the main committee. Changes were to add references to more than one flame and fire test. It will now have a 2004 date.

Subcommittee C16.30–Thermal Measurements: This subcommittee addresses a large number of standards used to measure thermal performance of insulation materials and systems as well as a few that address methodologies for thermal calculations.

C177

Test Method for Steady-State Heat Flux Measurements and Thermal Transmission Properties by Means of the Guarded-Hot Plate Apparatus: This standard test method is widely used to test mechanical insulation materials at high and low mean temperatures (as opposed to testing at a mean temperature of only 75 F, used for testing of building envelope insulation). It has recently been revised and balloted at both the subcommittee and main committee levels. A number of negatives have been addressed, and the revised standard is ready to receive a 2004 date.

C335

Test Method for Steady-State Heat Transfer Properties of Horizontal Pipe Insulation: This standard test method is widely used to test pipe insulation at mean temperatures above ambient (there is no ASTM test method for testing pipe insulation below ambient). A revised standard was recently successfully balloted at the subcommittee and main committee levels and will receive a 2004 date. Note: Currently, there are no firm plans to extend the mean temperature range to below-ambient temperatures although there is a strong need for a pipe testing standard for chilled pipe. This is due to a lack of funding from either industry or the Department of Energy to do the test method development work (and ASHRAE’s research project on this subject, while proceeding, is behind schedule).

C1041

Practice for In-Situ Measurements of Heat Flux in Industrial Thermal Insulation Using Heat Flux Transducers: This standard is current with a 2001 date.

Subcommittee C16.40–Insulation Systems: This subcommittee has several major current activities. These are listed below with a short description of recent activity at the Washington meeting.

The task group that is developing a new standard titled, "Standard Specification for Fabrication of Cellular Glass Pipe and Tubing Insulation," continued its work in Washington on a new draft. The task group worked on wording for fabrication details such as what pipe insulation size would be the breaking point for going from half sections to segments, and how many "through" joints shall be allowed per full section of insulation. The draft spec shall also include acceptable types of adhesive, details of billet and miter construction, and details of bond joints. Finally, the new draft contains acceptable and unacceptable methods for through joints and non-through joints. With a little more work, this draft should be ready for a subcommittee C16.40 ballot in February.

A relatively new task group is writing a draft for a new "Standard Specification for Selecting Jacketing Materials for Thermal Insulation." This is taking the form of an existing ASTM C1423 guide by the same title. In Washington, the task group worked on a matrix table of jacketing properties (such as puncture resistance, weather resistance and fire resistance) versus types of material (such as aluminum, stainless steel, flexible laminates). The task group will meet again in the spring in Reno, Nevada.

Subcommittee C16.94–Terminology: This subcommittee only has one standard to address, C168, which contains a number of insulation term definitions. They considered recently balloted terminology for seven terms: homogeneous material; material of homogeneous composition; flexible cellular; polyimide foam; closed-cell foam; open-cell foam; and areal density. There were several negatives received on each term. In each case, the task group considered at least one of the negatives to be persuasive and hence modified the balloted definition. Therefore, they plan on seven terms being balloted concurrently in the next main committee ballot. In the process, the task group is changing the second one of those from "material of homogeneous composition" to "thermally non-homogeneous material or system"; the third one from "flexible cellular" to "flexible cellular insulation"; the fourth one from "polyimide foam" to "cellular polyimide"; and the last one from "areal density" to "area weight." This subcommittee will meet in Reno, Nevada to continue work on these definitions.

Subcommittee C16.96–Technology Transfer: ASHRAE is planning a seminar to be held at its summer meeting, in July 2005, in Denver, Colorado, on the subject of mechanical insulation applications. Possible topics are: acoustical treatment of pipes; overview of a new Applications Handbook chapter; energy savings with pipe insulation; dos and don’ts for installation (i.e., gaps) on pipe insulation; development of a cold pipe testing procedure. More information is available at www.ashrae.org.

C16 held a Monday night forum in Washington, D.C., with two speakers from the North American Insulation Manufacturers Association. Angus Crane, vice president general counsel, spoke on the perspective on life-cycle analysis, and Robin Bectel, director of communications, spoke on energy awareness. Both programs were very informative about the importance of insulation and how effective the products are in energy efficiencies from manufacturing through the life of the insulation. A surprise appearance by some mysterious person dressed as "Energy Hog" during Bectel’s presentation recapped the importance of insulation.

The next forum will be held April 18, 2005, in Reno, Nevada, and will address vapor control for today’s insulation requirements.

Acknowledgements

I wish to thank the following people for their contributions to this article:

  • Bill Brayman, Brayman Insulation Consultants, LLC;
  • Chris Crall, Owens-Corning;
  • Andre Desjarlais, Oak Ridge National Laboratory;
  • Kartik Patel, Armacell, LLC;
  • Jim Shriver, Thermafiber;
  • Frank Tyler, Owens-Corning.

This article is fiction in the truest sense. "Keenan Plastics," and the characters involved are all imaginary; any similarity to real companies and persons is coincidental. But while the "fabric" is fiction, the "threads" come from true stories-anecdotes shared at conferences, workshops and plant visits. The intent is to illustrate the stop-and-start nature that characterizes so many energy management efforts, ultimately resulting in business impacts that fall far short of their potential.

On the first Monday of the month, the general manager (GM) for Keenan Plastics’ Riverdale facility conducted a site managers’ briefing. The GM reviewed the preliminary results for the fiscal year ending January 31. Combined income statements for all eight Keenan manufacturing facilities showed that healthcare and energy costs were both escalating rapidly, eroding per-unit profit margins. While corporate headquarters issued the directive to improve cost performance, each facility at the GM’s discretion would determine the means for doing so. Keenan’s corporate management style conferred a high degree of autonomy to the general managers at each facility.

Jason Chandler, GM of the Riverdale facility, was a rising star at Keenan Plastics at age 38. Chandler had an MBA in finance, and his reputation to date was predicated on his logistics acumen. Many believed that Chandler’s stint as a facility GM was a station on the fast track to a corporate position. If the management rotation worked as expected, Chandler’s tenure at Riverdale would last another two years. Accordingly, any strategic decisions about plant performance were tempered by this time horizon. He did not want a poor performance record to derail his ascent to the top. While he was comfortable with product development, marketing and finance, Chandler deferred most engineering decisions to technical staff.

Keenan’s business was viable because its marketing strategy successfully identified and grew customer segments. Keenan’s business culture was revenue-oriented. Executives that came to power did so as the result of their outstanding contributions to growth. Keenan’s capital investment strategy built sales capacity as opposed to improving operating efficiencies. Until recently, profit volume allowed management to ignore the fact that certain costs like energy and healthcare were eroding profits on a per-unit basis.

Chandler devised a straightforward response to these cost challenges. He perceived healthcare and energy problems as price-driven issues. He declared that each issue was a "project" and picked a capable person to handle it. Janet Ray, the director of administration, was tasked with finding a lower-cost employee health program that sacrificed as little as possible as far as service.

Chad Sweeney, a senior engineer at age 28, was given the task of energy cost reduction. Chad was well-versed with fuel handling and combustion issues, but he’d have to catch up on energy procurement and pricing. With a mechanical engineering degree from the state college and almost five years with Keenan, Chad was developing a reputation as a problem solver. By tapping Chad for the energy problem, Chandler chose a "technical" guy to handle a "technical" issue.

Riverdale was one of the three original Keenan Plastics manufacturing facilities that dated back to the late 1940s. Keenan expanded to eight plants during the 1990s through merger and leveraged acquisition. Lenders looked favorably at Keenan’s cost-cutting experience, achieved primarily through labor reductions. Keenan Plastics’ ratio of staff per ton of product beat the industry average by 15 percent, although this downsizing sent some long-time operations managers–and their institutional knowledge–into early retirement.

The newly acquired plants were purchased when various competitors exited the industry. These plants were highly varied in layout, engineering and staff culture. Keenan continued to struggle with assimilation of the new plants, as evidenced in uneven per-unit cost performance comparisons. There were, in fact, whispers of overcapacity and the threat of closing one or two plants.

The powerhouse superintendent at Riverdale was "Boss" Buehler, a cigar-chomping, former Marine gunnery sergeant and 23-year veteran of the company. The Riverdale powerhouse was Buehler’s turf, and that was fine with Chandler, who in fact had never stepped foot inside that building. As long as utilities were supplied as needed, Buehler’s activity went virtually unnoticed by the GM. This was largely true for the other two original facilities’ powerhouses. The other five, however, were a mixed bag. Some were very folksy, with second- and third-generation workers on the payroll. But with that charm came an insidious patronage system that defied more objective criteria for performance evaluation and staff development. Turnover at these plants was high. Scrap rates and on-time performance of the stamping facilities were generally poor.

Chad began his project with an Internet search for relevant information. He found a wealth of technical how-to guides published by state and federal energy offices. Of particular interest was a California State Energy Commission paper on energy procurement. While Keenan had no California operations, Chad could pick up general concepts from this document. As for consumption issues, he discovered the U.S. Department of Energy’s BestPractices resources, which included system survey guides, tip sheets, diagnostic software and training curricula. This material covered plant utilities that were common to most industries, such as steam, compressed air, process heating and motor drive systems. Keenan plants had all of these systems. The sheer volume of the BestPractices material was at once its strength and its weakness. How could Keenan begin to apply this material? The BestPractices program’s mechanical recommendations ranged from simple operations and maintenance procedures to large-scale asset changes. Many energy-saving opportunities required capital investment. Other solutions called for data-intensive procedures, which seemed like a tall order for the pencil-and-clipboard culture that prevailed in Keenan powerhouses.

Chad immediately dismissed capital projects as an option. He had already witnessed Tina Roth, the Riverdale controller, at work in the annual capital budgeting process. Proposals were categorized either as "revenue makers" or "cost cutters," and energy-related projects always fell into the latter category. She was jaded by earlier cost-cutter proposals that did not pan out. In her opinion, half of such proposals were likely to fail. She managed investment risk by lopping 50 percent off the savings estimate that any cost-cutting proposal promised. Only after such adjustment were cost-cutters ranked for consideration. On top of this, Chandler’s time horizon dictated that the only acceptable projects were those with a 12-month payback or less.

Energy management was another option. The literature presented this as a day-to-day discipline that merged energy practices with regular operations and maintenance procedures. This required benchmarking, monitoring and remediation protocol based on any fluctuation in the stream of energy use data that this strategy demanded. When considering the thinned out, time-pressed facilities staff, Chad suspected that "bean counter" assignments would be poorly received and executed. The hurdles to such activity were tremendous. Staff time was lacking. On-staff technical expertise was spread thin, with one chief engineer to serve all eight facilities. The largest hurdle was the simple lack of incentive: Compensation for facility staff was driven by on-time performance. Not only were energy management duties perceived as a distraction, there was no reward for saving energy.

Chad’s task started out smoothly. He summarized his findings regarding energy commodity procurement–the "price" side of the expense equation–for Jim Koslowski, Riverdale’s procurement director. Jim saw merit in scoping the deregulated fuel market to secure lowest-priced commodities. This activity resonated with Jim, who had a clear mandate for low-cost procurement practices. Still, there was much to learn about fuel spot markets, fixed contracts and hedging instruments.

The other cost variable–consumption–begged some resolution. Capital projects were virtually impossible. Day-to-day energy management was clearly a management-by-numbers discipline that was too much for most facility staff to tolerate. Process benchmarking was best pursued in a multi-plant environment, like Keenan’s. However, the threat of plant closure put GMs on edge; suspicion preempted the sort of cross-facility cooperation that benchmarking demanded.

That left a softer approach: Do quick, easy, one-time projects that cost little if anything to perform. The Department of Energy’s BestPractices resources included innumerable one-page tip sheets that covered such opportunities.

At the next monthly managers’ briefing, this time with Boss Buehler in attendance, Chad had five minutes to present his recommendations. He introduced the BestPractices tip sheets to the audience. In his brief presentation, Chad unwittingly made the one key statement that secured success for his assignment. Chad held up a tip sheet about optimizing air-fuel ratios for combustion. "This," Chad proclaimed, "is a page straight from Boss Buehler’s approach to running a boiler room." Feeling validated before the GM, Boss Buehler became an instant fan of the DOE tip sheets and immediately urged the powerhouse staff to review the entire collection. Buehler’s staff snatched time during the weeks that ensued to act on many of these tips. The crew categorically ignored any improvement that required capital investment. But there were plenty of one-time, low-cost measures such as cleaning combustion chambers, repairing loose seals and compression fittings, and tending to loose- or ill-fitting insulation.

This burst of quick, easy fixes had an immediate impact on energy consumption at the Riverdale powerhouse. Over the next few months, energy expenses declined on a per-unit basis, and management priorities shifted elsewhere.

In the next year, management rotations continued. Thanks to his success with the energy project and other pursuits, Chad Sweeney was promoted to director of outsourcing. Janet Ray enjoyed a large bonus for her successful resolution of the healthcare cost challenge. Jason Chandler landed a corporate position, due in large part to the outstanding performance of the Riverdale facility under his stewardship. A new GM was assigned to the Riverdale plant: Peter Singh was another MBA who came of age with the dot-com industry.

Time also had its impact on the Riverdale plant’s energy performance. Constantly operating machinery was subject to vibration that loosened fittings and couplings. Debris built up in heat exchangers. Soot built up in combustion chambers. Insulation was pulled aside to repair pipe fittings, but not properly replaced. Steam traps failed, and compressed air systems sustained new and larger leaks. Eventually, plant utilities had to run longer and at higher tolerances to deliver the power demanded of them. Energy costs per unit began to creep upward.

Singh placed the energy cost problem at the top of the agenda for a monthly site managers’ meeting. The GM perceived energy as a "technical" issue; so he sought a "technical" person to find solutions. He declared energy cost control to be a "project ?"

Conclusions

  • Control of energy costs is a function of price as well as consumption.

  • Consumption management involves: 1) little one-time, no-cost projects; 2) big capital projects; and 3) energy-smart activities that are integrated with daily operations and maintenance procedures. These need to be pursued not all at once, but in a strategic sequence–allowing incremental victories to pave the way for larger ones.

  • Energy management is an ongoing practice, not episodic and "as needed."

  • Top management awareness of energy problems, and demand for their resolution are certainly helpful. However, CEO awareness and demand are not sufficient by themselves to improve energy cost performance.

  • Energy management may be good for the company as a whole, but it requires many individuals to work beyond the confines of their traditional job descriptions.

  • Strictly defined job descriptions and performance incentives often become a barrier to doing much more than the little quick, low-cost energy "projects."

  • Companies can and do overcome functional barriers to energy management. See the Alliance’s online Corporate Energy Management case study series at www.ase.org/section/topic/industry/corporate/. The series includes companies from a variety of industries, and of differing scales of operation.

Your questions and comments are welcome. Please reply with your energy management question, concern or story. I’ll respond to each, and publish the more provocative discussions in this column. E-mail crussell@ase.org, and please include your phone number.

The chemical process industry enjoyed a building boom in the 1960s in many parts of the world. As these plants aged, corrosion failures associated with the presence of thermal insulation became more frequent. The term most commonly used to describe this problem is "corrosion under insulation," or just CUI. The dramatic increase in CUI led to a major effort within the corrosion engineering community to understand the nature of the problem and to define practical solutions that could be applied to both new and existing systems.

CUI was identified as a problem even before the chemical industry as a group "discovered" it. In 1957, A.W. Dana Jr. published "Stress Corrosion Cracking of Insulated Austenitic Stainless Steel" in the ASTM Bulletin, and H.F. Karnes presented "Corrosion Potential of Wetted Thermal Insulation" at the 57th national meeting of the American Institute of Chemical Engineers. Both Dana and Karnes conducted extensive testing showing that corrosion could be caused by the leaching of chloride and fluoride ions from the insulation materials in use at the time.

Karnes’ work showed that leachable sodium and silicate ions could partially inhibit the corrosive effects of the halogen ions. As a result of research like this, the manufacturing processes and standards to which insulation materials are made evolved to provide materials much less likely to be the direct cause of corrosion, yet CUI remains a major problem for the chemical process industry today.

Let me describe CUI-related corrosion mechanisms and how they relate to insulation materials and the design, installation and maintenance of insulation systems. In addition, I will review some examples of CUI problems that are commonly encountered, even today when CUI and its control are very well understood.

General Corrosion

Corrosion takes many different forms, depending on the nature of the material being corroded and the environment that is causing the corrosion. In the chemical process industry, the most commonly used materials of construction are the carbon steels and 300 series austenitic stainless steels. Each of these alloy families is subject to specific forms of insulation-related corrosion.

When bare steel is subjected to water on a regular basis, it rusts. Eventually, if the rusting is not controlled, the steel will get so thin that it can no longer function as intended. This type of rusting is called general corrosion because it produces broad uniform damage rather than a localized effect. The important variables are the amount of water–often referred to as time of wetness; temperature–generally temperatures between -4 and 150 C; and contaminants that make the water more corrosive–typically chloride or SO2.

The effects of chloride on the rusting of steel are shown by atmospheric corrosion data that has been collected in coastal zones. The measured corrosion rates of steel within a few hundred yards of the shoreline, where humidity and chloride deposition are high, are substantially higher than for steel exposed only a mile inland. In contrast, the rate of corrosion for steel in the southwest desert is very low due to the natural low humidity and atmospheric contaminant levels. The 300 series stainless steels do not experience general corrosion or thinning under wet insulation, but they are subject to another form of corrosion that will be discussed later.

What do time of wetness and the presence of contaminants have to do with insulation and corrosion? Plenty. When insulation is either not properly installed or not properly maintained, it collects water and dramatically increases the time of wetness of the insulated surface. Further, depending on the plant location, the source of water will add contaminants to the insulation that accelerate the rate of corrosion. When the insulated system operates at elevated temperature, the insulation can produce a concentrating effect through wet and dry cycling that increases the concentration of contaminants in the insulation, thereby increasing the corrosivity of the wet insulation.

A properly specified and installed insulation system prevents CUI by not allowing moisture to reach the insulated substrate. Attention to details such as properly overlapping jacket joints, installing the required flashing and the correct use of sealants are absolutely necessary to produce an insulation installation that properly sheds water and prevents substrate corrosion. Low-temperature systems must not only shed water, but also prevent the ingress of moisture vapor that condenses on the cold surface.

Unfortunately, years of practical experience have shown that insulation systems, no matter how well designed and originally installed, eventually lose the ability to shed water. This deterioration occurs for many reasons, including the shrinkage and embrittlement of elastomeric sealing compounds and mechanical damage caused by the inevitable maintenance of an operating chemical plant. Routine maintenance on insulation is usually a low-priority task since many operating departments cannot easily detect the immediate effect of insulation damage. In this age of limited maintenance budgets and manpower, maintenance is focused on equipment that has a direct and easily perceived impact on operating reliability: this in spite of studies showing that CUI has a major impact on maintenance budgets.

An approach used by some insulation designers to control CUI is to select an insulation material that does not absorb moisture. While classes of insulation materials differ in their ability to resist moisture absorption, all insulation materials can be made to absorb moisture that subsequently provides the conditions for substrate corrosion. Fibrous insulations are well-known for their ability to absorb moisture, but less well-understood is that even closed cell insulations will absorb moisture.

For example, when cellular glass or thermoplastic closed-cell material is exposed to freeze thaw thermal cycling, the individual cell walls can fail and allow moisture to fill the cell. At the next freezing cycle, the expansion of the water in the cell causes damage to the adjoining cells, and the moisture penetrates further into the body of the insulation. In general, closed-cell insulations are more resistant to moisture absorption than fibrous or granular insulations; however, they are not immune to absorption and are not by themselves a solution to CUI.

An early Japanese study by Mikio Takemoto of Aoyama Gakuin University, published in the National Association of Corrosion Engineers (NACE) book, "Corrosion Under Wet Thermal Insulation," correlated CUI with insulation type and showed that all the common insulation materials in use at the time, including cellular glass and closed cell polymers, were associated with CUI failures.

Stress Corrosion Cracking

While the 300 series stainless steels are not subject to general corrosion under wet insulation, they are subject to localized corrosion. As the name implies, localized corrosion affects only specific "local" areas rather than the broad surface of the metal. With stainless steel it takes the form of pitting, crevice corrosion and stress corrosion cracking (SCC). Stainless steel gains its ability to resist corrosion by forming a passive layer on its surface. Localized corrosion occurs when the passive layer breaks down in specific locations, at which point the rate of corrosion is greatly accelerated. Stress corrosion cracking is a special form of localized corrosion that results in cracking of the metal and, under severe circumstances, can lead to catastrophic failure of the component. Figure 1 shows a perfect example of severe SCC.

In general, three conditions are required for SCC to occur: the presence of a susceptible material–in this case, the 300 series stainless steels; a cracking agent that is specific to the susceptible material; and the presence of tensile stress that is greater than some threshold stress intensity. While chloride ion is the most common cracking agent for 300 series stainless steel, the other halogen ions can also cause SCC under the right environmental conditions. Tensile stress is usually present in stainless equipment as a result of operating loads; however, the residual stress left in the metal by fabrication and welding operations is usually sufficient to drive SCC when the environmental conditions are right.

Two critical environmental variables that dictate whether or not SCC will occur are a metal temperature greater than 50 C and the presence of liquid water. At lower metal temperatures, it is possible to have high levels of chloride and stress without having SCC. Temperatures can be sufficiently high that even though chloride and stress are present, the surface of the metal will not support liquid water and cracking will not occur.

How does insulation relate to SCC? When insulation is properly installed and maintained, it prevents the presence of moisture at the surface of the insulated item. A properly insulated stainless steel pipe can operate at 90 C in a high-chloride, ambient environment for many years without an SCC failure. However, when the insulation system can no longer prevent moisture penetration, the conditions for SCC can occur inside the insulation.

In coastal and some industrial environments, the atmosphere can be a source of both chloride and water. Rainwater can carry chloride into the insulation, where it concentrates and eventually reaches a level that supports SCC. At one time, some insulation materials contained chloride from the manufacturing process that could be leached out of the insulation and deposited on the surface of the insulated item. Today, most insulation is manufactured without leachable chloride or with inhibitors that help retard SCC.

However, SCC under insulation continues to be a problem because of poor maintenance and external sources of chloride. Proper installation and maintenance of insulation systems are critical. NACE International has published a recommended practice, RP0198-2004: "The Control of Corrosion Under Thermal Insulation and Fireproofing Materials–A Systems Approach" that details how to prevent SCC under insulation. Experience has shown that immersion-grade coatings should be used on insulated stainless steel equipment that is likely to operate in an environment where external moisture and chloride will eventually penetrate the insulation system.

Case Histories

The two case histories below serve to illustrate corrosion that is directly related to the presence of thermal insulation. In the first case the insulation was neither specified correctly nor properly installed or maintained. In the second case the specification was adequate, but years of neglect led to problems.

1) A plant composed of numerous carbon steel vessels operating at temperatures around -40 F was insulated in the early 1980s using cellular glass insulation with aluminum jacket. Cellular glass was chosen because of its good resistance to moisture penetration in low-temperature applications. The specification did not require the insulation to be extended onto any items that were attached to the vessels, such as platform supports or nozzles. As a result the surface temperature of all these attachments was below the ambient dew point temperature most of the time the vessels were operating. This caused extensive general corrosion of the platform supports and many of the nozzles, causing the operator to condemn the platforms and take the vessels out of service for extensive repairs. Figure 2 shows an example of the support damage, and Figure 3 shows how the insulation should have been installed.

Had the insulation been properly specified with the insulation extending out on the supports and nozzles, this corrosion would not have occurred. While this is not strictly an example of corrosion under insulation, it shows how general corrosion can occur in low-temperature systems that are not properly insulated. In this case, even though the insulation was thoroughly saturated with moisture that was in the form of ice at the surface of the column, no corrosion occurred under the insulation. Only outside the insulation, where the steel stayed continuously wet and the temperature was much higher, did corrosion occur.

2) A 304 stainless steel distillation column was operating in a coastal environment less than a kilometer from the water’s edge. This particular environment is well-known for its high winds and rain blowing into the plant off the salt water. The column was distilling chemicals that required operation in the 90 C range, a perfect temperature for chloride SCC. The column was insulated with mineral fiber, and the specification did not require extra precautions against moisture penetration. After a few years, service leaks began to appear at the welds in the bottom of the column. A corrosion engineer correctly identified the problem as externally induced SCC caused by atmospheric chloride and the inability of the insulation system to keep out water. The column was repaired, and the bottom two meters was coated using an immersion grade epoxy phenolic. Ten years later the column was condemned and replaced because of extensive external SCC on the rest of the column shell. Figure 4 shows the outside surface of a nozzle neck removed from the column. Only that portion of the column that was coated during the first repair was free of SCC.

This example clearly shows how effective a remedy coating can be when the probability is high that it will not be possible to keep chloride and moisture out of the insulation. The entire replacement column was coated with epoxy phenolic when it was fabricated and has been SCC-free for many years. The replacement column was insulated using mineral fiber and aluminum jacketing. While this is not the best combination of insulation materials to resist SCC, it is certain that the epoxy phenolic coating will prevent SCC of the new column.

Conclusion

The phenomenon of corrosion under insulation has been understood for at least 50 years, yet it continues to cost industry millions of dollars annually. Preventing CUI is not rocket science: The correct application of coatings along with the proper specification, installation, and most importantly, maintenance of today’s insulation materials, will prevent CUI and extend the life of increasingly costly process equipment.

Figure 1

This is a metallographic cross section through a piece of 300 series stainless steel that is suffering from severe stress corrosion cracking (SCC). The very fine and highly branched cracks are characteristic of SCC, which grew from bottom to top in this picture.

Figure 2

Continuous condensation on this platform support due to the low operating temperature combined with inadequate coatings maintenance resulted in corrosion of the support. These supports had to be repaired.

Figure 3

These platform supports are properly insulated and no corrosion is present.

Figure 4

This is an area of extensive external stress corrosion cracking and pitting on a nozzle neck of the distillation column. This area leaked product through the cracks and into the insulation.

In his work with insulation, this month’s Insulation Star meets his biggest challenges when determining the causes of hot surface temperatures on insulated equipment. The equipment his company insulates is usually very large, and when a client reports hot surface temperatures, outer lagging needs to be removed for inspections. The problem can be localized or caused by something such as missing draft barriers, often several floors below the detected problem area. When several problem areas are identified, it is typically not the same problem in all areas, and it is often an expensive and time-consuming process until all hot areas are remedied.

Douglas DeVault, principal engineer, has been with The Babcock & Wilcox Company for more than 20 years. He is involved with thermal insulation and also research and development of new technologies for improving boiler performance and emissions reduction in large electric utility coal-fired boilers. He is also his company’s product technical representative for refractory, insulation and lagging as well as structural heat transfer.

For DeVault, recent significant advances in the industry have come in the form of new tools for analyzing insulation performance.

"With the advancements in computer equipment, the calculation of cold face temperatures and required thickness are quickly at our fingertips. This is particularly true when evaluating a system that requires a three-dimensional heat transfer analysis, which tends to be a lot more complex than one-dimensional thermal calculations," said DeVault, who holds a degree in mechanical engineering with an emphasis on heat transfer.

Standard manuals for the equipment his company insulates inform designers and contractors how to install the insulation, as well as how much to use. It is DeVault’s responsibility to periodically review these standards and keep them current. He becomes involved in specific contracts only when there is something that the standards do not address or if problems come up on a specific job.

DeVault stays current with his knowledge of new insulation products and procedures and industry standards in part through customer and vendor contacts as well as magazine articles. However, his most valuable resources are the field service engineers and sales force, who are in constant contact with a large diverse number of people and insulated systems. New items are brought to DeVault’s attention for evaluation.

For DeVault, thermal insulation plays a key role in regard to the new ASME Power Test Code 4, the code that defines boiler test procedures for fuel efficiency.

"Under this new code the customer has the option of measuring surface temperatures and calculating heat loss from the boiler and related equipment. This is a different twist from the past when this heat loss was based on a published curve versus boiler capacity. The implications of the new code are the possibilities of missing performance guarantees if the insulation system does not perform as expected," he explained.

In regard to bettering the industry and solving insulation-related problems, DeVault’s wish list begins with a way to manufacture block insulation with a foolproof method of assuring that the blocks are butted together tightly when installed.

"Currently, an inspection is used after installation and this task is left to supervisors-on large boiler or environmental contracts, much can be missed," he said. This problem would be solved by block insulation manufactured in a way to ensure proper installation.