Category Archives: Global

The line that separates success and failure with a mechanical fastening system can often be a matter of knowing where to turn with the right questions. The Internet, proactive manufacturers and improved distribution make it a lot easier to get advice and involvement from experienced professionals today than it was in the past. The technology of fastening also has improved, with many more user-friendly systems now available to field personnel. All in all, the prospects for job success, and labor-saving, continue to improve. But still questions exist with many users, designers, specifiers and owners. With an eye toward answers, we visit the 10 most common complaints in insulation fastening.

1. "The insulation fell down after it was installed. What we use seems unreliable."

Whether the fastening method is adhesive applied anchors, self-sticking/peel-and-press pins, weld pins or any of the multitudes of other systems now in use, knowledge before the fact usually answers questions after-the-fact. The best prescription for success begins with knowing (and following) the manufacturer’s recommendations, understanding (and using) guidelines for application, and yes, even reading the instructions.

Proper training by manufacturer’s representatives and qualified distributors can be crucial, too. Adequate instruction can prevent problems before they occur, and can take the guesswork out of a specific application while on the job. Reviews of manufacturers’ records and distributor support files show that the vast majority of mechanical failures occur when one component, or a combination of system parts, fails to be used properly, or to be used under proper conditions. While there’s no "magic bullet," taking care of basics seems to work just as well in insulation fastening as it does on the rest of the job.

2. "We’ve had problems with these type of systems and we’re not comfortable trying them again."

There is absolutely no reason to experience repeated trial-and-error if the problems and idiosyncrasies of past technology don’t change. Why risk a job with costly experimentation or with a process that is detrimental to your work? That having been said, technological changes are affecting all of our lives at an ever-increasing pace, and a great deal of that change is viewed as positive. Labor-saving devices in the mechanical end of insulation fastening are an excellent case in point.

A new generation of worker is coming to "the site" with a skill set that includes labor-saving ways to make applications run more efficiently, and at a reduced overall cost. Many workers are aware of the abundant innovations available to the insulator today. Their comfort level is much higher than those semi-exposed to technology in years past. Adding to worker’s levels of comfort has prompted support by manufacturers, distributors and representatives as problems arise (not weeks, or months, afterwards), and all aid in ease of use.

3. "My people don’t understand it. It’s just too hard to use."

This complaint is especially associated with the specialized welding process used in insulation fastening. A better understanding of the process itself tends to eliminate a majority of the difficulties. Most pin welding is achieved using capacitor discharge (CD) equipment and fasteners designed for the procedure.

A great deal of the guesswork has been eliminated from pin welding in the last few years through new solid state CD components and improved fastener designs and materials. In other words, successful fastening can now be a function of technology more than labor.

Through proper training (or retraining), insulation fastening crews can be taught the right techniques, as well as the care and operation of the latest equipment to become more productive on the job.

The language barrier, once a notable hindrance to proper use and understanding of more technical equipment, has begun to pass out of existence as manufacturers create operation literature and support materials that offer multi-lingual instructions and easy-to-follow graphics.

4. "It’s too time consuming. Other methods seem faster!"

The adage "it doesn’t take any longer to do it right" most certainly applies in today’s construction world in fastening systems. Granted, it can take time to get the proper training and to assemble the correct equipment and accessories in preparation. However, the end results–the expected results–make the investment in time worthwhile.

The days of heavy, cumbersome equipment, requiring all sorts of special considerations or attachments, are long gone. Highly portable systems are now the norm, and they are easy to set up and easy to operate. These portable units can communicate with the operator, too, so he has a much better understanding of whether conditions are favorable. Of course, special circumstances require special system setups, and under those conditions there is only one way to do it–the right way!

5. "Equipment and support are difficult to get here."

This complaint may certainly have been valid not all that long ago. In recent years, however, changes in supply and distribution have made the range of insulation fastening choices readily available in all major markets throughout this country. Distributors and their branch locations are expanding into a broader range of fastener system offerings, including not only the fasteners and related accessories, but also installation equipment and job-site assistance.

With the newer, more portable welding systems, full-line distributors and their outlets are now stocking repair and replacement parts, as well as consumables. In some cases, distributors are making new equipment and rental units available directly from their branch locations. That means desired insulation fastening systems are much more accessible to those who ultimately need them and where they need them.

6. "Pin welding just doesn’t seem safe."

It’s true that welding equipment and necessary power introduces a new set of safety precautions on the job site. Operator safety, however, is easily managed, just like other potentially harmful situations in today’s construction environment. First of all, design of equipment is the safest it has ever been. Redundancies built into system functions assure the safety of everyone on site. Hands-on safety training is available to reinforce proper practices and introduce the up-to-date features found on newer equipment. Printed materials, especially those incorporating how-to and step-by-step graphics, reduce safety concerns tremendously. Combine all this with access to information available on the Internet, and safety issues can be quickly brought into focus and managed.

Knowing "who is qualified to do what and when" is the best rule of thumb. Conversely, knowing "who should not do what and when" is crucial.

7. "We don’t know how to fix problems when they occur. We’re not familiar with some of this stuff."

This complaint, like avoiding things more "technical," is quickly fading. With the focus on specialized work environments and independent contractors skilled in a small segment of the total job, the do-it-yourselfer and jack-of-all-trades who might file this complaint is becoming rarer. Likewise, simplification of equipment and systems are making for many fewer headaches and frustrations. It’s also important to remember that newer equipment is better understood by operators, that the use of pictures and graphics in literature communicates more effectively, and that the Internet can greatly improve the "familiarity factor."

Of course, use breeds familiarity, but the real proof is success. More and more contract operations at all levels of the insulation trade are benefiting from the advancements being made in products and their features.

8. "We never have the things we need! Availability at the job site is a problem."

Supply and demand drive our economy. With the growth and maturity of distribution in the insulation industry, in-stock product (even for specialty fastening items) has vastly improved in the last 10 years. Likewise, the understanding of what is needed (especially in local markets and according to regional use patterns) is much better between vendors and manufacturers. This "right product for the right application" scenario has driven manufacturers to be more keenly aware of product availability. Many suppliers have in place "just-in-time" or "on-site" consignment inventories to assist the user precisely when the need arises.

9. "We’re not that familiar with pin/stud welding and it’s too hard to get the information."

There will always be those companies that are reluctant to change, and others that don’t take advantage when labor-saving techniques enter the picture. But for the most part, the construction market is comprised of companies that advance their productivity by adopting improvements in their use of time and labor. In today’s labor-cost market, labor-saving systems are the name of the game, like pin/stud welding systems for commercial and industrial insulation fastening.

The really bright spot is that newer pin/stud welding equipment is much easier to use today. Equipment manufacturers are marketing the lightest weight, most fully capable equipment ever produced for pin fastening applications. The most advanced models even feature built-in diagnostics and other electronics to assure shop, supervisory and field personnel optimum working conditions before, during and after use. Moreover, manufacturers, representatives and distributors are offering more hands-on training, as well as equipment support, right from local branches. Factory-trained technicians are more prevalent too, specializing in 800-line product support and assistance. Finally, don’t forget the impact of the Internet! Certain websites feature the how-tos on use and setups, all at the touch of a button, all making sure that being familiar is well within the reach of every user.

10. "There really isn’t anything new. Nothing’s really changed."

Change is a way of life in today’s mechanical fastening market! While it can be true that the basic product and processes haven’t changed that much, the methods of delivery have changed forever. Long gone are special power requirements for welding fasteners, even those approaching 1/2-inch in diameter. Nor is equipment so heavy that it takes an extra crew and scaffolding to support it. In fact, today a 30-pound or less pin welder is the standard for most innovative contractors. These new lightweight units include self-diagnostic components as standard features to make preparation and use a breeze. System support from distributors and manufacturers is at an unprecedented level, with access to a multitude of Web-based materials available on the computer from any location. All in all things have changed, not only a lot, but also for the better!

Figure 1

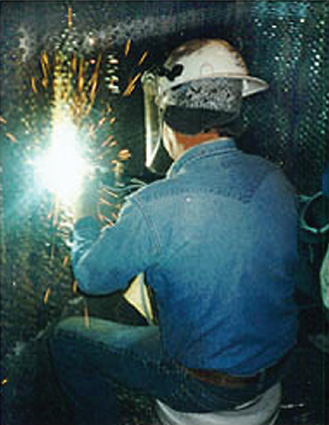
Self-lock fasteners.

Figure 2
Figure 3

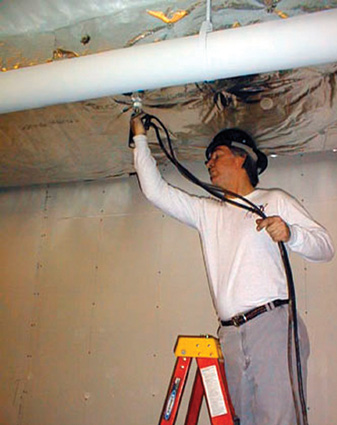
An installer fastens insulation with cup head weld pins.

Green building has become a buzzword of late. Open any trade publication, construction journal or design manual and you’re sure to see some reference to sustainable design. Those who have just begun to pay attention to this market trend may ask, what exactly is green building, and how does it affect our industry?

According to Gary Kuzma of Hellmuth, Obata + Kassabaum Inc. (HOK), a design firm world-renowned for its commitment to sustainable design, "Green building is an environmentally and people-friendly solution to a living and working environment."
Alan Scott, director of consulting services at Green Building Services of Portland, Oregon, echoes this interpretation. "Green building is building that includes aspects of sustainable design with the goal of reducing operating costs and environmental impact," he said.

The Office of the Federal Environment Executive defines green building, in essence, as the practice of increasing the efficiency with which buildings use resources and reduce building impacts on human health and the environment.

Green building elements can range from orientation of the building to minimize solar impact, to high-performance glass, to energy-efficient lighting and on-site cogeneration of power supply. Green building is making the greatest impact in commercial, institutional and multi-family housing sectors. According to Kuzma, director of mechanical, electrical and plumbing engineering at HOK’s Houston office, there has been little impact in the industrial sector as yet.

Taryn Holowka, media contact for the U.S. Green Building Council (USGBC), an organization that promotes environmentally responsible buildings, agrees. "The program was originally created for the commercial sector, and that’s where we’re seeing the most activity," she said.

However, sustainable design influences the insulation industry indirectly, since energy conservation is a large factor in green building. Improving a building envelope’s energy efficiency is a key component to overall energy conservation, and one cost-effective way to do that is to increase the amount of insulation, said Kuzma.

Insulation is one of the tools that can be used to attain energy efficiency. Depending on the client’s project location, insulation can become an even more important factor. Thermal insulation may have more of an effect in a Minnesota winter or a Phoenix, Arizona, summer than it does in a city like San Diego, California, which enjoys mild year-round temperatures, said Kuzma. In most of the United States, increased insulation is a cost-effective way to gain on energy efficiency.

When increased insulation improves thermal performance, it helps a project earn LEED (Leadership in Energy and Environmental Design) credits for bettering the energy efficiency of the building. A project receives credits toward certification if it goes above the industry standard baseline for commercial buildings–ASHRAE Standard 90.1. Apart from the building’s envelope, insulation is also present on ducts and pipes, although the LEED credit is wrapped up in the whole of energy efficiency.

The USGBC’s LEED Green Building Rating System is a voluntary national standard in which construction and renovation projects earn credits toward certification as sustainable buildings.

The original LEED classification applies to new construction (NC); in this scenario the building owner is in control of both core and shell and tenant spaces, and is working to certify the building as a whole. The levels of certification (depending on the number of points the completed project receives) are certified, silver, gold and platinum. Points can be earned for a myriad of accomplishments: for using recycled content materials; for reducing design energy cost by 15 percent or more; for recycling or salvaging 50 percent or more of the construction and land debris waste; or for using materials from local sources.

Other LEED credits include the utilization of water-efficient landscaping (some sites plant drought-resistant trees that do not need watering); incorporating low-emitting paints, carpets and adhesives; and designing the building so that 75 percent of tenant spaces are exposed to daylight.

Altogether, there are more than 50 items in six categories that offer points toward certification. However, earning them can be a challenge–only seven of the 188 LEED-certified buildings nationwide have earned platinum status.

In addition to LEED-certified NC, there are three new programs for the commercial sector. LEED for existing buildings (EB) addresses specifics for existing buildings that are in need of facility and operational improvements. It’s a set of performance standards for the sustainable operation of existing buildings, according to Kuzma. It covers building operations and system operations in existing buildings where the majority of the interior and exterior construction is to remain unchanged.

"The EB program has to do with renovation, not necessarily of commercial interiors, but of HVAC systems, plumbing systems or things other than what the tenants actually see.

"Commercial interiors (CI) addresses specifics of tenant spaces, primarily in office, retail and institutional buildings where there are tenants occupying spaces. For example, a developer builds a building and seeks to bring in tenants to occupy that building. The spaces that are occupied by the tenants are covered by the LEED CI designation," said Kuzma.

Finally, core and shell (CS) basically addresses new core and shell construction, encompassing the base building elements–the structure, the envelope and the central systems like HVAC, plumbing, etc. It recognizes that there is division between the owner and the tenant for certain elements. It’s intended to evaluate building projects where the owner is not in control of the interior design and setup of tenant spaces.

Additionally, the USGBC is currently developing guides for sustainable design that will apply specifically to non-commercial structures such as healthcare facilities, schools and campuses, laboratories and retail locations.

Companies who have implemented green building are seeing benefits in three areas, which Kuzma refers to as "P cubed: People, Planet and Profits." One of greatest benefits is increased employee productivity, thanks to better working environments.

"There have been many studies done in recent years that have shown that buildings with these improved environmental qualities actually result in better people performance. People are sick less, are at work more, and tend to perform better if they’re comfortable.

"If you can improve the productivity of the people that occupy your building, let’s just say arbitrarily, half of a percent in one year, it will more than cover the increased cost of the ventilation effectiveness or improved lighting–the paybacks are almost instantaneous. If you look at the salaries, and their benefits, what people cost versus what buildings cost, it’s dramatically different. People cost so much more. Just making a small impact on improving people performance is huge on the bottom line," said Kuzma. This is one of the biggest selling points of sustainable design for companies who need to be convinced it’s a good idea.

LEED-certified buildings also have a gentler environmental impact, and help to reduce the depletion of natural resources through both construction and their life-cycle phases. Promoting environmental stewardship is very important to many large
companies’ public reputations, and they want to achieve LEED
certification in part to let the public know that they are keeping the environment in mind.

And finally, there’s the bottom line–an important consideration in uncertain economic times and in view of record-high
energy prices.

"If a building is more energy-efficient, costs less to maintain and uses less water, all of which are savings in annual operating costs, which contribute to lower life-cycle costs, it makes financial sense," said Kuzma.

With so many important benefits, what’s stopping people from doing green building? It seems the challenge to getting LEED certified is probably not much different than any other project–providing the best end product within budget and on schedule.

"If there’s any challenge with getting LEED certified, it’s the process. There’s paperwork to fill out, a process that has to be followed. It’s a very process-driven methodology in implementing the sustainable design objectives you feel are important. It’s important to have a team of professionals that have that experience," said Kuzma.

"It used to be that the difficulty or challenge was finding a project team that has the experience with the process of getting certified. But today, that’s no longer the case. There are a lot of people in construction, a lot of owners, a lot of design professionals who are educated and versed in LEED.

"It’s not hard to find a team of people who promote it, or people who are good at it, but it’s even better to have a team who wrote a book on the subject," said Kuzma.

Despite the challenges and notwithstanding the perception of the construction industry as one that’s initially resistant to change, the USGBC reports a high level of interest in its LEED-certification programs.

"The trend is growing very fast," said Kuzma. "Some project types faster than others, some owner types faster than others, some design firms faster than others. Within HOK, it is not a trend. It’s what we consider a standard of care that we try to apply to every project for every client. To me, fundamentally, that’s what it has to be for it to be successful."

In addition to the 188 buildings currently LEED-certified in the United States, another 1,794 projects are registered with the USGBC program and are seeking certification.
"This growth is much higher than we anticipated," said Holowka. "About 5 percent of new commercial construction is green building, totaling 215 million square feet of space." For a program only 5 years old (it was publicly launched in 2000), that’s quite an accomplishment.

No matter what your job is, you know that changing market expectations and a shifting regulatory environment make today’s construction projects more complex than ever before. Design professionals today must produce construction documents of unprecedented breadth and depth; more owners want facilities that are "green," and meeting the demands of energy codes requires coordination of large amounts of often diverse information. MasterFormatTM 2004 Edition provides the means to meet these challenges.

For 40 years the 16-division MasterFormat has been commercial construction’s "Dewey Decimal System." It is a master list of numbers and titles for organizing specifications, contracting and procurement requirements, and other data. The resource standardizes communication about projects for everyone involved: engineers, architects, specifiers, contractors, suppliers and others. Standardized communication helps project teams meet schedules, budgets and owners’ requirements, and in the process helps to mitigate errors, omissions and change orders.

Expanding Beyond 16 Divisions

Since the early 1960s, MasterFormat organized project data into 16 divisions, with each division made up of section numbers and titles, the building blocks of any project manual. With its 2004 edition, MasterFormat saw the biggest rewrite in its history. It has broadened and deepened considerably. During the new edition’s development construction, practitioners and organizations, seeing facilities becoming more complicated at a faster and faster rate, made it clear that the 16-division structure had become inadequate. It couldn’t handle the volume and complexity of data for modern projects. Causing the overcrowding were many recent advances in building technologies, driven mostly by computerization of facility systems management. Construction materials also have advanced. And adding to the congestion were new priorities for buildings. For example, green building, rarely mentioned 40 years ago, is now a major concern. So is energy efficiency.

Not only had MasterFormat‘s 16-division structure become inadequate, but its five-digit system for numbering sections didn’t provide for enough data "slots" in many divisions. This shortcoming had forced earlier MasterFormat editions to make compromises in classifying information. For example, data slots for lightning protection, fire suppression, and detection and alarm were contained in Division 13 (Special Construction) instead of Division 15 (Mechanical) or Division 16 (Electrical) because Division 13 had room.

And for subjects, MasterFormat didn’t cover, or covered poorly, non-standard section numbers, and divisions were appearing in project manuals. Officially, they didn’t exist, but many "Division 17s" showed up across the industry, for everything from telecommunications to railway track work to signaling.

Such Band-Aid approaches resulted in misplaced or missing project information. That led to errors, omissions and rework. MasterFormat was becoming less useful as an information management standard.

MasterFormat Improvements

With its new edition MasterFormat has become broader and deeper. Based on unprecedented industry input throughout its development, MasterFormat 2004 Edition‘s philosophy is to provide an organizational structure for project information that does a number of things. It encompasses all data generated for today’s projects and can handle ever-constant growth in the volume and complexity of project data. It provides more comprehensive and detailed data on projects’ mechanical and electrical areas. It maintains organizational consistency and minimizes change where the previous structure is still adequate. It follows recognized information classification principles.

The new edition also goes beyond construction to address the facility’s full life-cycle, including maintenance and operations. And it goes beyond buildings to address horizontal construction, such as roads, rail and utilities. Lastly, it covers process engineering construction, such as assembly lines and the manufacturing plants containing them.

The new edition’s philosophy is reflected in MasterFormat 2004 Edition‘s new features, which include:

General

  • An increase to 50 divisions (00-49) from 16.

  • Divisions 03 to 14 are much the same as in MasterFormat 1995.

  • Divisions 01-49 are in five subgroups:

  • General Requirements Subgroup (Division 01)

  • Facility Construction Subgroup (Divisions 02-19)

  • Facility Services Subgroup (Divisions 20-29)

  • Site and Infrastructure Subgroup (Divisions 30-39)

  • Process Equipment Subgroup (Divisions 40-49)

  • Division numbers are reserved throughout for organizing data generated by future products, technologies and methods.

  • A new section-numbering system using six digits in pairs, instead of five digits, that expands more than a hundredfold the level 3 sections possible in each division.

General Requirements Subgroup (Division 01)

A new feature of MasterFormat 2004 Edition that is especially relevant for insulation specifiers is the General Requirements Subgroup (Division 01), which provides data slots for specifying a facility’s performance. For example, performance specifications can be written to have the facility conform to the energy efficiency codes of its state and/or locality. They also can say a building is to meet environmental sustainability standards, such as the U.S. Green Building Council’s LEED (Leadership in Energy and Environmental Design) Green Building Rating System®.

MasterFormat 2004 Edition‘s performance requirements sections in Division 01 are:

  • Facility Performance Requirements (01 81 00)

  • Facility Substructure Performance Requirements (01 82 00)

  • Facility Shell Performance Requirements (01 83 00)

  • Interiors Performance Requirements (01 84 00)

  • Conveying Equipment Performance Requirements (01 85 00)

  • Facility Services Performance Requirements (01 86 00)

  • Equipment and Furnishings Performance Requirements (01 87 00)

  • Other Facility Construction Performance Requirements (01 88 00)

  • Site Construction Performance Requirements (01 89 00)

In addition, Division 01 provides for incorporating a facility’s sustainability in the project closeout documents. In section 01 78 00 (Closeout Submittals) there is a level 3 section (01 78 53) titled Sustainable Design Closeout Documentation for specifying this information.

Facility Services Subgroup (Divisions 20-29)

The 1995 MasterFormat‘s Division 15 (Mechanical) is replaced by MasterFormat 2004 Edition divisions with expanded coverage for Fire Suppression (Division 21), Plumbing (Division 22) and Heating, Ventilating and Air Conditioning (Division 23).

The content contained in the old Division 16 (Electrical) is expanded by creating new divisions concerning both power delivery and data and communications transmission: Integrated Automation (Division 25), Electrical (Division 26), Communications (Division 27) and Electronic Safety and Security (Division 28).

Site and Infrastructure Subgroup (Divisions 31-35)

This subgroup expands MasterFormat to cover site and heavy civil projects. They include transportation, utility and marine construction.

Process Equipment Subgroup (Divisions 40-48)

This subgroup expands MasterFormat to address manufacturing, water and wastewater treatment, power generation and other types of process engineering projects.

Benefiting Those Who Specify Insulation Products

Compared to MasterFormat 1995, the structure of Division 07 (Thermal and Moisture Protection) in MasterFormat 2004 Edition is similar but with more detail. Those who know the old Division 7 should adapt easily to the new edition. And by providing for more comprehensive and detailed specifications, the division’s added information slots can help specifications writers manage the growing diversity of insulation products and applications.

Let’s compare MasterFormat 2004 Edition‘s Thermal Insulation section (07 21 00) with MasterFormat 1995‘s equivalent, the Building Insulation section (07210). That section has no additional data slots. But in the 2004 edition there are several slots, at both level 3 and level 4, getting specific on various insulation types:

  • Thermal Insulation (07 21 00)

  • Board Insulation (07 21 13)

  • Foam Board Insulation (07 21 13.13)

  • Fibrous Board Insulation (07 21 13.16)

  • Mineral Board Insulation (07 21 13.19)

  • Blanket Insulation (07 21 16)

  • Foamed-in-Place Insulation (07 21 19)

  • Loose-Fill Insulation (07 21 23)

  • Blown Insulation (07 21 26)

  • Sprayed Insulation (07 21 29)

It’s one example of how MasterFormat 2004 Edition‘s added scope and detail can reduce the odds of misplaced or missing information creating project delivery problems.

In addition to providing for more detail, MasterFormat 2004 Edition has moved data slots for certain other types of insulation for more meaningful organization. For example, plumbing insulation is in the new Plumbing division (section 22 07 00). HVAC insulation is in the new HVAC division (section 23 07 00). Fire suppression systems insulation is in the new Fire Suppression division (section 21 07 00). And insulation for process piping and equipment is in the new Process Integration division (section 40 42 00).

More detail. Better locations, easily identified. Those are tools for doing a better, more intelligent job of specifying insulation. It adds up to enhanced communication among the diverse players who deliver increasingly complex buildings. And better communication helps the project team meet owners’ ever-challenging expectations (and code requirements) on schedule and within budget.

CSI and Others Aid in the Transition to the New Edition

Interest in MasterFormat 2004 Edition is accelerating and the Construction Specifications Institute (CSI) is aiding the construction industry’s transition. Owners are attracted to the new edition because its expanded scope provides for project performance specifications. General Motors, Walt Disney Imagineering Labs, the Bay Area Rapid Transit System and the Canadian government are among those requiring future projects to follow the new edition. A growing number of architectural, engineering and construction firms also are converting.

MasterFormat users have several tools available with the new edition for transitioning from a previous version. The Transition Matrix is an Excel® file on the CD included with the publication. It shows the new edition’s equivalents to the 1995 and 1988 editions’ section numbers and titles. The Keyword Index lists terms and recommends section numbers for them.

Education Options

In 2005, CSI plans to provide education at architectural, engineering and construction firms, corporations, government agencies and other organizations. Sessions will address differences between the 1995 and 2004 editions, best practices and implementation strategies. Local CSI chapters also are conducting MasterFormat 2004 Edition education.

The number of MasterFormat instructors trained and accredited by CSI will continue to grow as more seminars to train them are held this year. For updates on MasterFormat 2004 Edition education offerings and a list of CSI-accredited instructors, go to www.csinet.org/masterformateducation.

Master Guide Spec Systems Converting

By the end of 2005, several providers of master guide specifications systems plan to have revised their products to conform to MasterFormat 2004 Edition. They include:

  • ARCOM’s MasterSpec®

  • CSRF SpecText®

  • Digicon Information Inc.

  • Canada’s National Master Guide Specifications

  • Building Systems Design’s BSD SpecLink®. It has been revised already. A global switch rearranges specs per the 2004 or 1995 editions.

What’s Next?

MasterFormat 2004 Edition‘s new organizational structure for project information is intended to serve the next 40 years the way previous editions have for the past 40 because of its built-in flexibility and expandability. New topics concerning construction projects can be assimilated readily and systematically as materials, methods and technologies advance. And CSI is developing a process so that as changes come about, section and division numbers will be added continuously. It will replace the practice of simply publishing a new edition every several years. The industry is evolving too fast for that.

For more information about MasterFormat 2004 Edition or to buy a copy, go to www.csinet.org/masterformat or call CSI at 800-689-2900.

During the past year or two, most of us have become accustomed to hearing about the high cost of a barrel of crude oil. We’ve also probably frequently read or heard about how Americans consume one-fourth of the world’s oil. For the year 2004, that worked out to about 20.8 million barrels per day out of the total world demand of 82.4 million barrels per day. Furthermore, that demand for crude oil has been increasing rapidly, due to surging economic growth in China, India and other Asian countries, while demand continues to grow briskly in the United States, Canada, and other industrialized nations due to steady economic growth. While the price of a gallon of gasoline at the fuel pump is the gauge by which most Americans judge the price of energy on a personal basis, the price of a barrel of crude oil has become the gauge by which most of us judge the price of energy on a world basis.

As recently as September 2003, crude oil was selling for about $25 per barrel. By October 2004, it had risen as high as $55. Then, by January 1, 2005, it had dropped to about $42, only to rise to about $58 in early April, and then quickly drop back to about $50 by mid-April. So, recent oil prices recently have been extremely volatile and are likely to remain so. Overall the crude oil price has been erratic and seemingly unpredictable during the past year and a half, it has stayed well above $40 per barrel, showing no signs of dropping back to the $25 per barrel price of late 2003.

Many American politicians and other citizens have called for the United States to reduce its dependence on oil imports. To do so, they recommend that we increase domestic oil exploration for new fields and increase drilling in known fields located on federal land, in particular in the Alaska National Wildlife Refuge (ANWR). This seems logical since U.S. demand for crude oil continuously increases while domestic production continuously decreases. For example, from 2003 to 2004, U.S. demand increased by more than 400,000 barrels per day (bpd) while U.S. production of crude oil decreased by about 250,000 bpd. This has resulted, of course, in a dramatic increase in U.S. crude oil imports. This increasing importation of crude oil worsens the U.S. trade imbalance, thereby weakening the U.S. dollar on the foreign exchange markets and leading to less foreign investment in American securities. If this pattern persists, it could eventually seriously erode the purchasing power of American households. To rectify this situation, it is incumbent on all Americans to find ways of importing less foreign crude oil.

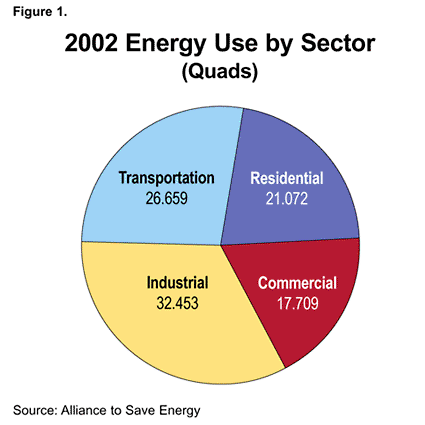
Americans’ consumption of energy in general, and of crude oil in particular, can be broken into several general segments shown in Figure 1, which gives the breakdown, by sector, of U.S. energy use in 2002 where the total use was 97.89 quads, or quadrillion Btu.

With the National Insulation Association member companies serving the first two major categories, you can see from Figure 1 that they have an impact on slightly more than half the energy use in the United States either directly or indirectly. So, in terms of total U.S. energy consumption, it is worthwhile taking a look at mechanical insulation’s contributions.

What’s in a Barrel of Oil?

So, how much energy is in a barrel of crude oil? Well, a barrel of oil has 42 U.S. gallons, and each gallon has almost 140,000 Btu of energy content, give or take a little on the energy content depending where the oil is from. Consequently, a typical barrel of oil contains almost 6 million Btu of energy.

So what? Well, if you drive your car an average of 17,000 miles per year and it gets an average fuel efficiency of 17 miles per gallon, then your car consumes 1,000 gallons of gasoline a year. Accounting for the 15 percent loss of crude in the refining process due to inefficiencies, your car consumes about 23 barrels of crude oil per year to provide the gasoline that it runs on. If you have two such cars in your family, then your cars would consume the equivalent of about 46 barrels of oil per year. At $42 per barrel, that’s about $1,900 spent annually by the refiners on the crude oil that they refine into gasoline to power your two cars. (Note: I am using the price of $42 per barrel as a reference price since it’s the equivalent of $1 per U.S. gallon and makes it easier to make comparisons to the price of distillate fuels such as gasoline and heating fuel. A gallon of gasoline costs much more than a gallon of crude oil due to refining costs, marketing and distribution costs, and federal and state taxes.)

Of course, crude oil also powers trucks, trains and airplanes, our construction equipment, some building heating and some electricity production, and also serves as a chemical feedstock for plastics. According to Oil & Gas Journal, the end result is that as a nation, in 2004 Americans consumed about 20.8 million barrels per day (bpd) of crude oil, or 7.6 billion barrels per year. With a population of 295 million Americans, that works out to almost exactly 26 barrels of oil per person during 2004.

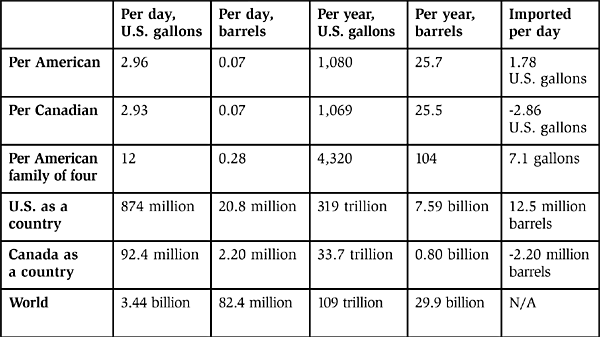
As an American, that’s your individual average consumption–26 barrels per year, or 2.96 gallons of crude oil per day. If you have a family of four, then your family’s consumption share would be almost 12 gallons per day or 104 barrels per year.

Incidentally, Americans are in an extremely close race with our Canadian neighbors in being the world’s most oil-consuming society. In 2004, the 32.2 million Canadians consumed about 2.20 million bpd of crude oil, or about 2.93 U.S. gallons per Canadian per day, only slightly less than U.S. per-capita daily consumption. However, Canada produces twice what Canadians consume. Canadian oil suppliers export their surplus crude oil south into the United States, either as crude or as refined distillates. In 2004, the United States, by contrast, only produced about 40 percent of what Americans consumed and therefore had to import the other 60 percent of its crude oil supply from other countries, including Canada.

The table in Figure 2 summarizes these numbers.

Even though Americans use a large portion of crude oil for transportation, these numbers also include the U.S. share of industrial use of crude for refining crude oil, as energy and feedstock for producing chemicals, for manufacturing various products and so forth, as well as heating office buildings, hospitals, refrigeration equipment, etc. That’s where mechanical insulation becomes significant. NIA member companies’ products and services reduce the use of thermal energy at commercial and industrial facilities and thereby reduce the consumption of energy resources such as natural gas and crude oil.

Plant Insulation Analysis

In my article in the December 2004 issue of Insulation Outlook, titled "The Fall of the Oil Age," I included a chart (Figure 3) that shows how much crude oil can be saved by insulating a square foot of a 600 F surface with 4-inch-thick mechanical insulation. On this chart, I considered this energy loss year by year for up to five years.

In doing the calculations for this chart, using 3E Plus®, I was struck by the power of mechanical insulation. To me, it’s remarkable that this tiny square foot of insulation saves as much as 16 barrels of oil over the course of five years under these thermal conditions. In view of the high price of crude oil, this realization encouraged me to take a broader look at mechanical insulation’s ability to reduce crude oil consumption. To do this, I decided to consider an oil refinery to determine the amount of extra heat loss due to damaged (or missing) mechanical insulation.

Let’s consider an example plant taken from NIA’s National Insulation Training Program (NITP). NITP students learn that this plant is a 125,000-bpd oil refinery that has 356 miles of pipe (1.87 million linear feet), 32.5 football fields worth of insulated piping. That’s a lot of pipe for a refinery that is not a particularly large facility, as refineries go, since it represents less than 1 percent of total U.S. refining capacity (which, according to a recent issue of Oil & Gas Journal, is 16.8 million bpd).

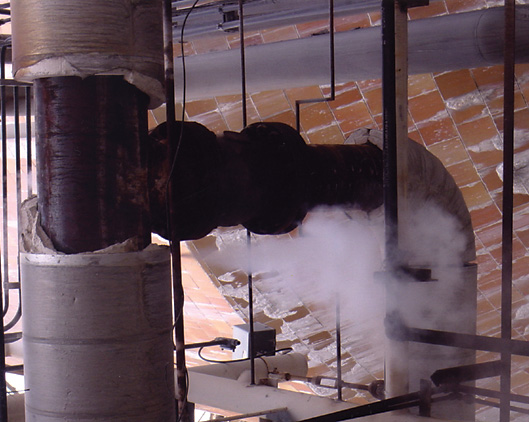
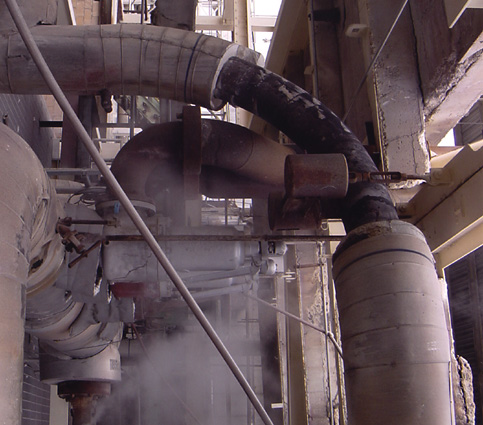
In this particular example, as presented in the NITP, the students are told that 21.3 percent of the thermal insulation was damaged. Now, we’re not certain exactly what "damaged" means in terms of the insulation thermal performance. For my estimate, I am going to assume that "damaged" means "damaged or missing." Figures 4, 5 and 7 show pictorially what pipes with damaged or missing insulation could look like at an oil refinery or a petrochemical plant.

For the purposes of an engineering heat loss analysis, I am going to make several assumptions:

  • Average pipe temperature is 600 F.

  • Average ambient temperature is 60 F.

  • Average wind speed is 5 mph.

  • Average pipe size is 8-inch NPS.

  • Insulation type is ASTM C547, Type I mineral fiber pipe insulation.

  • Refinery fuel is a petroleum distillate with an energy content of 140,000 Btu per gallon, or about 6 million Btu per barrel.

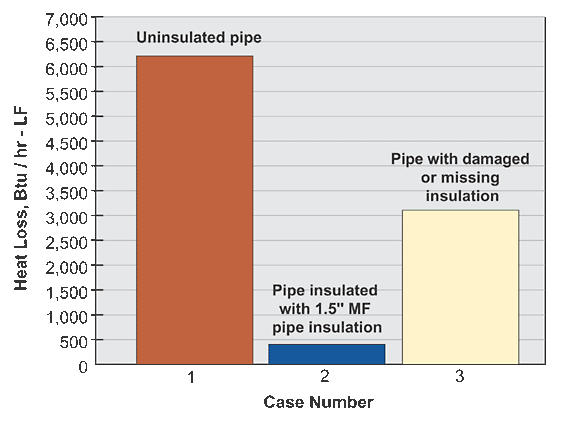
Using the 3E Plus computer program, I estimated the following heat losses from both the bare and the insulated pipe, shown on as the first two bars on Figure 6.

It would probably be reasonable to also assume that the "damaged" insulation insulates somewhat, although not well, so that the heat loss from the pipe with this "damaged" insulation is not as high as from a bare pipe. Combined with the missing insulation, then, I further assumed that damaged or missing insulation loses about one-half of the heat loss from the bare pipe. I have shown this as the right-hand bar in Figure 6. Note that the heat loss from the insulated pipe is much less, maybe by 88 percent or so, than the heat loss from the same pipe with damaged or missing insulation.

Using this approach, I estimated the excess heat loss, resulting from 21.3 percent of the 1.87 million linear feet of insulated pipe having damaged or missing insulation. For the 400,000 linear feet of pipe with damaged or missing insulation, that extra heat loss works out to be 1,080 million Btu per hour. Multiplying by 24 hours in a day, this is the equivalent of almost 26 billion Btu per day. In summary, that’s the additional energy loss due to the fact that 21.3 percent of the insulation is damaged or missing and has not been repaired, replaced or reinsulated.

You may be wondering: Is 26 billion Btu per day a lot of heat energy to waste due to thermal inefficiencies resulting from damaged or missing insulation? Is this a big deal or not?

Well, with an energy content of about 6 million Btu per barrel of oil and assuming nominal 75 percent combustion efficiency, this 26 billion Btu per day is the energy equivalent of about 5,800 bpd of crude oil that is being wasted at this one refinery.

How significant is 5,800 bpd of equivalent crude oil consumption, wasted due to excess heat loss through the damaged or missing insulation, for a 125,000 bpd oil refinery? Well, 5,800 bpd of extra equivalent oil consumption represents 4.6 percent of the plant’s total gross refining capacity! Therefore, this wasted energy, in the form of wasted oil, is very significant.

These are a lot of numbers to juggle around. Let’s step back for a moment to take stock of what we have just determined for this relatively small oil refinery and its thermal insulation. On average, we have a refinery that has the equivalent of 400,000 linear feet of 8-inch NPS pipe with damaged or missing 1.5-inch-thick insulation, and this represents 21.3 percent of the original total insulation. If this insulation remains damaged and unrepaired or unreplaced for a one-year time period, excess heat loss, and hence wasted crude oil equivalent, is spent keeping these pipes hot. The extra energy needed is 5,800 bpd of crude oil. For a year, this works out to 1.6 million barrels of wasted oil at this one refinery.

Now, it would be reasonable if you were to say to yourself as you read this, "That’s ridiculous! No maintenance manager at an oil refinery would ever let this happen. He’d walk around his plant and become furious with his maintenance staff for all this damaged or missing insulation, which would be obvious to the naked eye. Then he’d immediately budget the necessary millions of dollars to repair or replace it during the next maintenance outage. He’d take care of his insulation problem as fast as he could. There’s no way he’d simply throw away 5,800 barrels of oil every day!"

Well, maybe so, and maybe not.

Incidentally, at an average price of $42 per barrel, that wasted heat would represent over $67 million worth of equivalent crude oil in one year, at this one refinery. Now, I don’t know what your company might consider to be significant. To my company, however, this is starting to look like some real money.

Analysis for the Entire United States

What could this mean for the United States as a whole? According to the December 26, 2004, issue of Oil & Gas Journal, the total U.S. oil refinery input production, for the week before December 12, 2004, was 16,792,000 bpd. Our example plant represents only 0.74 percent of this total. If I assume that all U.S. oil refineries, based on this capacity, had this same percentage of damaged insulation, namely 21.3 percent, under these same thermal conditions, then I can get a ballpark estimate of the total amount of wasted equivalent crude oil, resulting from excess heat loss through those surfaces with damaged or missing thermal insulation.

I did this, and my estimate worked out to be 585,000 bpd of equivalent crude oil wasted, for all U.S. refineries, due to damaged or missing insulation.

For the nation as a whole, this is enormous. At the 2004 rate of consumption, Americans consumed about 20.4 million bpd of oil. I have just estimated that about 585,000 bpd of this total, or 2.89 percent of average U.S. crude oil consumption in 2004, resulted from excess energy lost through damaged or missing mechanical insulation at American oil refineries.

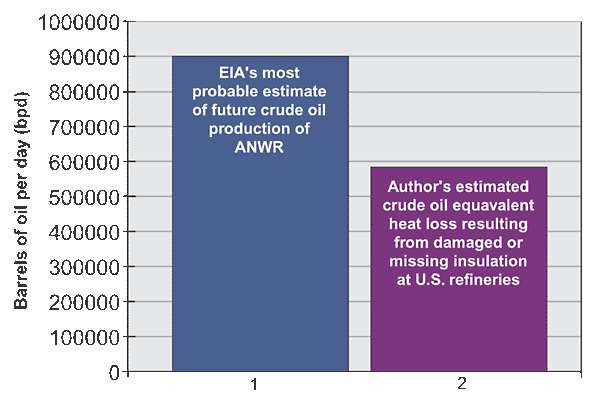
Let me put it into a different perspective by asking, is 585,000 bpd a lot of energy to waste at oil refineries? Last spring, the U.S. Energy Information Administration estimated that ANWR, if and when it is opened up and developed, most likely will produce about 900,000 bpd (and that level of production might take at least 10 years to develop). This wasted energy at U.S. refineries alone, resulting from excess heat loss from pipes and equipment with damaged thermal insulation, represents nearly 65 percent of the expected future production capacity of ANWR. In my opinion, that is an enormous quantity of thermal energy to waste and an enormous quantity of crude oil to waste.

I have shown this comparison graphically in Figure 8.

Now, you may think that pipe and equipment insulation damaged or missing at a rate of 21.3 percent is a high estimate.

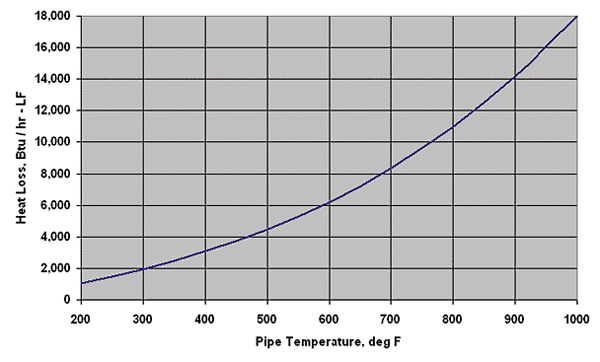
My response is that perhaps 21.3 percent is a high percentage for damaged or missing insulation and perhaps my estimate is overly conservative. On the other hand, keep in mind that I have also not considered that at oil refineries, much of the piping and equipment operates at much higher temperatures than 600 F (for example, cracking towers operate at about 950 F) and furthermore, heat loss from hot, bare surfaces (where there is missing insulation) is non-linear with temperature; it follows a power curve upward, as shown in Figure 9. You can see from the chart that heat loss from a 950 F surface is about 16,000 Btu per hour per linear foot, which is about 2.7 times the 6,000 Btu per hour per linear foot value from the 600 F pipe; so my estimate of heat losses could be non-conservatively low.

Furthermore, we know that when it rains on the damaged insulation or on the bare pipes with missing insulation, the heat loss increases dramatically due to the rain water evaporating off the hot surfaces and/or out of the hot insulation into which it has seeped (it takes at least 1,000 Btu of thermal energy to evaporate each pound, or about 2 cups, of water). Perhaps there are many refineries with more than 21.3 percent damaged or missing insulation. So, my analysis could be non-conservative. In any case, it is only an estimate to put energy waste, resulting from damaged or missing insulation, into perspective. I have done that by converting those heat losses into units of barrels of crude oil equivalent and compared that to our annual national consumption. As my analysis has shown, this waste can be significant.

Making the Public Aware of Mechanical Insulation’s Role

Imagine if you were to learn many years from now, after ANWR has been developed and is producing 900,000 bpd of crude oil, that two-thirds of its production is being wasted or diverted somehow so that it never gets into the American market. You would, no doubt, be outraged. Likewise, we all should be outraged by the equivalent crude oil loss resulting from damaged or missing thermal insulation at refineries–oil that might represent 2.89 percent of the U.S. annual consumption of crude oil. As private citizens, we should be outraged. As mechanical insulation contractors, fabricators, distributors and manufacturers, however, we need to go beyond outrage. We should become determined to take action because this represents a significant business opportunity loss.

Before we take action, let’s return to this 125,000 bpd oil refinery with the equivalent of 400,000 linear feet of 8-inch pipe with damaged insulation and ask: "Approximately what would it cost to replace the damaged material?" I relied on 3E Plus again for the estimate.

Using the default values for material costs and labor costs, I calculated an installed cost of $13.67 per linear foot for the 8-inch NPS pipe with 1.5-inch thick mineral fiber pipe insulation with aluminum jacketing. Insulation material prices have increased recently and labor costs have also increased; so to be conservative I increased this calculated amount by 10 percent, which gave me an installed cost of about $15 per linear foot. I also assumed that the owner spends $5 per linear foot to remove the damaged, non-asbestos containing insulation and to dispose of it. That’s a total of about $20 per linear foot to remove and dispose the damaged insulation and then to reinsulate the pipe. With 400,000 linear feet of pipe with damaged insulation, that represents a total installed cost of about $8 million for this one refinery. Now remember that we already determined the pipes, with damaged or missing insulation, were wasting an additional $67 million of equivalent crude oil per year. So, this $8 million expenditure to replace the damaged or missing material and eliminate this energy waste would have an amazingly short payback of only 1.4 months!

The insulation replacement would definitely be cost-effective, and we in the mechanical insulation industry have become accustomed to seeing extremely short payback periods for insulating hot service pipes and equipment. Further, we would hope that any oil refinery manager would consider an $8 million investment, to reduce his energy cost by $67 million per year, to be exceedingly cost-effective. So, what’s the problem? Where are all the purchase orders for insulation repair and replacement at oil refineries?

Mechanical insulation is the "lost and forgotten technology." Too many owners and operators of oil refineries and of other industrial facilities simply don’t recognize that they have an insulation problem. They do know that at $42 per barrel, crude oil is very expensive and should be used efficiently. Furthermore, most are aware that in the long term, the price of crude oil is very likely to continue increasing. But why consider mechanical insulation? Some reason incorrectly that a little damaged or missing insulation here and there can’t be causing that many problems. Furthermore, getting budget approval for $8 million to do some insulation maintenance work isn’t always very easy–it’s still a lot of money for a single 125,000-bpd oil refinery.

All of us in the mechanical insulation industry are in this together. That’s why we belong to NIA, so that we together can promote our industry by educating the public about the effectiveness of our products and services. As we know from experience, it’s an uphill battle. We are a small industry with only about $8 billion in revenue per year. Several of the American energy giants individually do $100 to $300 billion of revenue annually. The total American oil and gas industry did nearly $1 trillion in business in 2004, or more than 100 times our industry’s annual revenue. Our industry simply looks small and insignificant compared to the oil and gas industry. In fact, we look small and insignificant compared to many other industries. The costs of our products and services are simply much less than their economic value in terms of energy savings.

In order to get more attention, and appreciation, for ourselves and for our products and services, we need to communicate more effectively with people outside of our industry, particularly the decision-makers at energy-consuming industrial facilities. There is evidence that many industrial plant owners don’t believe maintenance of their pipe and equipment insulation is of critical importance to energy efficiency. Or, their maintenance managers and employees may understand how important insulation is, but they are limited by budgets established by their management, and these budgets frequently do not represent the value of lost thermal energy from piping and equipment due to damaged or missing insulation.

To remedy this situation, we need to get more industrial facility owners and operations to take the NIA’s Insulation Energy Appraisal Program, or to at least learn how to use 3E Plus. We need to present our customers with examples of energy savings from replacing damaged insulation or insulating those pipes and equipment with missing insulation. We need our customers to come to understand that wet insulation is as ineffective as no insulation at all and that wet insulation may be the result of just a little cracked or missing jacketing joint sealants, a type of damage that may not even be that visible to the naked eye. Hence, our customers need to learn that while some insulation is obviously damaged, other damaged insulation may not even look like it’s damaged. With mechanical insulation, what you see is not always what you get.

Overall, we need to educate our customers so they address the "three As" when it comes to their mechanical insulation:

  • Awareness

  • Appreciation

  • Attention

When it comes to industrial energy efficiency, mechanical insulation is probably the most underrated and undervalued of all the systems used in a plant. We can change this misconception together by educating our customers about the benefits of our products and services, one of which is to reduce the United States’ overall consumption of crude oil and increasing reliance on imported crude oil. Our industry is already making a huge difference, but there is enormous potential for additional improvement. With your effort, we will make a greater difference now and in years to come.

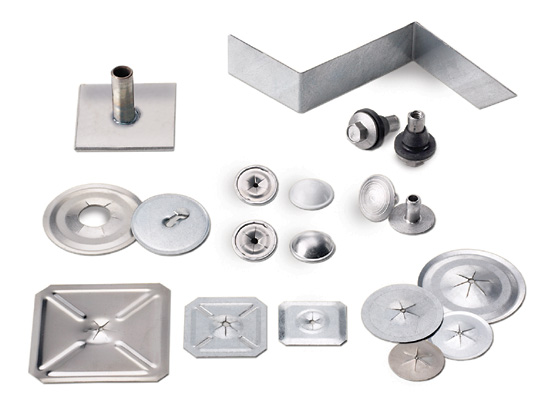
Figure 1
Figure 2

Table 1. Oil consumption, imports and exports.

Figure 3

Number of barrels of oil equivalent saved per year using 1.0 square foot of 4-inch-thick mineral fiber insulation on a 600 F surface.

Figure 4

Missing and damaged insulation and jacketing on a valve and connecting piping.

Figure 5

Missing insulation in and around a T connection.

Figure 6

Estimated heat loss from a 600 F, 8-inch NPS pipe for three cases: uninsulated, insulated with 1.5 inches of ASTM C547, Type 1 mineral fiber pipe insulation, and with damaged or missing insulation.

Figure 7

Missing insulation on a pipe bend.

Figure 8

Comparison between future production of ANWR and estimated wasted energy resulting from damaged or missing insulation at U.S. refineries, in bpd of crude oil equivalent.

Figure 9

Heat Loss from an uninsulated 8-inch NPS pipe for different pipe temperatures, up to 1,000 F.

Editor’s Note – This article is an excerpt from "Progress Report on Sustainability" first published by Building Design & Construction in November 2004. Copyright 2004 Reed Business Information. All rights reserved.

2004 was a remarkable year for the green-building movement. It witnessed the birth of three new entities in the U.S Green Building Council’s Leadership in Energy and Environmental Design program. In addition to LEED for New Construction (NC), which has been in place for four years, 2004 has seen the launch of LEED for Existing Buildings (EB) and Commercial Interiors (CI), with yet a fourth program, LEED for Core & Shell (CS), well into the pilot phase. The successful development of these complex green-rating systems is a tribute to the hard work of their respective committees and the USGBC leadership.

LEED for Existing Buildings

The pilot program for LEED-EB was launched in January 2002, with 99 projects representing 31.5 million square feet of space taking part. Since then, nine projects have been certified, and on October 22, 2004, the balloted version was released.

The first thing to keep in mind about LEED-EB is that 75 percent or more of the lifetime costs of a building go into operations and maintenance. Existing buildings (including homes) consume nearly 40 percent of the nation’s energy; add 40 percent to its atmospheric emissions; consume 68 percent of its electricity, 12 percent of its fresh water, and 88 percent of its potable water; account for 40 percent of municipal solid waste; and use 40 percent of all wood and raw materials in U.S. construction.

The other thing to remember is that there are nearly 100 times as many existing commercial, industrial and institutional buildings than are built every year. Theoretically, then, greening existing buildings could have a couple of orders of magnitude greater impact on energy consumption and the environment than could be achieved greening new buildings.

That’s why LEED-EB is aimed chiefly at upgrading the operations and maintenance aspects of buildings. Thus, LEED-EB provides a way to recertify buildings that were first certified under either LEED-NC or LEED-EB. It also requires that buildings that have not been certified under LEED-NC be at least two years old before they can register with the program.

Many credits in LEED-EB emulate those in LEED-NC, but the key difference is EB’s emphasis on operations and maintenance. For example, a project can earn a point for each 30 percent of annual purchases of cleaning products that meet various green standards, such as Green Seal GS-37 (MR Credits 4.1-4.3). In fact, says EB Committee Chair Michael Arny, there are a number of "low-cost" points available for cleaning and maintenance materials. "A lot of what’s involved in operating a building in a sustainable way is not about capital expenditures, it’s about paying attention to procedures and purchases," he says.

LEED-EB could draw a whole new set of players to green building–facility managers. As companies begin to grasp the economic and environmental impact of their buildings (usually a firm’s biggest capital asset), senior management will start to see the value of having facility managers who are skilled in green building. Arny predicts that, in a few years, facility managers will make up the majority of those involved in green building and the USGBC.

LEED for Commercial Interiors

LEED-CI is intended for organizations that want to "green" their tenant space or commercial interiors. So, a law firm with two floors in an office building, or a retail store in a shopping mall, might fit out its space according to LEED-CI. It can be applied to new buildings, old buildings or buildings where tenants are remodeling. Since LEED-CI is devoted to tenant interior fit-outs, some credits found in other LEED programs, such as reducing water usage for irrigation, are not relevant. More than 90 projects, comprising 6.47 million square feet of space, participated in the pilot program, with 16 earning various levels of certification.

LEED-CI targets the selection of sustainable tenant space, efficient water usage by tenants, optimized energy performance (especially lighting and lighting controls), materials for interior building systems and furnishings (notably furniture, carpet and flooring), and indoor environmental quality (with an emphasis on controlling VOCs).

LEED-CI seems to have attracted a new cohort of LEED users. According to interior designer Keith Winn, project manager for LEED-CI, about 70 percent of the 90 or so projects in the LEED-CI pilot program were first-time users of LEED. These included construction, architectural/engineering and mechanical/engineering firms that were applying LEED-CI to their own buildings. "It’s not something we anticipated," he says. Building product manufacturers–makers of carpets, furniture, mechanical equipment, etc.–constituted another group. A third category included retail operations like Whole Foods, Kinko’s, Bank of America and Enterprise Rent-A-Car, which, according to Winn, might have been giving LEED-CI a tryout to see if it fit into their respective corporate values.

The committee was also surprised, after careful review of more than 20 submittals, at the wide disparity among engineering firms in their knowledge and understanding of ASHRAE standards for energy and indoor environmental quality. "They just haven’t had a lot of experience with [ASHRAE]," says Winn. "Maybe it’s not a requirement on their [non-LEED] projects, so they’re not up to date with what’s required or how to document it. That was an eye-opener."

LEED-CI also reflects the growing interest in "New Urbanism." SS Credit 2, formerly known as "Development Density," was renamed "Urban Redevelopment" to encourage tenants to select space in established, "walkable" communities or in neighborhoods with pedestrian access to at least 10 of 20 identified "basic services": banks, grocery stores, daycare centers, post offices, schools, hair salons, etc.

LEED-CI Chair Penny S. Bonda says the committee started out five years ago with hopes of making some fairly radical changes in LEED, including greater emphasis on life-cycle analysis and performance standards. "We were going to change the world," she says. But reality stepped in, and the committee had to pull back from its ambitious agenda, pending approval of revisions to the basic LEED format anticipated in LEED 2.2 and 3.0. "LEED walks a fine line between being doable and being not doable," she says. "You want to raise the bar, but you don’t want to make it so difficult that people just give up." Given the success of the LEED-CI program thus far, that prospect seems unlikely.

LEED for Core & Shell

LEED-CS addresses the design and construction of the core and shell of new buildings, essentially the structure, envelope and building-level systems, such as central HVAC–in effect, everything that LEED-CI does not take in. LEED-CS primarily serves developers of speculative office, retail or mixed-use buildings and is designed for buildings where the owner does not control the interior design and fit-out. Most of the credits for LEED-CS follow closely those for LEED for New Construction.

The big breakthrough with LEED-CS is its pre-certification process. Pre-certification, which is unique to LEED-CS among all LEED programs, allows a developer to market a building as if it were LEED certified before the building is even built.

The rationale behind pre-certification rests on the assumption that, in most cases, the developer of a speculative core-and-shell building won’t even start construction until a major portion of the planned building is leased. Thus, it does the developer little good to wait until after the building has been built to obtain LEED certification: The developer needs to be certain that the building will, in fact, be rated at a specific level (Certified, Silver, Gold or Platinum) upon completion in order to go out and market the project as if it were already built to LEED standards.

The pre-certification process overcomes this barrier by allowing the developer to submit to the USGBC a "scorecard" showing the credits the building will achieve, based on its design. If the USGBC approves the developer’s plan, it will issue a "pre-certification document" that states, in effect, "If the building is constructed as described in this document, it will be certified (at such-and-such level) upon completion." Armed with this pre-certification document, the developer can then start leasing space in a green building, albeit one that exists only on paper.

The LEED-CS pilot got under way in 2003, with more than 30 buildings-three of them in China–ranging in size from 5,000 square feet to one million square feet. The projects include speculative office buildings, retail centers, and mixed-use facilities combining retail, parking and residential.

One of the most nettlesome aspects of this particular program is figuring out where LEED-CS stops and LEED-CI takes over. In the simplest terms, LEED-CS is supposed to cover physical aspects of the building that the developer or owner control; everything else is supposed to be the tenants’ responsibility. From the feedback of building teams in the pilot program, however, it’s not always easy to draw the line between the two.

LEED-CS’s "Tenant Design & Construction Guidelines" (SS Credit 9) is intended to "provide tenants with a descriptive tool that both educates and helps them implement sustainable design and construction features in their tenant improvement build-out." The guidelines are supposed to help tenants adopt green building practices in their build-outs and "help in coordinating LEED-CI and LEED-CS certifications."

To accomplish this, developers and owners of LEED-CS projects are encouraged to publish an "illustrated document" for tenants that:

  • Provides a description of the green design and construction features in the core and shell of the building, the various LEED-CS credits that were achieved, how they were earned, and how these credits contribute to the building’s greenness.

  • Enables tenants to coordinate their space build-outs with the core-and-shell building’s systems and materials.

  • Incorporates "user-friendly recommendations," including examples and strategies, as well as suggestions for which products and services to use.

There has been limited experience with this credit so far. In one case, a tenant worked with the building team on choices for materials and finishes for the core and shell and used the same materials and finishes in its build-out. But there is a certain degree of risk to developers in prescribing too much in their tenant guidelines, lest it turn off prospective lessees. It remains to be seen how the dynamic between core-and-shell developers and their tenants plays itself out. If the experience of other LEED programs is any barometer, it will take at least another year or so before all the kinks in LEED-CS are worked out.

More on LEED

The full text of this report, as well as the 2003 "White Paper on Sustainability" covering LEED-NC, are available free of charge at www.bdcmag.com.

Figure 1
Figure 2

Insulation systems–from low-density polymeric foams to medium density fiberglass to high-density calcium silicate–all share a common function. There are many disparate reasons to use insulation; they range from keeping your house warm in the winter and cool in the summer to controlling the noise levels in a commercial airliner. But despite the seeming differences, they share one purpose: resistance to the flow of energy. In the vast majority of cases, insulation is used to control the flow of thermal energy, usually called heat, into or out of whatever is insulated. Heat transfer is the term applied to the movement of heat from one place to another; this is a discussion of its fundamentals.

Any discussion of heat transfer must start with a definition of the second law of thermodynamics. Stated simply, the second law requires that energy always flows spontaneously from high to low. In the case of heat, energy always flows from hot to cold. All insulation designs and all heat transfer systems are grounded in this fundamental law of nature. The purpose of insulation is to resist the flow of energy that comes about as a result of the second law. Where does temperature fit into this discussion?

Temperature is just a measure of the amount of thermal energy contained in a substance. There are different measurement scales that relate temperature to different physical phenomena, such as the freezing point of water (0 C), but, regardless of the basis of the scale, they still just indicate the amount of heat energy present in the substance being measured. The zero point of the Kelvin scale is called absolute zero, and it is the lowest possible temperature. At absolute zero the atoms of which all matter is composed contain no thermal energy and are motionless with respect to adjacent atoms.

There are three distinct ways in which heat is transferred from one location to another, and each is based on a distinct characteristic of matter. The first is conduction; the second is convection, and the last is radiation. Conduction is the transfer of heat energy between two bodies as a result of direct physical contact. When a coffeepot is placed on the hot burner of a stove, heat is conducted from the burner to the pot.

How does this happen? In the case of a stainless steel coffeepot, its atoms are mostly iron and are arranged in a specific crystalline pattern. Let’s assume that the coffee pot was at 0 K, absolute zero, when it was placed on the stove. If you could see the atoms of the pot, you would observe that they were not vibrating before you placed the pot on the stove. The atoms of the stove are at a higher temperature, and you would see that instead of being stationary they are vibrating. As soon as the pot touches the stove, the vibrating stove atoms start to collide with the stationary pot atoms, causing them to vibrate as well. These collisions are a transfer of energy from the hot atoms to the cold atoms. As the pot atoms vibrate, they transfer energy to their neighbors, which also start to vibrate. Over time more collisions occur between the hot atoms of the stove and the cold pot, resulting in increasing vibration of the pot atoms. This ever-increasing vibration is an increase in the thermal energy of the pot and would be measured as an increase in its temperature. If insulation was placed between the pot and the stove, the hot atoms couldn’t bump into the cold atoms and no heat transfer would take place.

All materials have a unique ability to conduct heat, and that ability is expressed as a material constant called the thermal conductivity. Metals as a class of materials are the best conductors of heat, though within the metals family some are better conductors, than others. Copper is a very good heat conductor, which is one of the reasons it ends up on the bottom of many cooking pots. Ceramics and polymers are in general not very good conductors, and this is why they are used to manufacture thermal insulation.

Heat transfer by convection occurs in fluids, either liquid or gas, and results from the motion and interaction of hot and cold fluids. In a liquid or gas the atoms are not locked in position as they are in a solid like the coffeepot; rather, they are free to move around or flow. As the amount of thermal energy in the fluid is increased, the motion of its atoms increases. This causes the average distance between atoms to increase; in other words, the density of the fluid decreases. When fluids of different density are mixed, the denser substance sinks and the less dense substance rises. Hot-air balloons float because the hot air in the balloons is less dense than the cool air outside the balloons.

Let’s apply these principles to the convective heat transfer that occurs in the coffeepot. As the bottom of the pot gets hot, the rate of atomic vibration increases and the atoms on the inside of the pot in contact with the water start to vibrate. Of course, if this illustration were real, the water would be frozen, a minor detail we’ll ignore for the sake of discussion. The vibrating pot atoms collide with the water molecules and transfer heat energy by conduction. As more energy is transferred into the water, it becomes warmer and less dense near the bottom of the pot. The warm water rises and is replaced by cold water that flows into the volume that was occupied by the warm water. The movement of warm water transfers heat from low to high in the pot and is an example of natural convective heat transfer. Insulation controls convective heat transfer by isolating the insulated surface from contact with the moving fluid.

The third method of heat transfer is radiation. So far we have described thermal energy as being the vibration of atoms–the kinetic energy model. It works well when describing conduction and convection, but it falls short when it comes to radiation. All matter–solid, liquid or gas–constantly exchanges thermal energy in the form of electromagnetic radiation (EMR), or light, with its surroundings. If a body is at higher temperature than its surroundings, it emits EMR. If it is at a lower temperature, it absorbs EMR. If the body is at constant temperature the amount of energy it radiates must equal the amount it absorbs; if not, its temperature would change. You will notice this sounds just like the second law of thermodynamics mentioned earlier.

Since the physics of EMR is complex, we’ll limit our discussion to its effects; but there are a few facts about EMR we need to understand. EMR moves in uniformly shaped waves, and its color and energy content depend on wavelength. Wavelength is defined as the distance between identical locations on two adjacent waves; the longer the wavelength, the less energetic the light. As an object gets hotter, its EMR becomes more energetic and its wavelength gets shorter; if it gets sufficiently hot, the radiated light reaches the visible part of the spectrum. To illustrate this effect, consider a piece of steel: At room temperature, it emits no visible light. Now we apply a torch to it, and as the metal warms, it starts to emit visible light, first a deep red that can only be seen in the dark. With rising temperature the color changes from deep red to a brighter orange and finally to a brilliant yellow. This change in color is the result of the increasing energy of the emitted light and its resulting shorter wavelength. Again, the second law of thermodynamics is in play; the hot metal is at a higher energy state than the surrounding environment; so it spontaneously emits EMR in the form of visible light.

You may have noticed I have repeatedly described the spontaneous radiation of EMR from an object as emission. I have used this term because it naturally leads to an important property of all materials called emissivity. Just as conductivity is a unique material property that is a measure of a material’s ability to conduct heat, so is emissivity a measure of a material’s ability to transfer heat by emitting EMR.

A material that is a perfect emitter, that is, it can emit 100 percent of the energy that is available for emission, has an emissivity of 1.0 and is called an ideal blackbody. No material is a perfect blackbody, just as no material is a perfect conductor. Emissivity is defined as the ratio of the actual energy emitted by a surface to the energy emitted by a blackbody. Since nothing in nature is an ideal blackbody, emissivity is always less than 1.0 and is a function of the material and the condition of its surface. A metal surface that is painted black has an emissivity close to 1.0 while the same metal polished to a mirror finish has an emissivity closer to 0.1.

Emission is only half the story of radiation heat transfer; the other half is absorption. I started this discussion by saying that all objects constantly exchange thermal energy with their surroundings. For an object to remain at constant temperature, it must absorb as much energy as it emits. Absorptivity is the absorption counterpart of emissivity. The physicist Gustav Kirchhoff created the concept of the blackbody while studying light. He defined an ideal blackbody as a body that absorbs all incident radiation. The absorbing power of an ideal blackbody is 1.0 and it is less than 1.0 for all other surfaces.

Absorption and emission must always exist together when temperature is constant. When one is greater than the other, temperatures change and there is a net heat transfer. I have always found it difficult to understand how a very absorbent surface could also be a high emitter. We have all experienced black surfaces that get very hot in the summer sun. The natural and correct conclusion is that black is a very good energy absorber, that is probably why Kirchhoff thought to name his perfect absorber a blackbody.

But, if a black surface is such a good absorber, how can it also be a good emitter? The key to understanding this intuitive contradiction lies in the need for equilibrium. If you park your black car in the sun in July, its surface gets very hot because it is a good absorber. If it were not also equally good at radiating heat, its energy content would continue to rise as long as it was in the sun. If this could happen, its temperature would continue to rise without limit. Obviously this doesn’t happen; so when the car reaches a constant temperature it must be radiating as much energy as it is absorbing. Since it’s absorbing a lot of energy, it must also be radiating an equally large amount, which leads to the conclusion that this good absorber must also be a good emitter.

We have now seen that heat transfer occurs in three ways: conduction, convection and radiation. Each process is unique and relatively easy to understand when you boil it down to its basic physical principles. To go further than I have in this column requires some pretty interesting mathematics. All three types of heat transfer can be completely described by equations that are the basis for computer programs like 3E Plus® and the sophisticated finite element heat transfer modeling software that is in common use today.

Finally, now that you understand the fundamentals of heat transfer, you are equipped to understand how any insulation system works. The next time you look at an insulated system, ask yourself where the heat is coming from, where it wants to go and how the insulation interferes with that transfer. If you see the answer, you understand the fundamentals of heat transfer and all the rest you need to know is in the details.

Figure 1

Nationwide, there have been a number of changes to the requirements for complying with commercial energy codes. Chances are, there could be new requirements in your state. The commercial energy code map indicates that the 2003 IECC and ASHRAE 90.1 codes are gaining momentum, as more states begin to comply with federal mandate of 1992 Energy Policy Act. The act requires all states to have an energy policy to meet or exceed ASHRAE 90.1 to reduce energy usage.

As the map on page 19 demonstrates, it is not easy to answer the question of what insulation thickness is needed for energy code compliance. It’s important to ask the energy code questions before starting the project.

It’s also important to consult ASHRAE tables such as the ones excerpted in this article. These show what a qualified person needs to determine the necessary thickness for energy code compliance. Many variables need to be defined prior to determining the insulation thickness required.

For instance, let’s look at Table 6.2.4.1.3. To determine the minimum pipe insulation thicknesses needed for 3-inch IPS pipe operating at 300 F, select the temperature from the far left column; select the pipe diameter from a column in the nominal pipe area. In this example, an insulation that has thermal conductivity in the range of 0.29 to 0.32 at 200 F mean temperature would be applicable. To meet the energy code requirement, you would need a minimum pipe insulation thickness of 3 inches.

Another variable is the climate zone. Tables 6.2.4.2A and 6.2.4.2B reference heating HDD65–heating degree-day 65 F. This refers to a daily mean temperature of less than 65 F. Each degree of mean temperature below 65 F counts as one heating degree-day. Annual heating degree-days are the sum of the degree-days over a calendar year.

Other Resources

The Building Codes Assistance Project (BCAP) provides assistance on building energy code adoption and implementation. The organization assists state and local regulatory and legislative bodies and help coordinate others representing environmental interests, consumers, labor and industry. BCAP can help states that request assistance, and because it is funded by the U.S. Department of Energy, its services are available at no cost.

BCAP was established in 1994 as a joint initiative of the Alliance to Save Energy, the American Council for an Energy-Efficient Economy and the Natural Resources Defense Council. As part of its outreach, BCAP produces a free bimonthly newsletter on the status of state energy codes, and maintains a website at www.bcap-energy.org. Resources available on the website include up-to-date information on state code activity, maps showing code adoption on a national level, as well as a listing of training opportunities and events on both the national and state levels.

Download TABLE 6.2.4.2A  PDF

Download TABLE 6.2.4.2B  PDF


Web Resources

The following websites contain important updates on energy codes.

Figure 1
Figure 2

How can industrial energy users combat increased energy demand–and skyrocketing prices? What role can insulation play in energy efficiency? To find out, Insulation Outlook interviewed Neal Elliott, industrial program director for the American Council for an Energy-Efficient Economy (ACEEE), and an internationally recognized expert and author on industrial energy efficiency. Here, he shares some of his insights.

What current trends is the ACEEE tracking with regard to energy efficiency?

The most important issue we see right now is the current increase in energy prices, coupled with the high degree of volatility in the market today. We’re fundamentally in a period of transition in terms of energy markets, with respect to both natural gas and oil. This country is moving from a period of relatively plentiful supply to a period in which we’re essentially going to see demand constrained by available supplies of energy, and this in turn is going to drive up the prices of other energy sources, such as electricity.

How do the trends in natural gas and oil markets affect the commercial and industrial sectors?

It’s interesting. The impacts are pretty much across the board on manufacturers. Groups such as the chemical industry–an important consumer of oil and natural gas as well as electricity–use oil and gas as both an energy source and a feedstock for their product; so it might affect them disproportionately over some of the other sectors. Another sector we have seen be hit exceedingly hard has been the agricultural fertilizer and chemical manufacturers, in particular fertilizer. As a result of the high natural gas prices, we’ve seen about 25 percent of the domestic production go overseas.

What the energy price marketplace is doing is fundamentally changing some of our domestic industries. It’s making them less competitive in the global marketplace, tending to make them more domestically focused and emphasizing the need for them to look at things like stability, customer service and other things like that to retain competitors in that market. The impacts extend across the board, to sectors such as glass manufacturers, even the wood products industry.

There are also some other surprising things that have occurred. One is the dramatic increase in natural gas consumption by the oil refining industry. This has resulted in a large part because of tight crude markets and a high demand for refined products, especially gasoline. Because crude has been difficult to get, many refiners are willing to buy natural gas, and use that to run their plant, so that they can turn a higher percentage of the barrel of crude that they buy into a saleable product. They’re willing to pay a premium price for the natural gas because they’re getting a pretty high premium for their refined product.

How can American industry survive the current energy crisis without going overseas?

There are a couple of things they need to do. One of the first things is to look at being as efficient as they possibly can. That is imperative for an industrial consumer–that they get the maximum benefit out of every dollar they spend, and try to squeeze as much as they can. Eliminate waste. Invest more money in plant audits, new equipment, new insulation and better motors. No single thing will make them more competitive, but efficiency is a key element. The other thing is looking at the energy choices the company is making, in a risk-management, investment portfolio perspective.

Increasingly, people are starting to look at energy-efficiency investments as well as a diversification of energy resources. Among the things that make economic sense in this kind of a price environment is renewable energy. We now have, for example, Dow Chemical looking into putting wind energy into a facility on the Gulf. It’s cheaper for them to generate their own electricity through wind than to buy it from the utility company. They actually generate a lot of their own power through combined heat and power/co-generation.

People often think of combined heat and power as an electric power technology. It’s not. It is a steam technology. It replaces an industrial boiler. As a result, for a small marginal investment in fuel, you get electricity as a byproduct of steam production.

What energy-efficient options are available for those in the industrial levels that are trying to cut costs?

The first is, as Tom Casten with Primary Energy points out, to go look for the $20 bills on the floor–the low-laying fruit. There’s a lot of rotting fruit lying on the ground. Companies who are out in the forefront in terms of their energy efficiency–like Alcoa, Dow and DuPont–are going out looking for efficiency opportunities in their own manufacturing facilities, and they’re not having any problem finding them. Many of these opportunities are very low-cost.

Alcoa has an interesting chart from when they surveyed their opportunities. They fall into two categories. There’s one set of opportunities, which has an average payback time of six to eight months. Then there’s another group that has an average payback of three to four years. In the short-term a lot of it was elimination of waste, operational changes and making small investments, especially in control technology. That’s where the energy is going, to the process. Companies want to target their efforts so that they know just where the energy is going, so that they’re using the right amount of energy in the process.

If you look at the longer term, this is where you see the majority of capital investments. You’re buying a new piece of production equipment; you’re revamping a production process. Those are the types of things you don’t do on an ongoing basis, but you factor them into your planning process down the road.

When you do the plant modernization process, in many cases, you’re investing in new equipment. You want to take that extra 1, 2, 5 or 10 percent investment and make it there because at that point the energy savings from incrementally investing in better equipment is likely to pay back well.

What are the three most important things that industrial users can do to improve energy efficiency?

First, know where your energy is going. If you don’t know what your energy expenditures are and what they’re going for, you can’t manage them. Second, look for those big-cost, high-energy-use processes, with an eye to eliminating any waste that you can from the system. And third, empower your employees. They know where the energy is, and in many cases they’re your best resource in terms of identifying how to make energy efficiency more important and actually translating opportunities into actual cost savings.

If plants/facilities stand to gain so much from energy efficiency, what’s stopping them from making the investment?

That is a complex issue. A number of things contribute to it. The first is that it’s not always clear in most firms that energy efficiency/management is anybody’s job. If there’s nobody accountable, it’s unlikely it’s going to get any attention. The second challenge is that most plant managers and corporate managers think that energy efficiency is something that costs a lot of money. In a capital-constrained environment, and probably even more importantly, in a labor-constrained environment, you’re going to hear, "Let’s not go look at that because we don’t have time to look at energy efficiency, and even if we found an opportunity, we can’t afford it because it’s too expensive."

In short, people don’t even look for it.

What is ACEEE’s role in helping companies to overcome these obstacles and improve energy efficiency?

ACEEE is a think-tank. Our goal is not so much trying to help the individual companies or plants, and is more structured on trying to get the infrastructure in place at the local level so there’s somebody down there who can help the industrial firm. We spend a lot of time working trying to refine the programs that are being offered by state energy offices, electric utilities and regional economic development agencies. These are programs such as the manufacturing extension partnership, the Department of Commerce and industrial assessment centers across country run that are run by the U.S. Department of Energy at major engineering universities.

Many people have said that what we need to do is to train the industrial plant operators to find energy efficiency. I don’t think that’s really the problem. I think the problem is really giving them the time to go find it. Here’s a good example. We do a lot of work with electric motor systems. I think this is indicative of a trend: In the late 1980s, the leading cause of motor failure in the petrochemical industry was over-lubrication of motors. By the late 1990s the leading cause of motor failure was under-lubrication of bearings in electric motors. What happened during that intervening period was a wringing-out of any excess in engineering and maintenance staffs. It’s the first thing you do: You try to squeeze your labor budget and you eliminate anything that’s perceived as nonessential. The bottom line is that means people just don’t have the time anymore to look for these opportunities.

One of the trends we’ve seen over the last six to eight years is that as energy issues have become more important, we’ve seen an increase in activity, but no increase in staffing levels working on the energy management area. So who’s doing this? Companies aren’t doing it with internal staff. There are two groups that have gotten in to the market. One is the vendor: Groups like motor service companies, who used to be rewind shops, are now providing engineering services. The other group is engineering firms, which traditionally have been brought in for special projects but who are now doing more operational-type projects, and in some cases are coming in and doing projects in the plants on an ongoing basis.

The trend continues to grow. We’re finding that energy management is often outsourced. This has been really important to many of the vendors because it has allowed them to move beyond just being a commodity provider. Now they’re becoming the value-added resellers, and in many cases it’s the value-added part that becomes more important to the customer than the equipment itself.

This provides a very interesting opportunity for the insulation industry as well. Many insulation companies are specialty companies; so they tend to be very tightly tied to providing a fairly high-value product to a customer. But going in and providing that extra-added service might be an interesting strategic market decision that may be worth considering.

Given the trends, what does ACEEE surmise in regards the future of domestic industry?

We think the manufacturing sector in the United States will continue to be an important part of our economy, perhaps less export-focused and more domestically focused than it was two decades ago or maybe even a decade ago, but still it’s going to remain a major part of the economy. It’s just going to take creativity on the part of the industrial companies, and the service industry that supports them, to make sure they remain competitive in the marketplace.

Some companies are small and might not be able to afford a big investment; others are large and obstinate to change. What type and size of companies is best fit for making energy-efficient changes?

ACEEE looks a lot at this question, and we’ve done a fair amount of work studying this. We’ve come to appreciate that there are probably three categories of company sizes. There are the very large companies, the Dows and DuPonts of the world. By and large, most in this category can take care of themselves.

The really small companies of about 100 kilowatts of demand, with 10 to 20 employees, fall into two categories. Either they’ve already figured this out and they’re doing a really good job and don’t need help, or they’re not doing a good job and unfortunately they’re so small you can’t afford to help them. That’s always been the challenge–the small guys either get it or not, and there’s not much you can do either way.

It’s the companies in the middle, the mid-size manufacturing companies, which represent the real opportunity. In general, their biggest problem is lack of staff time and expertise to identify and implement efficiency opportunities. That’s where programs can come in and make a difference–whether it be energy service guys, the vendors, or government programs such as the manufacturing extension partnership or some of the electrical utility or state energy office programs around the country. The most successful one we’ve probably seen is New York State Energy Research and Development Authority’s FlexTech program (Find out more about this program at www.nyserda.org/programs/flextech.asp).

They’ve run this program for close to 30 years. What’s made it successful is that they don’t just run the audit. They really work with the customer to identify the opportunity and provide technical assistance to figure out how to implement the opportunity. They then follow through to make sure the systems are running and provide the worker training necessary. And they do this in concert with the electric utilities, with the consulting engineering community in New York State, and with groups like the community college.

They are publicly funded programs. It varies who runs them and where they get their money. In some cases, they are federally funded programs that are augmented with state money. In some cases these are unique programs that are run by an electric utility–in some cases with their own money, other times with public benefits money.

Can you share some specific examples of potential returns on investments from companies who have made changes to become more energy-efficient?

There are almost too many to name. There are some impressive projects out there. We recently named the Rohm and Haas Inc., Deer Park Plant as a champion of Energy Efficiency in Industry. They also won an award from Texas A&M University for their energy efficiency program.
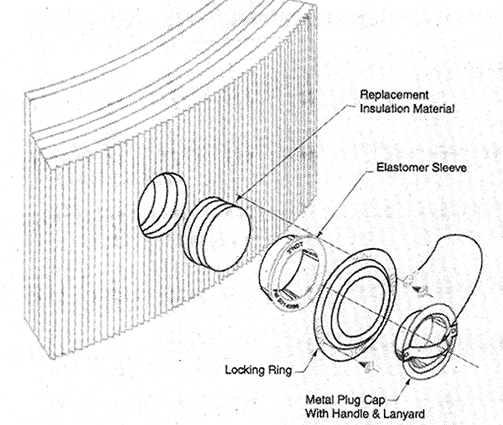
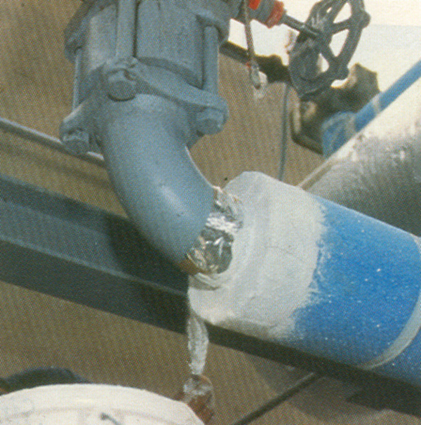
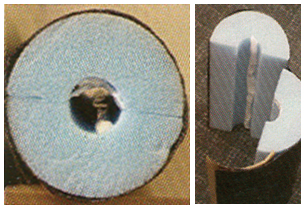
They did everything, and that’s the key. They went and looked systematically at their operation. They also looked at it from a very strategic standpoint. This is their largest plant in the United States. They looked at where their energy was going in that facility and what they were buying, and they knew from a strategic vulnerability perspective that they were tied into the electric facilities, natural gas companies and oil providers. This represented a strategic vulnerability for their company. So they looked at where the energy was being used. They looked at their steam system and they looked at combined heat and power and employed that. They also looked at where the electric loads were: compressed air. So they went through and optimized their compressed air system. They looked at their motor management practices and improved the motor management practices so they were buying the most efficient product and maintaining it in its most efficient operation.

Stonyfield Farms, which makes yogurt and other dairy products, holds a similarly impressive record. They have been attentive to these issues for many years. Once at a forum, someone asked Stonyfield’s energy manager, "You’re doing all these things that are cost-effective. When are you going to start doing the things that are not cost-effective?" The energy manager gave a blank look and said, "Well, we’re not going to do the things that aren’t cost-effective, because we’re all shareholders. There’s still plenty to do that is cost-effective." So I think it’s a question of commitment. This company made a commitment to look throughout their entire operation and to do things in a cost-effective way. In many cases, the companies who are doing the environmentally right thing are making good profits too.

One of the things we’ve seen that there are three kinds of companies, regardless of size. There are companies that are leaders. They’re already out there, doing what needs to be done. Then there are the companies that have their heads in the sand. You can’t do anything for them, either–they’re probably going to go out of business or get acquired by another company. Then there are the companies in the middle–the ones whose hearts are in the right place. They simply don’t know what to do, or, more frequently, are so fixated on trying to keep things going that they just don’t have time. Those are the ones who can be helped.

The key is, like Stonyfield and Rohm and Haas, to understand the importance of energy to your company and to the company’s bottom line. And in order to understand that, you need to look for the opportunities out there. And you don’t have to do 100 percent–you don’t have to do everything. You want to get the low-hanging fruit out there, which in turn reduces your exposure to the energy market. In the case of Rohm and Haas, they had reduced their energy purchases to such a degree that their exposure to the markets was little enough that when the energy prices went up so rapidly, they were not in the potential financial peril they may have otherwise been.

Foremost, you go after the rotting fruit on the ground. No need to go for the cherry picker–you get the easy stuff first. As you tend to find out, there’s plenty of easy stuff to find if you know where to look for it and you know how to look for it.

What kind of role does insulation have in the larger picture of energy-efficient industry, buildings, and utilities?

Insulation is a quintessential energy measure. We’ve spent too much time focusing on electric issues without paying much attention to thermal issues, whether heating or cooling. One of the important factors we need to think about is that we generate a significant amount of our thermal energy with electricity, whether it be through vapor compression, refrigeration, etc.

Insulation is always important, for reasons of operation, safety and efficiency. When you see natural gas prices more than double, oil prices almost double, and a 15 to 20 percent annual increase in electricity prices, making sure you make the right investments, making sure you have enough insulation, becomes an important measure.

When we talk about insulation, it falls into both the short-term and the long-term categories we mentioned earlier. There are opportunities out there to make strategic investments in major new insulation products. For example, there’s the guy going through the plant with an infrared thermograph gun/camera and finding a hot spot on a valve, pipe, etc.–it’s an opportunity to go out there, address the issue and slap some insulation on some neglected spots.

In many cases, the vendors play a part here in helping the customer identify the opportunity and solve it. Many of the larger insulation manufacturers servicing the larger industrial customers are playing an important role in this regard.

ACEEE has concluded that consumption of natural gas will continue to constrain supply in the near future. What is the long-term prognosis?

We are a little more optimistic in the long-term on the natural gas side. What we tend to see is that there are new options for energy supply out there, whether they be liquefied natural gas imports or new domestic sources. As a result we think we are in a period now where we are seeing exceedingly high prices for natural gas. Those prices will probably decline in the 5- to 10-year time frame. They’re never going to go back to the level we saw 10 years ago, however.

We are not so optimistic about oil prices. We see a global tightening of the oil marketplace out there, particularly being driven by China and India, the two most rapidly growing energy consumers in the world.

Both of those countries are going to be competing for oil globally. So we are potentially looking at a long-term steady increase in oil prices over the next 10 years. We are probably at a near-term peak right now, and we think it’s leveling out from there. The $30 to $34 a barrel is stable price today, and that will trend upwards to the low $40s down the road as terms of a stable price.

Because demand for oil is growing more rapidly than the ability of the market to deliver supply, we’re likely to see periods of very significant volatility. We would not be surprised to see oil spiking at $60 to $70 per barrel and then go back down. What we don’t anticipate is that it will drop back into the low $20s again.

The benefits of becoming more energy-efficient now will be manifest if not in lower energy prices, in more stable energy prices. The very tight market is causing the volatility. Energy efficiency and energy demand production are going to be critical if we are to avoid the swings in prices we’re seeing now–such as 10 percent differences in one day. This volatility makes it very difficult to plan–it has a huge impact on companies’ financial welfare. My experience is that industry can deal with stable prices. What they can’t plan for is uncertainty, and right now what we have are huge degrees of uncertainty in the market, especially in the oil market. We are seeing it increasingly in all the energy markets. You can look at oil, gas, electric and coal markets. Ultimately, they’re all tied together. And this includes markets for alternate sources of energy for the time being.

We love efficiency, but the reality is, efficiency isn’t going to solve all our problems. We need to diversify our sources of energy in this country. Different technologies emerging in the marketplace have promised to diversify the investment portfolio, and are things we should look at. These will be important in the long term.

What is the impact of the Clear Skies initiative on power plants and utility companies?

We have had some real problems with this for two particular reasons. First, it doesn’t include carbon, and we think that ultimately we will need to deal with the carbon issue. Not dealing with it now creates uncertainty in the future that is likely not good for the American economy. Second, it doesn’t give credit to efficiency. That’s a fundamental issue. It’s based largely on a concentration-based or input-based emissions standard–how much emission you get per Btu of fuel you burn. We think it should be focused not on that but on how much emission per kilowatt-hour of electricity you’re able to produce; an output-based standard.

We have had a less-close relationship with the current administration than we have had historically with administrations of both parties. On the other hand, we have a close working relationship with congressional offices and committees. We maintain very close working relationships with those offices and many state houses as well.

What is ACEEE’s most important program in place right now?

We are working with the Coalition of Industrial Consumers on natural gas legislation at the federal level. Part of the issue right now is in order for us to have a sustainable growing industrial manufacturing base in this country, we need stable gas markets. The bottom line is, we need federal intervention in this regard. Moving forward with legislation to help rebalance the natural gas markets is the most important thing we’re doing now.

Find Out More

ACEEE is a nonprofit organization dedicated to advancing energy efficient technologies and policies. For more information, visit www.aceee.org.

I have always maintained a positive view of our insulation industry and advancements it has made in the United States. Therefore, I feel the challenges we have faced in the past 50 years have opened doors to many opportunities.

Insulation, Then and Now

What a difference a half-century makes. I recently came across the first DuPont Standard Thermal Insulation Specification Handbook, published in 1948. This little 24-page handbook has a section on how to determine the economic thickness of insulation for new projects costing more than $5,000. That was a big project then. Just as the cost of projects was lower, the products themselves were not as varied. For example, this handbook indicates two insulations for cold systems and two insulation materials for hot systems. Insulation finishes were asphalt cut-back, roofing felt or cemented A cloth.

The insulation business was likewise less complicated 50 years ago. In the mid ’50s and early ’60s, the United States was in a construction phase. New industrial and commercial facilities were being built while the existing facilities constructed during the war were in disrepair. The failure rate of insulation systems increased with age and as industries became more complex.

The insulation industry had to develop better insulation systems. The Occupational Safety and Health Administration (OSHA) implemented occupational noise exposure limits. Tests indicated that insulation reduced noise levels. This created another market for insulation.

Insulation manufacturers responded to demand by developing new materials or improving their existing products. They introduced new elastomeric flexible foam insulation that was resistant to vapor moisture intrusion and easily installed. New, improved organic foam insulation found new applications. Fibrous insulation, with improved temperature limits and durability, expanded usage in the U.S. industrial and commercial markets. New cellular glass insulation with improved thermals was also introduced to the market.

Insulation Jacketing

The insulation industry needed better insulation protection from environment and mechanical abuse. Roofing felt, and the labor-intensive cement and A cloth, were not the answers. The industry introduced aluminum jacketing, which was found to be an economical way to meet these needs. Aluminum jacketing was first available in 6-mil thickness; however, this was too thin. Insulation fabricators quickly adjusted to market needs and offered heavier aluminum. Aluminum jacketing became the norm, especially for outdoor applications. Insulation contractors quickly adapted to this jacketing. This finish extended the life of insulation systems, was easy to install and made the insulation aesthetically pleasing to the owner.

The metal fabricators also developed special, laminated jacketing for noise-abatement systems. Where insulated pipe fittings were exposed to harsh conditions, aluminum and PVC fitting covers became available in the ’60s.

The food industry needed a clean-appearing jacket for insulated pipe, one that could be washed down and was environmentally safe. In the early ’80s, improved polyvinyl chloride (PVC) jacketing was developed and accepted by the FDA. Today, PVC (UV-inhibited) materials are considered acceptable in many other industries and applications.

Vapor Retarders

The failure of existing cold insulation systems and the increase of new colder processes got the attention of the insulation industry. Improved vapor retarders needed to be developed. Cold insulation systems were generally covered with asphalt cutback mastic and usually applied by hand. New vapor retarder mastics were introduced, ones that were easier to apply and were also environmentally safe. Tapes have better adhesion for application in cold weather.

In the early ’70s an all service jacket (ASJ), fiber reinforced kraft (FRK) jacket was pre-applied to pipe and equipment insulation by the insulation manufacturers and fabricators. This aided the contractor in installing the insulation and jacket in a single step.

A heavier abuse-resistant vapor retarder was needed for harsh industrial applications. Heavy rubberized composite membrane sheeting was used on building foundations and later found to be useful to cover pipe insulation. Soon after, a manufacturer developed composite membranes with improved abuse resistance and vapor retarder, specifically for the insulation industry. Polyethylene sheet material was introduced; it was easy to apply and offered excellent vapor resistance.

Soft Removable/Reusable Insulation Covers

As late as the early ’60s, valves and flanges were insulated with insulation cement (mud) and then permanent oversize pipe insulation. Chemical and petrochemical facilities in particular were producing many new hazardous products. To correct a leak or to inspect for leaks at the flanges, the insulation covering was destroyed upon removal.

Again, an industry was born to develop and fabricate soft removable/reusable insulation covers for valves and flanges.

New materials were developed to protect the covers from harsh environmental conditions. Soft-type removable covers were found useful for many other applications.

Corrosion Under Insulation

Although there was an awareness that corrosion under insulation existed in the ’50s, little was done to address the problem until the late ’60s. During this time corrosion under insulation was an accepted problem, and the leaks could be fixed by a welder. However, increased production of hazardous products and government regulations meant that any failures were unacceptable.

Most hazardous processes require stainless steel metal pipe and equipment. This metal was found to be susceptible to chloride stress corrosion cracking (CSCC).

In the early ’70s insulation manufacturers developed an improved perlite silicate insulation that could reduce the potential of CSCC. Rather than destroy the insulation system to inspect for corrosion under insulation, the industry found a better way: removable/replaceable inspection plugs in the insulation. The non-destructive testing and examination under insulation for external and internal metal corrosion with instruments prevent catastrophic failures.

Insulation contractors made a concise effort to prevent moisture intrusion into the insulation system through proper training and superior workmanship. Manufacturers introduced high-temperature silicone caulking sealants and low-temperature butyl sealants that could remain resilient for years.

Occasionally, even the best insulation system cannot prevent corrosion under harsh conditions. This is when the substrate should be coated. In the late ’90s, the National Association of Corrosion Engineers approved new coatings (paint) systems for all types of metal under insulation. However, this work required a different craft and could delay work by the insulation contractor. Now available are gel-type coatings that can be applied by the insulation contractor when the insulation is installed.

Asbestos Crises

The late ’60s and early ’70s brought about one of greatest challenges to the insulation industry. In 1970 EPA established guidelines in which asbestos was listed as hazardous.

Many insulation manufacturers had to find a suitable replacement for asbestos. By 1973 all insulation produced in the United States was asbestos-free. The same issue had to be addressed in the manufacturing of mastics and cements.

In 1986 OSHA issued a new standard for occupational exposure limits to asbestos for construction, abatement work sites and maintenance work. NIOSH, OSHA, EPA and state regulations on asbestos had to be met or exceeded. Many regulations differed in each state. In 1987, the Midwest Insulation Contractors Associations (MICA) Asbestos Abatement Committee developed a valuable guide and informational manual covering procedures and regulations for contractors offering asbestos abatement services. This guide was assigned to NIA (then NICA) for publication and national distribution.

Dealing with asbestos placed an additional burden on the insulation contractors. They had to set up a team of insulators trained in the remediation of asbestos containing materials. Around 1980, new asbestos remediation companies were born and flooded the marketplace. There was so much competition, an asbestos abatement contractor often had to bid too low–and take a loss–just to get the job. During this period the insulation industry became very complex. The small mom-and-pop insulation contractor could not compete. Many larger insulation contractors merged in order to survive.

Insulation manufacturers developed various ways to identify their asbestos-free product from the material that may have contained asbestos. There was no national guideline to identify and label asbestos or asbestos-free insulation systems. If any material remotely appeared to be asbestos-containing material (ACM), it had to be analyzed by an approved laboratory before any insulation work could proceed in that area. Insurance companies dropped coverage or raised the premiums to unreasonable levels on many insulation and asbestos abatement contractors.

In the early ’90s some contractors developed asbestos management programs. The idea was to encapsulate and identify the ACM rather than remove it. Identification of asbestos became mandatory. Because of the asbestos litigation, some insulation manufacturers and contractors filed Chapter 11 just to stay in business.

Today, schools and the workplaces are environmentally safe. However, some insulation companies continue to bear the financial scars of the asbestos crisis. The asbestos crisis did not present an opportunity to everyone in the insulation industry.

The Energy Crisis of 1973

The oil embargo of 1973-74 saw oil prices quadruple to the equivalent of $38 per barrel (adjusted for today’s dollars). There was a need to conserve energy. Energy audits became popular.

In 1976, infrared thermometry technology was offered to determine excessive heat loss in buildings. This technology was quickly utilized for evaluating heat loss on insulated pipe and equipment.

"Retrofitting" existing insulation systems became a popular term. The nesting of insulation for multi-layers to accommodate thicker insulation became the norm. Energy intensive industries began to take a serious look at their heat losses. Many energy surveys indicated that existing insulation systems were in such disrepair or lacked such a quantity of insulation that retrofitting was not an option. A completely new insulation system was required.

In 1976 the U.S. Department of Energy (DOE) set energy-reduction goals for various industries. Increasing insulation could reduce carbon dioxide and other harmful emissions. With the high cost of energy and support from the DOE, the insulation business thrived.

By 1980, fuel costs began to drop to eventually reach less than the equivalent of $20 a barrel. Again, in 2005 we are faced with this same scenario of high energy prices, with no prediction as to its end. Again, this spells opportunity for the insulation industry.

Insulation Specifications and Guidelines

There was no national, regional or even local continuity in insulation standards, specifications and guidelines. Architectural and engineering firms and some larger companies developed their own specifications. Most of these specifications were not revised on a regular basis. The specified materials were not available and application practices were obsolete.

Insulation contractors had to educate the customer when bidding on a project. This method of doing business presented problems with competitive bidding. To further complicate the situation, many new insulation products entered the market.

Some insulation contractors developed their own specifications. This approach was not always successful. Insulation systems were installed that didn’t last a year. The credibility of the insulation industry was questioned because of a few maverick insulation contractors.

In 1979 MICA developed a manual of the "National Commercial & Industrial Insulation Standards." This manual was updated several times and is available from NIA. It provides acceptable installation practices and explains in practical terms the properties of insulation products.

A manual, "Economic Thickness for Industrial Insulation," was issued in 1976. The manual was the effort of the Federal Energy Administration, assisted by members of NIA and engineers from varies industries. This manual was the forerunner of a computer program.

The North American Insulation Manufacturers Association (NAIMA) initiated the research in 1979 to develop a computer program. Today we know it as 3E Plus® 3.2. It is available from NAIMA free of charge. This program saves countless hours evaluating the economics of insulation projects.

Many insulation manufacturers provide recommended insulation thickness and installation guides for their new products.

The American Society of Testing Materials (ASTM) C16 Subcommittee on Thermal Insulation developed national standards on approved insulation materials and fabrication guidelines such as Standard C450, which is now available from ASTM on a CD.

Several years ago, committees were formed to develop overall standard guidelines for the U.S. insulation industry. The Process Industry Practices Committee on Insulation worked diligently to complete a comprehensive National Standard Specification.

Lastly, but importantly, Insulation Outlook magazine keeps the pulse on the insulation industry through technical articles, new insulation materials and companies in the news.

Safety in the Work Area: Priority Number-One

Fifty years ago there were few federal, state and local safety standards. Many commercial and industrial facilities and contracting companies did not consider safety a major issue.

In spite of this, DuPont Company, with which this author spent most of his career, was an exception. The company manufactured explosives prior to entering the chemical business. This probably explains why they always maintained strict safety training for contractors and DuPont personnel. The Occupational Safety and Health Act of 1970 and labor unions adopted many of their safety standards. By the mid-1970s, work safety rules had eliminated the most dangerous conditions. The owner was responsible for training contractors on all potential hazards unique to a site.

In 1989, the National Insulation Contractors Association developed a “Hazard Classification Guide” to comply with OSHA. This guide was to train and inform employees of hazards such as chemicals and nuisance dust in the work area. The insulation contractor employees easily adapted to these new safety standards.

All insulation work is evaluated for its degree of difficulty and safety compliance. NIA, in conjunction with the labor unions, provides instructional aids for up-to-date safety practices. Insulation contractors associated with NIA accepted this responsibility for their employees’ safety as a top priority of doing business.

Fire and Smoke Safety

In the early ’80s city and state buildings limited the kind of materials for building construction, as well as materials used in the building. Some insulation materials were limited because they did not meet certain building codes in compliance with ASTM and NFPA tests. Some insulation products manufacturers had to develop a product for use in commercial and institutional buildings. Later, smoke density became the predominate concern.

For example, the mastics industry developed a water-based mastic for hot application as well as a water-based mastic vapor retarder for cold systems. Special intumescent caulk and high-temperature insulation were developed for fire protection.

Computer Age

In the ’80s basic computers, much like those we use today, made their debut. Some individuals and companies instantly saw the advantage of computers and incorporated them into their business. Others found it to be a challenge of great proportion. However, with improved user-friendly features, computers have become an acceptable and necessary tool in doing business. Contractors can use computers to search for perspective customers, transmit project schedules, generate daily reports, control insulation material requirements with distributors and fabricators and utilize programs such as 3E Plus 3.2.

Conclusion

Because of the challenges in the past 50 years, the insulation industry is stronger and smarter. The bar was set higher, and each individual–from insulation products manufacturer to the insulator–has responded to the challenges in a positive way.

Figure 1

DuPont’s 1948 Standard Thermal Insulation Specification Handbook.
Photo credit: John Kalis

Figure 2

Acoustical insulation.
Photo credit: Knauf Insulation

Figure 3

Elastomeric flexible foam insulation.
Photo credit: Nomaco K-Flex

Figure 4

Organic foam insulation.
Photo credit: The Dow Chemical Co.

Figure 5

High-temperature fiberglass insulation.
Photo credit: Owens Corning

Figure 6

Cellular glass insulation.
Photo credit: Pittsburgh Corning Corp.

Figure 7

Aluminum jacketing.
Photo credit: Childers Products Co.

Figure 8

PVC fitting covers.
Photo credit: Proto Corp.

Figure 9

Aluminum fitting covers.
Photo credit: Childers Products Co.

Figure 10

PVC jacketing.
Photo credit: Proto Corp.

Figure 11

Application of new vapor retarder mastics.
Photo credit: H.B. Fuller Co.

Figure 12

Examples of fiber-reinforced kraft all-service jackets.
Photo credit: Johns Manville Corp.

Figure 13

Composite membrane vapor retarder.
Photo credit: Polyguard Products

Figure 14

Polyester sheet material vapor retarder.
Photo credit: The Dow Chemical Co.

Figure 15

Removable/reusable insulation covers.
Photo credit: Thermal Energy Products Inc.

Figure 16

Textiles to protect insulation covers from environmental conditions.
Photo credit: Lewco Specialty Products, Inc.

Figure 17

Example of chloride stress corrosion cracking (CSCC).
Photo credit: John Kalis

Figure 18

Perlite silicate insulation designed to reduce potential of CSCC.
Photo credit: Sproule Mfg. Co.

Figure 19

Removable/replaceable inspection plugs.
Photo credit: NDT Seals Inc.

Figure 20

New low-temperature sealant on pipe insulation.
Photo credit: H. B. Fuller Co.

Figure 21

Gel-type coatings applied by the insulation contractor.
Photo credit: Polyguard Products

Figure 22

Asbestos remediation.
Photo credit: Childers Products Co.

Figure 23

Infrared thermometry used to determine heat loss.
Photo credit: Kevin Hedger

Figure 24

The home page of NAIMA’s 3E Plus®.
Photo credit: NAIMA

There are formidable challenges to achieving meaningful action on policies, programs and funding to advance energy efficiency by the new 109th Congress. The Bush administration and the Congress are faced with mushrooming federal and U.S. trade deficits, a stagnant economy and the financial pressures of a continuing war. In addition, the president has announced an extremely ambitious and full agenda of important domestic issues–from social security to tax reform–that will compete as priorities against the need to address energy issues. While comprehensive energy policy remains a stated priority, it is not clear that this goal can or will be accomplished.

The Bush administration goes to work on its second term in a political and fiscal environment far different from the one it enjoyed at the beginning of its first term. Record budget deficits are the biggest difference. The high deficits are squeezing discretionary program spending, including federal energy efficiency programs such as building efficiency research and support for building codes. In addition to federal spending pressure, the deficits will make enactment of tax incentives for energy efficiency technologies more difficult.

Countering the pressures from budget deficits and other domestic priorities is the spiraling cost of energy in the United States. Spikes in petroleum and natural gas prices are having a particularly hard impact on U.S. stock markets, international manufacturing competitiveness, and ultimately, on the U.S. economy. During January 2005, crude oil prices reached $40.08 per barrel, up 29 percent the previous year. Gasoline prices averaged $1.82 per gallon, up 17 percent from 12 months earlier. January natural gas prices hovered around $6 per MMBtu, about on par with January a year ago, but still triple the price level that prevailed during much of the 1990s. Pressure from businesses and industry for federal action is mounting. Consumers, who have been hard-hit this year by skyrocketing fuel costs, are making themselves heard as well.

The 109th Congress convenes with a slightly more conservative make-up, as Republican majorities increased in both the House and Senate. While the leadership has announced plans to pass comprehensive energy legislation, it is as yet unclear whether such legislation will contain all, or even some, of the provisions that were in the comprehensive energy package, H.R. 6, which failed in the 108th Congress; whether those provisions will be modified; or whether Congress ultimately crafts something completely new.

Energy efficiency is the cheapest, quickest and cleanest way to extend our energy supplies and, therefore, begin to contend with exorbitant energy prices. The energy efficiency provisions of H.R. 6, which include tax incentives to spur energy efficiency upgrades in buildings, the purchase of energy efficient products and technologies, and energy efficiency standards for appliances and other equipment, would deliver meaningful energy savings to our country. The Alliance to Save Energy (ASE) is working to ensure that these provisions–as well as a number of other important energy efficiency policies that were not included in H.R.6–are considered and enacted by this Congress.

The ASE believes that energy efficiency must be the cornerstone of any meaningful national energy policy. The challenges to our success are great, but the return to the country would be enormous in terms of energy savings, avoidance of greenhouse gas and other pollutants, national energy security, and of course, a more robust and competitive economy. Energy efficiency is not simply good public policy; it is good business for our nation.