During the past year or two, most of us have become accustomed to hearing about the high cost of a barrel of crude oil. We’ve also probably frequently read or heard about how Americans consume one-fourth of the world’s oil. For the year 2004, that worked out to about 20.8 million barrels per day out of the total world demand of 82.4 million barrels per day. Furthermore, that demand for crude oil has been increasing rapidly, due to surging economic growth in China, India and other Asian countries, while demand continues to grow briskly in the United States, Canada, and other industrialized nations due to steady economic growth. While the price of a gallon of gasoline at the fuel pump is the gauge by which most Americans judge the price of energy on a personal basis, the price of a barrel of crude oil has become the gauge by which most of us judge the price of energy on a world basis.
As recently as September 2003, crude oil was selling for about $25 per barrel. By October 2004, it had risen as high as $55. Then, by January 1, 2005, it had dropped to about $42, only to rise to about $58 in early April, and then quickly drop back to about $50 by mid-April. So, recent oil prices recently have been extremely volatile and are likely to remain so. Overall the crude oil price has been erratic and seemingly unpredictable during the past year and a half, it has stayed well above $40 per barrel, showing no signs of dropping back to the $25 per barrel price of late 2003.
Many American politicians and other citizens have called for the United States to reduce its dependence on oil imports. To do so, they recommend that we increase domestic oil exploration for new fields and increase drilling in known fields located on federal land, in particular in the Alaska National Wildlife Refuge (ANWR). This seems logical since U.S. demand for crude oil continuously increases while domestic production continuously decreases. For example, from 2003 to 2004, U.S. demand increased by more than 400,000 barrels per day (bpd) while U.S. production of crude oil decreased by about 250,000 bpd. This has resulted, of course, in a dramatic increase in U.S. crude oil imports. This increasing importation of crude oil worsens the U.S. trade imbalance, thereby weakening the U.S. dollar on the foreign exchange markets and leading to less foreign investment in American securities. If this pattern persists, it could eventually seriously erode the purchasing power of American households. To rectify this situation, it is incumbent on all Americans to find ways of importing less foreign crude oil.
Americans’ consumption of energy in general, and of crude oil in particular, can be broken into several general segments shown in Figure 1, which gives the breakdown, by sector, of U.S. energy use in 2002 where the total use was 97.89 quads, or quadrillion Btu.
With the National Insulation Association member companies serving the first two major categories, you can see from Figure 1 that they have an impact on slightly more than half the energy use in the United States either directly or indirectly. So, in terms of total U.S. energy consumption, it is worthwhile taking a look at mechanical insulation’s contributions.
What’s in a Barrel of Oil?
So, how much energy is in a barrel of crude oil? Well, a barrel of oil has 42 U.S. gallons, and each gallon has almost 140,000 Btu of energy content, give or take a little on the energy content depending where the oil is from. Consequently, a typical barrel of oil contains almost 6 million Btu of energy.
So what? Well, if you drive your car an average of 17,000 miles per year and it gets an average fuel efficiency of 17 miles per gallon, then your car consumes 1,000 gallons of gasoline a year. Accounting for the 15 percent loss of crude in the refining process due to inefficiencies, your car consumes about 23 barrels of crude oil per year to provide the gasoline that it runs on. If you have two such cars in your family, then your cars would consume the equivalent of about 46 barrels of oil per year. At $42 per barrel, that’s about $1,900 spent annually by the refiners on the crude oil that they refine into gasoline to power your two cars. (Note: I am using the price of $42 per barrel as a reference price since it’s the equivalent of $1 per U.S. gallon and makes it easier to make comparisons to the price of distillate fuels such as gasoline and heating fuel. A gallon of gasoline costs much more than a gallon of crude oil due to refining costs, marketing and distribution costs, and federal and state taxes.)
Of course, crude oil also powers trucks, trains and airplanes, our construction equipment, some building heating and some electricity production, and also serves as a chemical feedstock for plastics. According to Oil & Gas Journal, the end result is that as a nation, in 2004 Americans consumed about 20.8 million barrels per day (bpd) of crude oil, or 7.6 billion barrels per year. With a population of 295 million Americans, that works out to almost exactly 26 barrels of oil per person during 2004.
As an American, that’s your individual average consumption–26 barrels per year, or 2.96 gallons of crude oil per day. If you have a family of four, then your family’s consumption share would be almost 12 gallons per day or 104 barrels per year.
Incidentally, Americans are in an extremely close race with our Canadian neighbors in being the world’s most oil-consuming society. In 2004, the 32.2 million Canadians consumed about 2.20 million bpd of crude oil, or about 2.93 U.S. gallons per Canadian per day, only slightly less than U.S. per-capita daily consumption. However, Canada produces twice what Canadians consume. Canadian oil suppliers export their surplus crude oil south into the United States, either as crude or as refined distillates. In 2004, the United States, by contrast, only produced about 40 percent of what Americans consumed and therefore had to import the other 60 percent of its crude oil supply from other countries, including Canada.
The table in Figure 2 summarizes these numbers.
Even though Americans use a large portion of crude oil for transportation, these numbers also include the U.S. share of industrial use of crude for refining crude oil, as energy and feedstock for producing chemicals, for manufacturing various products and so forth, as well as heating office buildings, hospitals, refrigeration equipment, etc. That’s where mechanical insulation becomes significant. NIA member companies’ products and services reduce the use of thermal energy at commercial and industrial facilities and thereby reduce the consumption of energy resources such as natural gas and crude oil.
Plant Insulation Analysis
In my article in the December 2004 issue of Insulation Outlook, titled "The Fall of the Oil Age," I included a chart (Figure 3) that shows how much crude oil can be saved by insulating a square foot of a 600 F surface with 4-inch-thick mechanical insulation. On this chart, I considered this energy loss year by year for up to five years.
In doing the calculations for this chart, using 3E Plus®, I was struck by the power of mechanical insulation. To me, it’s remarkable that this tiny square foot of insulation saves as much as 16 barrels of oil over the course of five years under these thermal conditions. In view of the high price of crude oil, this realization encouraged me to take a broader look at mechanical insulation’s ability to reduce crude oil consumption. To do this, I decided to consider an oil refinery to determine the amount of extra heat loss due to damaged (or missing) mechanical insulation.
Let’s consider an example plant taken from NIA’s National Insulation Training Program (NITP). NITP students learn that this plant is a 125,000-bpd oil refinery that has 356 miles of pipe (1.87 million linear feet), 32.5 football fields worth of insulated piping. That’s a lot of pipe for a refinery that is not a particularly large facility, as refineries go, since it represents less than 1 percent of total U.S. refining capacity (which, according to a recent issue of Oil & Gas Journal, is 16.8 million bpd).
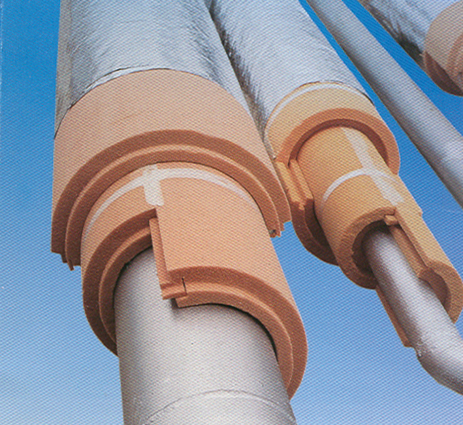
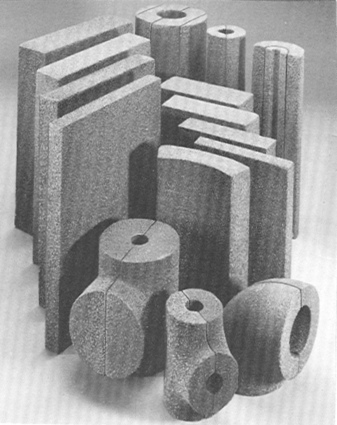
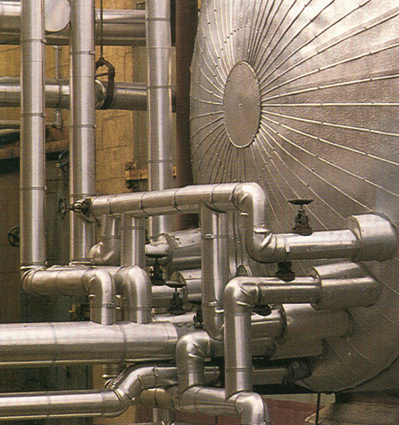
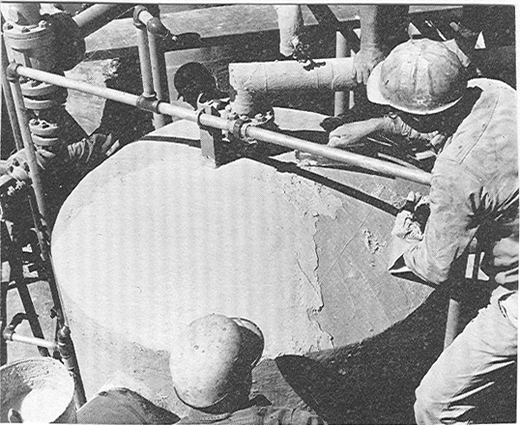
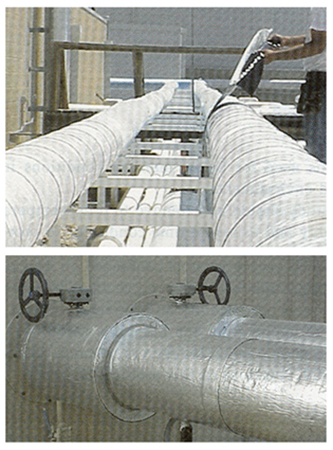
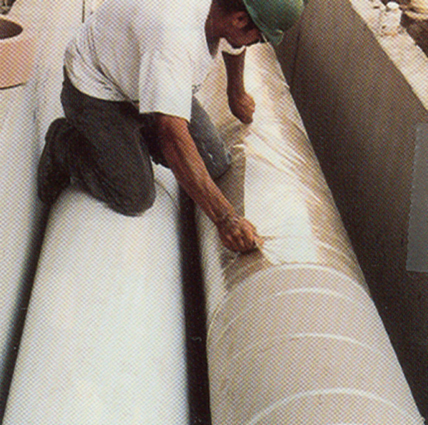
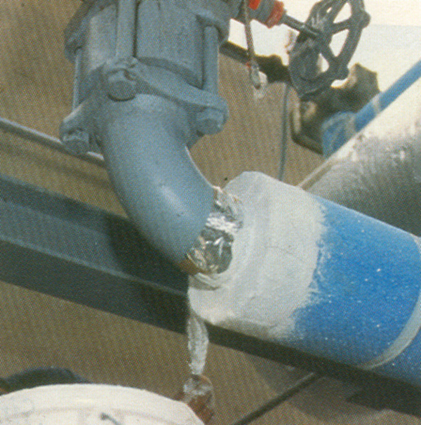
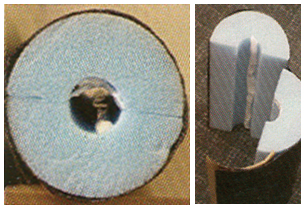
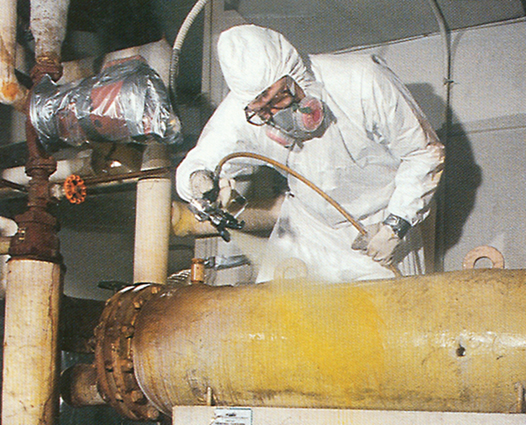
In this particular example, as presented in the NITP, the students are told that 21.3 percent of the thermal insulation was damaged. Now, we’re not certain exactly what "damaged" means in terms of the insulation thermal performance. For my estimate, I am going to assume that "damaged" means "damaged or missing." Figures 4, 5 and 7 show pictorially what pipes with damaged or missing insulation could look like at an oil refinery or a petrochemical plant.
For the purposes of an engineering heat loss analysis, I am going to make several assumptions:
- Average pipe temperature is 600 F.
- Average ambient temperature is 60 F.
- Average wind speed is 5 mph.
- Average pipe size is 8-inch NPS.
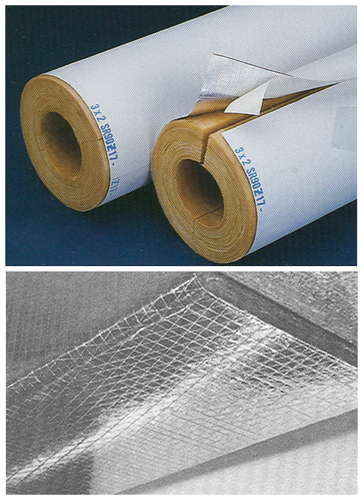
- Insulation type is ASTM C547, Type I mineral fiber pipe insulation.
- Refinery fuel is a petroleum distillate with an energy content of 140,000 Btu per gallon, or about 6 million Btu per barrel.
Using the 3E Plus computer program, I estimated the following heat losses from both the bare and the insulated pipe, shown on as the first two bars on Figure 6.
It would probably be reasonable to also assume that the "damaged" insulation insulates somewhat, although not well, so that the heat loss from the pipe with this "damaged" insulation is not as high as from a bare pipe. Combined with the missing insulation, then, I further assumed that damaged or missing insulation loses about one-half of the heat loss from the bare pipe. I have shown this as the right-hand bar in Figure 6. Note that the heat loss from the insulated pipe is much less, maybe by 88 percent or so, than the heat loss from the same pipe with damaged or missing insulation.
Using this approach, I estimated the excess heat loss, resulting from 21.3 percent of the 1.87 million linear feet of insulated pipe having damaged or missing insulation. For the 400,000 linear feet of pipe with damaged or missing insulation, that extra heat loss works out to be 1,080 million Btu per hour. Multiplying by 24 hours in a day, this is the equivalent of almost 26 billion Btu per day. In summary, that’s the additional energy loss due to the fact that 21.3 percent of the insulation is damaged or missing and has not been repaired, replaced or reinsulated.
You may be wondering: Is 26 billion Btu per day a lot of heat energy to waste due to thermal inefficiencies resulting from damaged or missing insulation? Is this a big deal or not?
Well, with an energy content of about 6 million Btu per barrel of oil and assuming nominal 75 percent combustion efficiency, this 26 billion Btu per day is the energy equivalent of about 5,800 bpd of crude oil that is being wasted at this one refinery.
How significant is 5,800 bpd of equivalent crude oil consumption, wasted due to excess heat loss through the damaged or missing insulation, for a 125,000 bpd oil refinery? Well, 5,800 bpd of extra equivalent oil consumption represents 4.6 percent of the plant’s total gross refining capacity! Therefore, this wasted energy, in the form of wasted oil, is very significant.
These are a lot of numbers to juggle around. Let’s step back for a moment to take stock of what we have just determined for this relatively small oil refinery and its thermal insulation. On average, we have a refinery that has the equivalent of 400,000 linear feet of 8-inch NPS pipe with damaged or missing 1.5-inch-thick insulation, and this represents 21.3 percent of the original total insulation. If this insulation remains damaged and unrepaired or unreplaced for a one-year time period, excess heat loss, and hence wasted crude oil equivalent, is spent keeping these pipes hot. The extra energy needed is 5,800 bpd of crude oil. For a year, this works out to 1.6 million barrels of wasted oil at this one refinery.
Now, it would be reasonable if you were to say to yourself as you read this, "That’s ridiculous! No maintenance manager at an oil refinery would ever let this happen. He’d walk around his plant and become furious with his maintenance staff for all this damaged or missing insulation, which would be obvious to the naked eye. Then he’d immediately budget the necessary millions of dollars to repair or replace it during the next maintenance outage. He’d take care of his insulation problem as fast as he could. There’s no way he’d simply throw away 5,800 barrels of oil every day!"
Well, maybe so, and maybe not.
Incidentally, at an average price of $42 per barrel, that wasted heat would represent over $67 million worth of equivalent crude oil in one year, at this one refinery. Now, I don’t know what your company might consider to be significant. To my company, however, this is starting to look like some real money.
Analysis for the Entire United States
What could this mean for the United States as a whole? According to the December 26, 2004, issue of Oil & Gas Journal, the total U.S. oil refinery input production, for the week before December 12, 2004, was 16,792,000 bpd. Our example plant represents only 0.74 percent of this total. If I assume that all U.S. oil refineries, based on this capacity, had this same percentage of damaged insulation, namely 21.3 percent, under these same thermal conditions, then I can get a ballpark estimate of the total amount of wasted equivalent crude oil, resulting from excess heat loss through those surfaces with damaged or missing thermal insulation.
I did this, and my estimate worked out to be 585,000 bpd of equivalent crude oil wasted, for all U.S. refineries, due to damaged or missing insulation.
For the nation as a whole, this is enormous. At the 2004 rate of consumption, Americans consumed about 20.4 million bpd of oil. I have just estimated that about 585,000 bpd of this total, or 2.89 percent of average U.S. crude oil consumption in 2004, resulted from excess energy lost through damaged or missing mechanical insulation at American oil refineries.
Let me put it into a different perspective by asking, is 585,000 bpd a lot of energy to waste at oil refineries? Last spring, the U.S. Energy Information Administration estimated that ANWR, if and when it is opened up and developed, most likely will produce about 900,000 bpd (and that level of production might take at least 10 years to develop). This wasted energy at U.S. refineries alone, resulting from excess heat loss from pipes and equipment with damaged thermal insulation, represents nearly 65 percent of the expected future production capacity of ANWR. In my opinion, that is an enormous quantity of thermal energy to waste and an enormous quantity of crude oil to waste.
I have shown this comparison graphically in Figure 8.
Now, you may think that pipe and equipment insulation damaged or missing at a rate of 21.3 percent is a high estimate.
My response is that perhaps 21.3 percent is a high percentage for damaged or missing insulation and perhaps my estimate is overly conservative. On the other hand, keep in mind that I have also not considered that at oil refineries, much of the piping and equipment operates at much higher temperatures than 600 F (for example, cracking towers operate at about 950 F) and furthermore, heat loss from hot, bare surfaces (where there is missing insulation) is non-linear with temperature; it follows a power curve upward, as shown in Figure 9. You can see from the chart that heat loss from a 950 F surface is about 16,000 Btu per hour per linear foot, which is about 2.7 times the 6,000 Btu per hour per linear foot value from the 600 F pipe; so my estimate of heat losses could be non-conservatively low.
Furthermore, we know that when it rains on the damaged insulation or on the bare pipes with missing insulation, the heat loss increases dramatically due to the rain water evaporating off the hot surfaces and/or out of the hot insulation into which it has seeped (it takes at least 1,000 Btu of thermal energy to evaporate each pound, or about 2 cups, of water). Perhaps there are many refineries with more than 21.3 percent damaged or missing insulation. So, my analysis could be non-conservative. In any case, it is only an estimate to put energy waste, resulting from damaged or missing insulation, into perspective. I have done that by converting those heat losses into units of barrels of crude oil equivalent and compared that to our annual national consumption. As my analysis has shown, this waste can be significant.
Making the Public Aware of Mechanical Insulation’s Role
Imagine if you were to learn many years from now, after ANWR has been developed and is producing 900,000 bpd of crude oil, that two-thirds of its production is being wasted or diverted somehow so that it never gets into the American market. You would, no doubt, be outraged. Likewise, we all should be outraged by the equivalent crude oil loss resulting from damaged or missing thermal insulation at refineries–oil that might represent 2.89 percent of the U.S. annual consumption of crude oil. As private citizens, we should be outraged. As mechanical insulation contractors, fabricators, distributors and manufacturers, however, we need to go beyond outrage. We should become determined to take action because this represents a significant business opportunity loss.
Before we take action, let’s return to this 125,000 bpd oil refinery with the equivalent of 400,000 linear feet of 8-inch pipe with damaged insulation and ask: "Approximately what would it cost to replace the damaged material?" I relied on 3E Plus again for the estimate.
Using the default values for material costs and labor costs, I calculated an installed cost of $13.67 per linear foot for the 8-inch NPS pipe with 1.5-inch thick mineral fiber pipe insulation with aluminum jacketing. Insulation material prices have increased recently and labor costs have also increased; so to be conservative I increased this calculated amount by 10 percent, which gave me an installed cost of about $15 per linear foot. I also assumed that the owner spends $5 per linear foot to remove the damaged, non-asbestos containing insulation and to dispose of it. That’s a total of about $20 per linear foot to remove and dispose the damaged insulation and then to reinsulate the pipe. With 400,000 linear feet of pipe with damaged insulation, that represents a total installed cost of about $8 million for this one refinery. Now remember that we already determined the pipes, with damaged or missing insulation, were wasting an additional $67 million of equivalent crude oil per year. So, this $8 million expenditure to replace the damaged or missing material and eliminate this energy waste would have an amazingly short payback of only 1.4 months!
The insulation replacement would definitely be cost-effective, and we in the mechanical insulation industry have become accustomed to seeing extremely short payback periods for insulating hot service pipes and equipment. Further, we would hope that any oil refinery manager would consider an $8 million investment, to reduce his energy cost by $67 million per year, to be exceedingly cost-effective. So, what’s the problem? Where are all the purchase orders for insulation repair and replacement at oil refineries?
Mechanical insulation is the "lost and forgotten technology." Too many owners and operators of oil refineries and of other industrial facilities simply don’t recognize that they have an insulation problem. They do know that at $42 per barrel, crude oil is very expensive and should be used efficiently. Furthermore, most are aware that in the long term, the price of crude oil is very likely to continue increasing. But why consider mechanical insulation? Some reason incorrectly that a little damaged or missing insulation here and there can’t be causing that many problems. Furthermore, getting budget approval for $8 million to do some insulation maintenance work isn’t always very easy–it’s still a lot of money for a single 125,000-bpd oil refinery.
All of us in the mechanical insulation industry are in this together. That’s why we belong to NIA, so that we together can promote our industry by educating the public about the effectiveness of our products and services. As we know from experience, it’s an uphill battle. We are a small industry with only about $8 billion in revenue per year. Several of the American energy giants individually do $100 to $300 billion of revenue annually. The total American oil and gas industry did nearly $1 trillion in business in 2004, or more than 100 times our industry’s annual revenue. Our industry simply looks small and insignificant compared to the oil and gas industry. In fact, we look small and insignificant compared to many other industries. The costs of our products and services are simply much less than their economic value in terms of energy savings.
In order to get more attention, and appreciation, for ourselves and for our products and services, we need to communicate more effectively with people outside of our industry, particularly the decision-makers at energy-consuming industrial facilities. There is evidence that many industrial plant owners don’t believe maintenance of their pipe and equipment insulation is of critical importance to energy efficiency. Or, their maintenance managers and employees may understand how important insulation is, but they are limited by budgets established by their management, and these budgets frequently do not represent the value of lost thermal energy from piping and equipment due to damaged or missing insulation.
To remedy this situation, we need to get more industrial facility owners and operations to take the NIA’s Insulation Energy Appraisal Program, or to at least learn how to use 3E Plus. We need to present our customers with examples of energy savings from replacing damaged insulation or insulating those pipes and equipment with missing insulation. We need our customers to come to understand that wet insulation is as ineffective as no insulation at all and that wet insulation may be the result of just a little cracked or missing jacketing joint sealants, a type of damage that may not even be that visible to the naked eye. Hence, our customers need to learn that while some insulation is obviously damaged, other damaged insulation may not even look like it’s damaged. With mechanical insulation, what you see is not always what you get.
Overall, we need to educate our customers so they address the "three As" when it comes to their mechanical insulation:
- Awareness
- Appreciation
- Attention
When it comes to industrial energy efficiency, mechanical insulation is probably the most underrated and undervalued of all the systems used in a plant. We can change this misconception together by educating our customers about the benefits of our products and services, one of which is to reduce the United States’ overall consumption of crude oil and increasing reliance on imported crude oil. Our industry is already making a huge difference, but there is enormous potential for additional improvement. With your effort, we will make a greater difference now and in years to come.
 Figure 1
 Figure 2
Table 1. Oil consumption, imports and exports.
 Figure 3
Number of barrels of oil equivalent saved per year using 1.0 square foot of 4-inch-thick mineral fiber insulation on a 600 F surface.
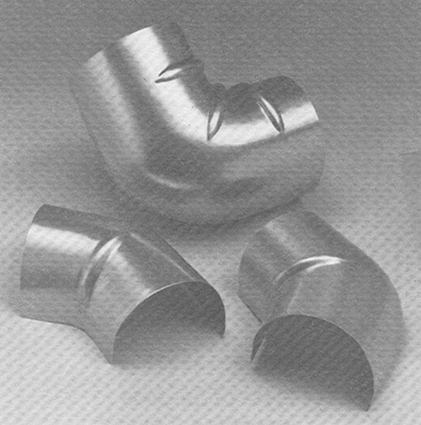
 Figure 4
Missing and damaged insulation and jacketing on a valve and connecting piping.
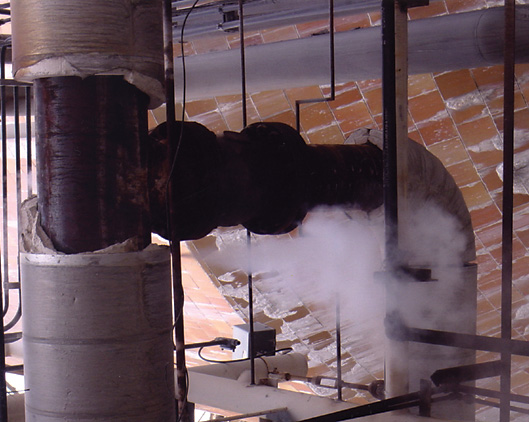 Figure 5
Missing insulation in and around a T connection.
 Figure 6
Estimated heat loss from a 600 F, 8-inch NPS pipe for three cases: uninsulated, insulated with 1.5 inches of ASTM C547, Type 1 mineral fiber pipe insulation, and with damaged or missing insulation.
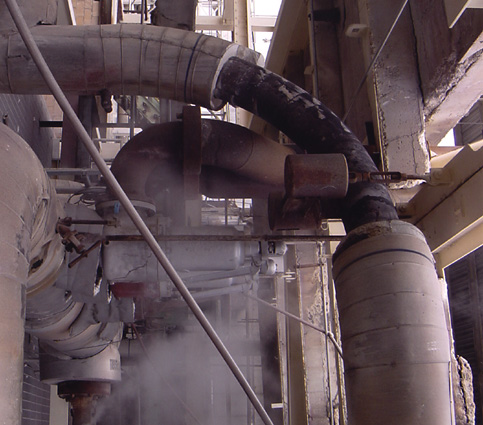 Figure 7
Missing insulation on a pipe bend.
 Figure 8
Comparison between future production of ANWR and estimated wasted energy resulting from damaged or missing insulation at U.S. refineries, in bpd of crude oil equivalent.
 Figure 9
Heat Loss from an uninsulated 8-inch NPS pipe for different pipe temperatures, up to 1,000 F.