Category Archives: Global

Most of us probably don’t remember how we learned that certain things we encountered in our youth were dangerous to touch. Those of us who became parents are more likely to recall how we taught our children to avoid open flames, matches, and the toaster. Unfortunately, most of these warnings aren’t really taken seriously until the person, young or old, touches a surface and discovers how hot it is and gets burned. We remember the pain, the wound and sometimes the scar. For business owners, posting warnings about hot surfaces in the work place isn’t enough. There’s a way to reduce or eliminate these burn injuries resulting in lost time, medical expenses, and even the morale of the employees.

Burn Definitions

The ASTM Standard Practice Determination of Skin Contact Temperature from Heated Surfaces Using a Mathematical Model and Thermesthesiometer, C 1055, defines several kinds of burns.

First Degree Burn

A first degree burn is defined as "the reaction to an exposure where the intensity or duration is insufficient to cause complete necrosis of the epidermis but no significant damage to the dermis. The normal response to this level of exposure is dilation of the superficial blood vessels (reddening of the skin)."

Second Degree Burn

A second degree burn is defined as "the reaction to an exposure where the intensity and duration is sufficient to cause complete necrosis of the epidermis but no significant damage to the dermis. The normal response to this exposure is blistering of the epidermis."

Third Degree Burn

A third degree burn is defined as "the reaction to an exposure where significant dermal necrosis occurs. Significant dermal necrosis has been defined in the literature as a 76 percent destruction of the dermis thickness. The normal response to this exposure is open sores that leave permanent scar tissue upon healing."

The epidermis is the outermost layer of skin cells which contains no vascular or nerve cells and acts to protect the outer skin layers. It’s about 0.08 mm thick. The dermis is the second layer of skin tissue which contains blood vessels and nerve endings. It’s about 2mm thick. Necrosis is the clinical term applied to localized death of living cells.

The length of time that human skin can contact a hot surface without pain or injury depends on the temperature of the surface and the thermal conductivity of the surface material. It’s generally accepted that 5 seconds is the maximum probable time for industrial situations that average human skin may be in contact with a hot surface resulting in a reaction no worse than a first degree burn. The objective for us then becomes controlling the surface temperature of the hot surface somewhere in the range of 44 degrees Celsius (C) and 59 degrees C. For those of us not yet attuned to the Metric system, the range is 111 degrees Fahrenheit (F) and 139 degrees F.

Thermal Insulation Protects Personnel

One of the reasons thermal insulations are used is for personnel protection. Putting insulation, with its protective jacketing, on a hot surface increases the total thermal resistance of the system and therefore the exposed surface temperature will be reduced to a level below that of the uninsulated surface. Once again we’re faced with the task of making some design recommendations on what insulation material and jacketing to use, and selecting the insulation thickness.

Since this solution depends on the value of the exterior surface temperature of the insulated system, we must first understand that the "worst case" service conditions must be established. This means that we must specify the ambient temperature as the maximum expected during summer conditions for outdoor and indoor exposures. It also requires that we assign a wind speed velocity of 0 miles per hour (mph). Then we must determine the maximum service temperature that the system will see in service. It’s my preference to select a lower surface temperature maximum based on whether or not the protective jacket is metallic.

When the jacket is metal-such as aluminum or steel-the thermal conductivity of the metal is quite high, thereby quickly transferring heat to the skin on contact. This being the case, it seems prudent to specify a maximum surface temperature closer to 130 degrees F than to 140 degrees F when the insulated surface is protected by a metallic jacket or facing. Another point of interest deals with the emittance value for the jacket material. Low emittance values (0.03 for shiny aluminum for example) yield a higher thermal resistance for the outside surface film, and a surface temperature closer to the operating temperature (higher) in turn requiring a greater insulation thickness to meet the design surface temperature criteria. There are many jacketing treatments available.

Lastly, the thermal insulation material must be selected. The thickness required for personnel protection is directly proportional to the thermal conductivity of the insulation. There are many thermal insulation materials that are suitable for service on pipes, vessels, and equipment operating at temperatures up to 1,000 degrees F and higher.

It’s not within the scope of this article to specify either the insulation or the jacketing material. This part of the solution depends on good communication between the owner, his engineering department and the insulation contractor. There will be preferences and other requirements resulting in the selection of the insulation material and the jacket treatment.

Job Conditions

Let us establish the "job" conditions for an example of how to determine the insulation thickness to provide personnel protection. We have a bare horizontal 10-inch IPS steel pipe located outdoors in an eastern state in the United States. The pipe is carrying saturated steam at 400 degrees F, and it’s at a 4-foot elevation adjacent to a well used walkway. The owner stated his preference for mineral fiber insulation with a field applied stainless steel jacket. Since the jacket is to be metal, the decision was made to set the maximum allowable surface temperature at 133 degrees F, and the worst case exposure was agreed to be 110 degrees F ambient air temperature and 0 mph wind velocity.

Beginning on page 10, the 3E Plus® computer program illustrates how easy it is to determine the insulation thickness required to reduce the surface temperature to a value below the specified maximum for personnel protection.

If this sophisticated program for calculating insulation thickness for economics, process control, condensation control, and personnel protection is unfamiliar to you, visit www.pipeinsulation.org to learn more about the newest version of this program that has been in widespread use by the thermal insulation industry for more than forty years.

Figure 1

We open the 3E Plus program, and the main menu appears.

Figure 2

The INSULATION THICKNESS screen appears.

Figure 3
Figure 4
Figure 5

Here is the Thickness and Surface Temperature report.

Industrial plant engineers often must convince top management that investing in steam efficiency is an effort worth making. Communicating this message is often more difficult than the actual engineering behind the concept. A corporate audience responds more readily to a dollars-and-cents impact than to a discussion of Btus and efficiency ratios.

By adopting a financial approach, the plant engineer relates steam efficiency to corporate goals. Collaborating with the financial staff yields the kind of proposal that’s needed to win over corporate officers who have the final say-so over such capital investments as steam system upgrades.

Before any recommendations can be made about how to justify steam improvement projects, it’s first necessary to understand the world as management typically sees it.

Understanding Corporate Priorities

Corporate officers are accountable to a chief executive, a board of directors, and an owner (or shareholders, if the firm is publicly held). These officers create and grow the equity value of the firm. The corporation’s industrial facilities contribute to this equity by generating products with a market value that exceeds the cost of owning and operating the plant itself.

Plant equipment-including steam system components-are assets that must generate an economic return. The annual earnings attributable to the sale of goods produced by these assets, divided by the value of the plant assets themselves, describe the rate of return on assets. This figure is a key measure by which corporate decision makers are held accountable.

Financial officers in particular are conservative decision makers. They shun risk and resist spending money on the plant itself, if possible. When forced to do so, they seek investments that are most certain to demonstrate a favorable return on assets. When presented with multiple investment opportunities, they favor those options that lead to the largest and fastest returns.

This corporate attitude may impose sometimes-unpleasant priorities on the plant engineer or facility manager. Priorities include reliability in production, avoiding unwanted surprises by primarily adopting familiar technology and practices, and contributing to cost control today by cutting corners in maintenance and repair. No wonder industrial decision makers often conclude that steam efficiency is a luxury they can’t afford.

Fortunately, the story doesn’t end here. Industrial steam efficiency can save money and contribute to corporate goals while effectively reducing energy use and unwanted noxious combustion emissions in a variety of ways.

Measuring the Dollar Impact

Steam system improvements can move to the top of the list of corporate priorities if the proposals respond to distinct corporate needs. The number and variety of corporate challenges open up many opportunities to promote steam efficiency as a solution. And steam systems offer many opportunities for improvement. Once target areas have been selected, the proposals need to be dressed in corporate, dollars-and-cents language.

The total dollar impact of the measure must be identified and quantified. One framework to use is life-cycle cost analysis. This analysis captures the total expenses and benefits associated with an investment. The result-a net gain or loss on balance-can be compared to other investment options or, if no investment is made, to the anticipated outcome. When used as a comprehensive accounting of an investment option, the life-cycle cost analysis for a steam efficiency measure includes several elements. These include:

  • search and selection costs of choosing an engineering implementation firm.

  • initial capital costs, including installation and the costs of borrowing.

  • maintenance costs.

  • supply and consumable costs.

  • energy costs over the economic life of the implementation.

  • depreciation and tax impacts.

  • scrap value or cost of disposal at the end of the equipment’s economic life.

  • impacts on production such as quality and downtime.

A typical boiler installation illustrates this approach. The analysis assumes a 20-year life operating at high rates of capacity utilization. Fuel costs may represent as much as 96 percent of life-cycle costs, while the initial capital outlay is only 3 percent and maintenance a mere 1 percent. Clearly, any measure that reduces fuel consumption (while not negatively affecting reliability and productivity) certainly yields positive financial impacts for the company.

Presenting Efficiency Economics

As with any corporate investment, there are many ways to measure economic impacts. Some are more complex than others and proposals may use several analytical methods side-by-side. The choice of analyses depends primarily on the sophistication of the presenter and the audience.

A simple (and widely used) measure of project economics is the payback period. This term is defined as the period of time required for a project to break even. It’s the time needed for the net benefits of an investment to accrue to the point where they equal the cost of the initial outlay.

For a project that returns benefits in consistent, annual increments, simple payback equals the initial investment divided by the annual benefit. Simple payback doesn’t consider the time value of money. In other words, it makes no distinction between a dollar earned today and one earned in the future, making earnings figures uncertain. Still, the measure is easy to use and understand, and many companies use it for making a quick decision on a project. The following factors are important to remember when calculating a simple payback:

  • The figure is approximate. It’s not an exact analysis.

  • All benefits are measured without considering their timing.

  • All economic consequences beyond the payback are ignored.

  • Payback calculations don’t always find the best solution (because all factors aren’t considered).

  • Payback doesn’t consider the time value of money or tax consequences.

More sophisticated analyses take into account such factors such as discount rates, tax impacts, and cost of capital. One approach involves calculating the net present value of a project, which is defined by the equation:

    NPW = PWB – PWC

    NPW (net present worth)

    PWB (present worth of benefits)

    PWC (present worth of costs)

Another commonly used calculation for determining economic feasibility of a project is internal rate of return. It’s defined as the discount rate that equates future net benefits (cash) to an initial investment outlay. This discount rate can be compared to the interest rate at which a corporation borrows capital.

Many companies set a threshold (or hurdle) rate for projects. This rate is the minimum required internal rate of return for a project to be considered viable. Future benefits are discounted at the threshold rate, and the net present worth of the project must be positive for the project to be given the go-ahead.

Relating Steam Efficiency to Corporate Priorities

Saving money, in and of itself, should be a strong incentive for increasing steam efficiency. Still, that may not be enough for some corporate observers. The case can be strengthened by relating a positive life-cycle cost analysis to specific corporate needs. Consider the following suggestions for interpreting the benefits of fuel cost savings:

A New Source of Permanent Capital

Reduced fuel expenditures-the direct benefit of steam efficiency-can be thought of as a new source of capital for the corporation. An investment that reduces fuel costs yields savings each year over the economic life of the improved steam system. Regardless of how the investment is financed (borrowing, retained earnings, or third-party financing), the annual savings are a permanent source of funds as long as the savings are maintained on a continuous basis.

Added Shareholder Value

Publicly-held corporations usually embrace opportunities to enhance shareholder value. Steam efficiency is an effective way to capture new value. Shareholder value is the product of two variables: annual earnings and price-to-earnings (P/E) ratio. The P/E ratio describes the corporation’s stock value as the current stock price divided by the most recent annual earnings per share. For a steam efficiency proposal to take advantage of this measure, it should first identify annual savings (or rather, addition to earnings) that the proposal will generate. Multiplying that earnings increment by the P/E ratio yields the total new shareholder value that can be attributed to the steam efficiency implementation.

Reduced Cost of Environmental Compliance

Plant engineers can promote project benefits as a means of limiting the corporation’s exposure to environmental emissions compliance penalties. Efficient steam systems lead to better monitoring and control of fuel use. Combustion emissions are directly related to fuel use. They rise and fall in tandem. Implementing steam efficiency lets the corporation enjoy two benefits: decreased fuel expenditures per unit of production and fewer emission-related penalties.

Improved Worker Comfort and Safety

Steam system optimization requires ongoing monitoring and maintenance that yields safety and comfort benefits in addition to fuel savings. The system monitoring routine usually identifies operational abnormalities before they present a danger to plant personnel. Containing these dangers minimizes any threats to life, health, and property.

Improved Reliability and Capacity Utilization

Another benefit of steam efficiency is more productive use of steam assets. The efforts required to achieve and maintain energy efficiency largely contribute to operating efficiency. By ensuring the integrity of steam system assets, the plant engineer can promise more reliable plant operations. From the corporate perspective, a greater rate of return on assets is achieved in the plant.

Taking Action

The following steps can help make a proposal for steam efficiency implementation attractive to corporate decision-makers:

  • Identify opportunities for achieving steam efficiency.

  • Determine the life-cycle cost of attaining each option.

  • Identify the option(s) with the greatest net benefits.

  • Collaborate with the financial staff to identify current corporate priorities (added shareholder value, reduced compliance costs, improved capacity utilization, etc.).

  • Generate a proposal that demonstrates how the benefits of the steam efficiency project directly responds to current corporate needs.

If you’re in Florida and you step outside on an August afternoon, chances are good that it’s going be hot and muggy. Conversely, if it’s Alaska in January, it’s fairly safe to say that it’s going to be cold and windy.

You can try to guess what the temperature, humidity level and wind speed might be, and you might come reasonably close, but wouldn’t it be easier with some tools? Perhaps a thermometer or a wind gauge? Such instruments can provide precise readings, either confirming or denying your speculations.

Now, imagine the setting is an industrial facility or factory. A plant engineer knows how much energy the facility is using and what its energy costs are. He knows the numbers could be better than what they are. He might be aware that if insulation were installed on some those bare pipes, valves and other components, the plant’s performance could improve significantly.

But the tricky part is identifying where the primary trouble spots are, and how to fix them. A plant engineer has a million things to worry about, and insulation is likely not the number one priority. Ideally, that’s when he’ll contact someone with the expertise, skills and tools to provide solutions. Perhaps that person is an energy auditor certified through the National Insulation Association’s Insulation Energy Appraisal Program (IEAP). And it also may be someone who’s also a certified thermographer. Utilizing a specially designed camera, a thermographer uses infrared imaging and measurement to "see" and "measure" thermal energy emitted from an object.

Thermal Energy

Thermal, or infrared energy, is light that’s not visible because its wavelength is too long to be detected by the human eye. It’s the part of the electromagnetic spectrum perceived as heat. Unlike visible light, in the infrared world, everything with a temperature above absolute zero emits heat. Even very cold objects, such as ice cubes, emit infrared. The higher the object’s temperature, the greater the infrared radiation emitted. Infrared allows us to see what our eyes can’t.

Infrared thermography cameras produce images of invisible infrared or "heat" radiation and provide precise non-contact temperature measurement capabilities. Nearly everything gets hot before it fails, making infrared cameras valuable diagnostic tools in many diverse applications. And as industry strives to improve manufacturing efficiencies, manage energy, improve product quality, and enhance worker safety, new applications for infrared cameras continually emerge.

If you talk to thermographers, the technology has opened many eyes. Kevin Hedgers, industrial division manager for NYCO, Inver Grove Heights, Minn., says thermography adds professionalism and a level of sophistication to the process.

"The bottom line is that it absolutely provides credibility to the whole audit process by providing visual documentary of your work," says Hedgers, a certified IEAP appraiser. "You need to have that credibility."

Steve Campbell, Owens Corning national specifications manager, insulating systems business, southern region, says thermography has been a terrific tool for energy audits.

"You’ve heard the saying about a picture being worth 1,000 words," says Campbell, another IEAP alum. "In this case, a picture can be worth hundreds of thousands of dollars. [Thermography] has been a real good selling point. It gives maintenance people documentation to take to management to show how it can help."

Infrared History

Sir William Herschel, an astronomer, discovered infrared in 1800. He built his own telescopes and was familiar with lenses and mirrors. Knowing that sunlight was made up of all the colors of the spectrum, and that it was also a source of heat, Herschel wanted to find out which color(s) were responsible for heating objects. He devised an experiment using a prism, paperboard, and thermometers with blackened bulbs where he measured the temperatures of the different colors.

Herschel observed an increase in temperature as he moved the thermometer from violet to red in the rainbow created by sunlight passing through the prism. He found that the hottest temperature was actually beyond red light. The radiation causing this heating wasn’t visible. Herschel termed this invisible radiation "calorific rays." Today, it’s known as infrared.

Infrared Cameras-How Do They Work?

An infrared camera is a non-contact device that detects infrared energy (heat) and converts it into an electronic signal, which is then processed to produce a thermal image on a video monitor and perform temperature calculations.

Heat sensed by an infrared camera can be precisely quantified, or measured, allowing a user to not only monitor thermal performance, but also identify and evaluate the relative severity of heat-related problems. Recent innovations, particularly detector technology, the incorporation of built-in visual imaging, automatic functionality, and infrared software development, deliver more cost-effective thermal analysis solutions than ever before. Infrared thermography allows a user to instantly visualize and verify thermal performance. In June 2001, Maintenance Technology magazine reported a $4 return on investment in for every $1 spent on infrared inspection.

Getting Started

Campbell, based in Big Sandy, Tenn., is a certified level II thermographer. A level I certification is essentially described as qualitative, meaning "you can basically compare picture A to picture B," says Campbell. Level II is more quantitative, allowing for more analysis between numbers and temperatures with the infrared images. A number of infrared technology manufacturers teach classes on thermography. Campbell attended a four-day classroom session taught by a manufacturer. The class includes a 75-question test that must be passed to advance to each level.

However, he points out, "The best learning tool for infrared is experience. The classroom is important, but the field work is equally important."

Campbell has been using thermography for more than three years, since Owens Corning began its Thermal Analysis Program. The Owens Corning program combines inspection, analysis and reporting services in a process designed to identify opportunities to optimize thermal insulation systems. A customized report is generated after visual inspections, infrared imaging and analysis of existing mechanical insulation.

Campbell says that a high quality thermography package-camera, software, accessories and training-can cost between $70,000 and $80,000. He says that the camera works just like a video-basically like a hand-held camcorder.

In a typical site visit, Campbell says he will do a pre-audit interview with the person in charge of facility maintenance. He might be asked to measure temperatures above a certain level. Once the parameters are set, Campbell says, "We scan until we see a problem. Then we record it, freeze the image, save it to a PC and create a digital image. We also take detailed notes and have somebody from the company with us to verify where the photos were taken, since most piping and components look the same everywhere. We get about 50 pictures on a good day."

Armed with the infrared documentation, and assisted by computer programs such as 3E Plus®, Campbell can provide a detailed report to the facility engineer and make specific recommendations explaining where improvements can be made through insulation. He says the visual images speak for themselves.

"You have to show it to sell it," Campbell says.

Hedgers agrees that the infrared images, combined with the written reports, make the process much easier for him and the client. As with Campbell, Hedgers uses 3E Plus® as a supplement to the infrared analysis. He can translate the digital images into tables that show how much it would cost to insulate a specific valve, pipe or other types of equipment, and how long the payback period will be.

"It allows them to prioritize," Hedgers says. "In one area, it might be a 3-month payback, and in another a 3-year payback. They can choose whether they want to invest some now and some later."

Personnel protection is another area where thermography can help. "It’s a not just a good energy tool, but it’s also a good safety tool," Campbell says. "If somebody gets burned, you’ve got a big problem on your hands."

Satisfied Customers

In 1999, Unilever-Best Foods Inc. implemented a corporation-wide program to improve energy efficiency and reduce emissions. In 2001, as part of that program, Hedgers conducted an insulation audit at the Unilever Rexdale plant located near Toronto, Ontario, Canada (see November 2001 Insulation Outlook). Hedgers’ work has helped Unilever save some $340,000 in energy costs (over two years). Using infrared images and 3E® Plus, Hedgers provided recommendations that allowed the facility identify areas to add extra insulation.

Prior to the audit, the plant’s tanks were insulated, but manholes and agitators weren’t. Following the audit, 101 manholes, 74 agitators and 28 tank patches were insulated. The implementation cost was $29,517 ($18,615 U.S.) and the total annual savings was $51,606 ($32,545 U.S.)

Doug Dittburner, chief engineer and energy team leader for the Unilever plant, says that Hedgers’ thermographic images and accompanying information made a big difference.

"Our philosophy is ‘data rules’," Dittburner says. "The infrared gives you information that you wouldn’t otherwise have. Someone can say, ‘This is what you need to do,’ but the infrared really shows you the whole picture. The calculations say that this is what you have and this is what you need to do. It’s well worth the investment."

Since beginning its energy program, Unilever, in part due to Hedgers’ efforts, has enjoyed an overall energy savings reduction of $2.3 million ($1.45 million U.S.), with an investment of $1.1 million ($693,727 U.S.). Dittburner adds that the plant has reduced its natural gas usage by 6.3 million cubic feet, its electricity usage by 4.6 million kilowatt hours, and water by 78 million gallons. It has also cut its greenhouse gas emissions by 11.9 million kilograms of CO2.

Looking for Payback

Campbell has also conducted a number of insulation audits as part of Owens Corning’s Thermal Analysis Program. One successful project he was involved with was at the Cargill Foods facility near Memphis, Tenn. Cargill’s operating engineers are interested in any project that will pay for itself within three years. When they saw payback projections in a insulation audit, the engineers immediately had the recommended insulation installed.

The engineers knew they had a lot of pipe that needed to be insulated, but that wasn’t the issue. The questions for them were about the payback period and where to start.

"The project was something we wanted to do for quite a while but we needed to determine the payback for the investment," explained Drew Heise, project engineer at the Cargill facility that makes corn sweeteners, refined corn oil and animal feeds. The operation employs more than 300 people and is spread over about 3.5 million square feet of President’s Island, located along the Mississippi River.

Heise says the audit "identified each specific piece of equipment that needed to be insulated. It tells what the equipment is, the average temperature around the equipment, wind speed at the time of the analysis, the length of pipe to be insulated and the surface temperature of pipe. The report also lists the carbon dioxide emissions related to the energy loss. Then the report gives everything a priority rating-it’s a one, two or three-and they list an estimated payback time for each piece of equipment.

He adds, "Most of them (payback times) were great. There were many well under a year-like 10 months and eight months. Both of those were highly rated as a ‘one.’ We did all of them, even the three’s. Dollar savings was the reason behind doing the project because everything is driven with a payback. Typically here, we’ll do anything that can be paid back within three years."

Heise says that adding insulation was something that needed to be done. "A lot of this is real obvious. If you see 20 feet of exposed steel pipe going right into a boiler, it doesn’t take a genius to realize that it needs to be insulated. We decided to make a record of the situation by first having an [insulation audit] done on all of the hot spots. That gave us something to work with; it offered direction."

Cargill engineers say they are also concerned about safety and environmental issues.

"The report indicates what the future surface temperature might be," explained Heise. "In one example, the report shows a recorded surface temperature of 763 degrees (fahrenheit). After insulating with 3-1/2-inch-thick, high-temperature pipe insulation, the surface temperature will be 136 degrees (F). Typically, 120 or thereabout is considered safe and doesn’t need to be insulated. The projected temperature of 136 degrees (F) is not too far above that. Obviously, 763-degree (F) surface temperatures are a safety issue. Even if the payback period doesn’t fall within our threshold, we would do that one as an environmental health or safety issue."

Heise was also pleased that the report lists the carbon dioxide reduction in pounds per year for each insulation project. If the equipment is insulated as recommended, the report indicates how much the improved efficiency will reduce the carbon dioxide created in burning fossil fuel to generate heat that was previously lost.

"There are limits to what a facility can actually put out into the air," Heise says. "We are only permitted to emit so much to the atmosphere and we can’t go above that limit. Reducing emissions from one piece of equipment-because you are running more efficiently-can open up opportunities in other areas of the plant, if you need to add a burner somewhere, or expand a boiler, for example.

Versatility and Value

Hedgers says thermography is versatile. Earlier this year, he conducted an infrared audit at a 150 megawatt power plant in North Dakota. He was able to document heat losses and the amount of emissions being released into the atmosphere. As was pointed out by Heise at the Cargill plant, industrial plants can only emit emissions to a certain threshold. Hedgers’ work assisted the facility in reducing emissions and avoiding possible fees for exceeding the limit. Also, at a prominent Midwestern health care facility, Hedgers helped save $30,000 in power generation costs over about an 18-month period.

Overall, Hedgers says, thermography adds the kind of precision to the energy audit process that clients appreciate.

"They seem very impressed with the documentation-having a more detailed breakdown estimate of repair costs, and how much energy they’re using. It’s a nice value added service."

When he began using infrared technology, Campbell admits that he didn’t know what to expect. But it didn’t take him long to realize what a tremendous asset it is.

"I’ve been in the business for 27 years, and it’s the best tool to do an energy audit that I’ve run across."

Editor’s Note: This story contains partial excerpts from an Owens Corning Thermal Analysis case study prepared by Bill Hamilton. For a comprehensive look at Kevin Hedgers’ energy audit at the Unilever Toronto plant, see his November 2001 Insulation Outlook story, "Insulation Energy Appraisal."

This article is a guide to determine where and when electric tracing may be an option. It will also address the design and installation practices of electrical heat-tracing systems, along with insulation requirements. This is to serve as a guide only, since many special conditions may not be covered in this article. Impedance, skin electric current tracing and induction heating aren’t addressed here.

Electrical heat traced systems are used frequently for:

  • freeze protection of pipelines and equipment.

  • maintaining a specific temperature of process systems.

  • changing the temperature of a process.

Electrical heat-tracing is gaining popularity over steam heat-tracing for the following reasons:

  • Electrical traced systems can be controlled with fewer temperature variations.

  • Steam-traced systems usually respond more slowly to changing heat demands.

  • During cold weather, the steam equipment may become overloaded at a time when the traced systems require freeze protection.

  • Steam traced systems require design considerations for evacuating the condensate. Steam trap locations and the pipeline, tracer configuration is critical on steam tracing.

  • Electrical traced systems only need to be turned on when protection is required, thereby saving energy.

  • Where the traced systems are to be applied for the purpose of freeze protection or where the process temperature is below approximately 300 degrees fahrenheit (F) (149 degrees celsius[C]), electric tracing is usually the most cost effective method. They’re easier to install and maintain.

Electric tracing for freeze protection is perhaps where this type of system is most widely used. This protection is usually where water or a process liquid may not flow for a period of time and the temperature may be below freezing for several hours or days. There are also conditions where a process material has a high viscosity or solidifies at lower temperatures and require heating in order to pump from one location to another.

Considering Electric Tracing

Many years ago, at the direction of a young engineer, a new safety shower was installed on an acid chemical plant in Ohio. It was some distance from the main buildings. Fifty-pound steam was available in the area so the water line to the safety shower was traced with steam. When visiting the plant in mid-winter, with snow on the ground, this young engineer was escorted by the superintendent to review the work progress. The superintendent wanted to demonstrate the use of his new safety shower by turning it on. A cloud of steam and scalding condensate came forth from the showerhead. Luckily, nobody was under the shower, though it did clear the snow in the immediate area. Proper design with a steam pressure reducing station may have eliminated the problem. However, electric tracing the water line should have been considered.

Water lines don’t always have to be traced and insulated, but water must be flowing in the line. This is known as bleeding the line. Tests indicate that the flow versus the outside temperature to prevent freezing is approximately a straight line function, which varies from no flow required with an outdoor temperature of 33 degrees F to 40 degrees F to an outdoor temperature of minus 20 degrees F or below.

Figure/Table 1 illustrates the minimum flow or bleed rates of water in gallons per minute, required for each 100 feet of pipe.

Process Systems

Process systems should be evaluated not only on the extreme cold outdoor temperature, but also on the time duration the process system is exposed to the extreme temperature.

The best way to explain the design process is by the following example.

A client in Billings, Mont., has a 4-inch water pipeline that will be shut off (the pipe can’t be drained or bled) over an extended period of time during the winter months.

Design Data
  • The minimum ambient temperature is minus 15 degrees F.

  • Wind speed is 20 mph.

  • The line is welded, schedule 40, carbon steel and 300 feet long.

  • The line has 2 gate valves and 6 flanges (150 pounds).

  • Maintain water temperature at or above 35 degrees F.

  • Water entry source temperature is 55 degrees F.

  • Climactic data for that area indicates that the temperature can be minus 15 degrees F continuously for 24 hours.

Will the water temperature drop below 35 degrees F in the 4-inch pipe during the 24 hour period if it’s NOT insulated? To find out, follow these steps:

  1. All materials contain energy or commonly known as latent heat. The latent heat will vary according to the material and temperature. In this case the material is water. See technical manuals for the latent heat of other materials.

  2. See Figure/Table 3. At 55 degrees F, the water weight is 62.38 pounds/cubic foot and the latent heat is 23.06 Btu/pound. At 35 degrees F, the water weight is 62.42 pound/cubic foot and the latent heat is 3.02 Btu/pound. The difference in the weight of water is so slight that it can be disregarded.

  3. Multiply the weight of the water per foot in the 4-inch pipe (Figure/Table 2) by the latent heat; 5.51 x 23.06 = 127 Btu/hour /foot of latent heat at 55 degrees F. 5.51 x 3.02 = 16.6 Btu/hour/foot of latent heat at 35 degrees F.

  4. Subtract 16.6 from 127 = 110.4 Btu/hour/foot.

  5. Go to the 3E Plus® 3.0 program and tab the Energy Loss/Gain button.

    • For this exercise, indicate perlite insulation.

    • For the finish, it’s 0.1 emissivity for plain aluminum (type finish has almost no effect).

    • Select the horizontal cylinder for the surface geometry.

    • Be sure to indicate one hour in the Annual Operation Box.

    • The wind speed is 20 mph. An accurate average wind speed in this case, in mid-winter, can increase the heat loss from 12 percent to 4 percent, depending on the insulation thickness selected. (See Figure/Table 3 for reference only).

    • For pipe size, indicate 4-1/2 inches. The traced system will require oversized insulation to accommodate the tracer. Run the program with water and extreme ambient temperatures of 55 degrees F and minus 15 degrees F respectively. The program data indicates 19.56 Btu/hour/foot. Also run a water and ambient temperature of 35 degrees F and minus 15 degrees F respectively. The program data indicates 13.84 Btu/hour/foot.

  6. Remember, we can only lose 110.4 Btu/hour/foot to stay at 35 degrees F or above.

  7. Find the average heat loss between 55 degrees F and 35 degrees F (19.56 + 13.84/2 = 16.7 Btu/hour/foot).

  8. The 3 inches of perlite silicate insulation will allow 16.7 Btu/hour/foot. Dividing the allowable Btu of 110.4 by 16.7 = 6.61 hours when the pipe temperature will reach 35 degrees F. The 6.61 hours is far short of the 24 hour period.

  9. Run a program using the same data, but substitute 3 inches of PIR (polyisocyanurate) insulation.

  10. The data indicates 7.550 and 5.454 with an average of 6.5 Btu/hour/foot heat loss. Dividing the allowable Btu of 110.4 by 6.5 = 17 hours. Again, this is still short of the 24 hour period.

  11. Additional programs can be run using insulation with improved thermal conductivity, such as phenolic, and increasing the insulation thickness. However, the results for this example are impractical.

  12. Electric tracing the 4-inch pipe appears to be the viable option.
Determining the Appropriate Heat Tracer

Next, determine the appropriate type electric heat tracer for the following project.

  1. (a.) Find the wattage required for the 4-inch pipe. Refer to Figure/Table 5. Design for 1.5-inch-thick insulation with a differential temperature (Delta T) of 35 degrees F and minus 15 degrees equals 50 degrees F. Note that temperatures aren’t shown, so adjust wattage by interpolation.

    (b) Figure/Table 5 indicates under 4-inch pipe a heat loss of 4.1 watts/foot. Since oversize insulation is recommended on traced systems, consider using insulation with an I.D. for 5 inch pipe. Interpolate the average of 4 and 6 inch pipe (4.1+5.6/2 = 4.9 watts/foot).

    (c) Refer to Figure/Table 4. The multiplying factor for PIR at 100 degrees F mean temperature equals .76. This reduces the wattage to 4.9 x .76 = 3.8 watts/foot.

    (d) The wind conditions are greater than stated for the wattage in Figure/Table 5. Therefore, refer to Figure/Table 7. With 1-1/2 inch thick insulation, the table indicates only a 1 percent difference between a wind velocity of 15 mph and 20 mph. The required wattage can be rounded off to 3.9 watts/foot.

    (e) Find the wattage required for the valves and flanges. Refer to Figure/Table 6. The line has 2 gate valves and 6 flanges. Again use the average between 4- and 6-inch pipe for oversize insulation. For the gate valves, 5.5+ 6/2 equals 5.75 x 3.9 watts/foot = 22.5 watts/valve.

  2. For 150 pound flanges, 1.4 x 3.9 watts/foot = 5.5 watts/flange. Total wattage for fittings is 2 x 22.5 equals 45 watts, plus 6 x 5.5 = 33 watts.

    (f) The tracer must provide 3.9 watts/foot for a total length, including valves and flanges of 300 + 5.75(2) + 1.4(6) = 320 feet.

    For conditions similar to the previous example, when designing for freeze protection, where the power output is below a constant 10 watts, the cable (wire) temperature can be held below 212 degrees F (100 degrees C). Therefore, almost any type insulation can be applied without exceeding the temperature limit.

  3. After reviewing the various types of heat tracers that follow, it appears that the most cost-effective selection is the self-limiting heat-tracer.

  4. The wire size and type, and voltage required can be determined by the cable manufacturer given the previously listed data with the selection of insulation and thickness.

  5. In some cases, where a concentration of heat may be necessary and spiral wrapping isn’t an option, the wattage (heat transfer) can be increased up to eight times by encapsulating the tracer with heat transfer cement (also commonly known as heat transfer medium [HTM]. Contact HTM manufacturers for optimum heat transfer requirements.

  6. When product other than water is in the pipe, the evaluation becomes more complex and beyond the scope of this article.

  7. Equipment, tanks and vessels can be evaluated in much the same way as piping. The wattage (energy) is evaluated in square feet of surface area instead of lineal feet of pipe. Refer to Figure/Table 8.

  8. The wattage derived from this guide is under ideal conditions and doesn’t account for insulation systems with insulation voids, cracks or open joints. HTM manufacturers may provide a wattage percent increase to compensate for any deficiencies.

  9. The type of insulation and thickness for the pipe will have a direct effect on the wattage (energy) required. The thermal conductivity of insulation may only be one consideration when selecting the most cost-effective material. A hostile environment may require insulation that’s completely impervious to moisture and mechanical abuse.

Selection of Heat Tracing

Electrical heat-tracing material consists of a resistance wire, an insulation covering, a grounded outer metal sheath and usually an outer jacket. The heating tracer may be a cable, strip or tape. They can be applied to pipes, valves, flanges, vessels, tanks and other surfaces where heat is required.

The principal considerations in selecting the correct heat tracer is:

  • the energy (wattage) required of the system to be traced.

  • the electrical classification in areas where special environmental conditions exist.

  • the temperature limits for the tracer. This is usually determined by the cable jacket material.

  • the cost considerations.

  • length of pipe, including valves and flanges, to be traced and length of tracer on equipment.

Typical Electrical Heat-Tracers

Single Conductor Resistance Wire
  • This should be limited to piping systems operating no greater than 212 degrees F (100 degrees C) because of wattage limitations and possible damage to the wire jacket.

  • The maximum wattage is determined by the jacket limitations of 390 degrees F (200 degrees C).
Self -Limiting Heat-Tracers
  • Since they are parallel resistance configuration, the tracer can be cut to any length without changing the ratings. This provides easy circuit fabrication in the field.

  • Overheating the pipe is almost impossible because the tracer heat output is reduced as the pipe temperature increases.

  • This cable can supply up to 10 watts per foot at operating voltages to 277 VAC.

  • They can maintain temperatures as high as 250 degrees F (121 degrees C) and 375 degrees F (191 degrees C) when not operating.

  • They shouldn’t be used on piping held at a temperature greater than 151 degrees F (66 degrees C) because of wattage limitations.
Mineral-Insulated (MI) Heat Tracers
  • Mineral insulated cables are recommended for systems requiring high wattage (up to 80 watts per foot), and exposure to high temperatures, up to 1,100 degrees F (593 degrees C).

  • These cables are damage resistant and used in classified hazardous areas.

  • The cable sheath is completely waterproof.
Heat-Tracing Strip
  • Generally, heat tracing strips shouldn’t be used on pipe operating at temperatures greater than 122 degrees F (50 degrees C) since damage could occur to the tracer sheathing.

  • This tracer is recommended for PVC piping and equipment because the wide heat dissipation area allows the tape to be heated slightly higher than the heating surface.

  • Maximum wattage is 24 watts per foot.

  • It shouldn’t be considered for use on piping with valves and flanges.

  • The strip can be cut to any length without changing wattage and voltage ratings.

The previous information is for general consideration only, and may not agree with every electrical heat- tracing manufacturer.

Safety Issues

The National Electric Code (NEC) that’s referenced in the Occupational Safety Health Administration Section 1910.309 mandates guidelines that must be followed. It’s important that the engineer review the latest requirements with the heat-tracing manufacturer.

There are several basic safety items that must be considered in heat tracing. The following lists a number of those considerations.

  • All electrical heat traced systems shall be conspicuously identified as "electric traced" a minimum every 10 feet outside the insulation finish.

  • The heat-tracer shall be secured to the pipe surface at least at 12 inch spacing.

  • All heat-tracer connectors and splicing concealed by the insulation should be marked as such outside the insulation system.

  • There should be lock-out provisions for system maintenance.

  • Electric heat tracers shall have a continuous metal sheath, wire braid or cover that’s grounded.

  • Electric heat tracers shall be approved for the class they’re to be located.

  • The manufacturer shall determine that the tracer sheath temperature isn’t exceeded.

  • Where flammable material is heated, the tracer must not exceed 80 percent in degrees C, the minimum auto-ignition temperature.

  • The thermal insulation must be rated for the maximum temperature of the electric heat-tracer.

  • Electrical heat-tracers shall not cross over itself and be separated by a minimum of 1 inch, since this condition can cause excessive overheating to the sheathing and eventual failure.

Installation Practices

(Refer to Figures 9 through 11)

Notes:

  1. Where one electric heat-tracer is used, it may be installed on either side (Figure 9).
    1. Electric heat tracers shall be installed in a air plenum between the pipe and the insulation. Grooving the insulation to accommodate the tracer isn’t acceptable.
    2. Only preformed pipe insulation should be used. Blanket or loose insulation will close the space.
    3. Generally, oversize insulation isn’t required for heating strips, providing the preformed insulation can be tightly closed at the joints.
  2. Electric traced piping shall be supported outside the insulation.
  3. Tracers should be secured in three places at pipe elbows.
  4. The heat tracers shall be installed on valves and flanges so that they can be pulled aside for maintenance.
  5. The pipe and equipment surface must be clean and free of rust, grease or any foreign matter.
  6. Install the tracer before cutting the length. There should be no excess length.
    1. Only the cold part of the tracer should pass through the insulation with a conduit.
    2. In areas where the insulation can get wet, seal around the conduit where it passes through the insulation finish with a bead of silicone sealant.
    1. The tracers can be temporarily secured to pipe with stainless steel wire. After adjustments with the tracer is completed, secure the tracers with stainless steel banding a maximum 12 inches on center.
    2. Where the tracer doesn’t make contact with the heating surface, additional banding may be required.
    3. Where the heat tracer is spirally wrapped, securement is only required at the each end.
  7. Where a space can’t be avoided between the tracer and the surface, pack the void with heat transfer cement.
  8. Screws shall not be used to secure insulation finishes on an electric traced system.

The electric heat-tracer system should be installed correctly by an electrician. However, the insulation contractor shall also install the insulation system correctly to prevent the intrusion of moisture, so the traced system can perform at its optimum design level.

Figure 1
Figure 2
Figure 3
Figure 4
Figure 5
Figure 6
Figure 7
Figure 8
Figure 9

Left: Horizontal pipe, oversized insulatuion. Right: Vertical pipe, oversized insulation.

Figure 10

Left: Pipe flange detail. Right: Valve detail.

Figure 11

Traced vertical pipe.

From the Energy Information Administration

Electricity is an integral part of life in the United States. It’s indispensable to factories, commercial establishments, homes, and even most recreational facilities. Lack of electricity causes not only inconvenience, but also economic loss due to reduced industrial production.

According to officials at the Edison Electrical Institute, prospects for new electricity capacity are mixed. Due to the uncertain economy, demand is flat, and a number of planned projects have been postponed or shelved due to lack of funding. The North American Reliability Council (NERC), in its Electricity Supply and Demand Database, said that 750,771 total megawatts of generating capacity was produced in the summer of 2000 in the United Sates. (Summer is the peak capacity demand period). A megawatt is one thousand kilowatts (1,000 kW) or one million (1 million watts). One megawatt-hour represents one hour of electricity consumption at a constant rate of 1 MW. For 2002, the NERC projected summer capacity was 836,140 megawatts. For 2003, it’s projected at 865,853. The numbers will continue to rise through the rest of the decade, with 952,777 megawatts projected by 2010. The figures are calculated in part from previous capacity and usage trends.

Electric Power

Electric power is the rate at which electricity does work-measured at a point in time, that is, with no time dimension. The unit of measure for electric power is a watt. The maximum amount of electric power that a piece of electrical equipment can accommodate is the capacity or capability of that equipment.

Electric energy is the amount of work that can be done by electricity. The unit of measure for electric energy is a watthour. Electric energy is measured over a period of time and has a time dimension as well an energy dimension. The amount of electric energy produced or used during a specified period of time by a piece of electrical equipment is referred to as generation or consumption.

Electricity Generation

Electricity generation is measured in kilowatthours. Various sources of energy are used to generate electricity, including fossil fuels, uranium, water, solar, geothermal, and biomass.

Gross generation is the amount of power produced by an electric power plant (station), measured at the terminals of the plant (that is, prior to the point at which the power leaves the station and is available to the system). Some of the electric power generated at a power plant is used to operate equipment at the plant; plant use (or "in-house use") generally ranges between 1 percent (for hydroelectric units) and 7 percent (for steam-electric units). Net generation is the power available to the system (gross generation less use at the plant); however, it’s greater than that available to consumers due to losses during transmission and distribution (approximately 8 to 9 percent). Note that the measure used for electric utilities is net and for nonutility facilities is gross generation.

Electricity Generation from Fossil Fuels

Fossil fuels supply about 70 percent of the United States’ requirements for electricity generation. Currently, the dominant fossil fuels used by the industry are coal, petroleum and gas. Other fossil fuels include petroleum coke, refinery gas, coke oven gas, blast furnace gas and liquefied petroleum gas.

Coal

Historically, most generation of electricity in the United States has been from coal. Coal-fired generation became even more important following the Organization of Petroleum Exporting Countries (OPEC) oil embargo of 1973 due to concerns over the availability of petroleum imports, increasing petroleum costs, and curtailments of natural gas. In 1978, the passage of the Powerplant and Industrial Fuel Use Act and the Natural Gas Policy Act encouraged further use of coal by electric utilities. Although both federal and state environmental laws and regulations existed during the 1970s, renewed interest in environmental issues raised concerns about electric power plant emissions, particularly from those plants burning coal. The Clean Air Act Amendments of 1990 established a goal of a 10-million-ton reduction in sulfur dioxide emissions and a 2-million-ton reduction in nitrogen oxide emissions from 1980 levels by 2000.

Petroleum

During the early 1970s, electric utilities used petroleum extensively to generate electricity. However, after the 1973 embargo by OPEC on petroleum exports to the United States, petroleum prices rose sharply. Further price increases occurred in 1979 and 1980 following the Iranian revolution and subsequent reductions in Iranian petroleum exports. Consequently during the past decade, utilities haven’t built large, petroleum-fired steam units. In addition, many utilities have either converted steam units to coal or switched fuels where dual-fired capability exists. Most of the utilities that still rely heavily on petroleum to generate electricity are located along the eastern seaboard.

Gas

The demand for gas (primarily natural gas) to heat homes and serve business and industry has historically taken priority over demand from electric utilities under both federal and state regulations. In the 1970s, many utilities were on occasion denied gas when available pipelines reached capacity in serving heating demand during the months from November to March (the peak heating season). By the middle 1970s, curtailments to electric utilities also occasionally occurred during the nonheating season as producers conserved supply in preparation for heating season demand.

In the face of an attractive interstate price structure, but deprived of supplies during many months of the year, utilities in the 1970s used relatively less expensive gas when it was available, then switched to other more expensive fuels when gas supplies were curtailed. Gas became more available to utilities with the passage of the Natural Gas Policy Act of 1978 and more frequent exemptions from the gas-use restrictions of the Powerplant and Industrial Fuel Use Act (Fuel Use Act) of 1978. Amendments to the Fuel Use Act in 1987 created potential for additional use of gas. These amendments eased restrictions on the use of gas by removing a legal requirement to obtain an exemption for the construction of new gas-fired generating capability.

Nuclear-Powered Generation

Generation from nuclear power has generally increased since the 1950s, and this trend continues. Since 1984, nuclear plants have provided the second largest share of total U.S. electric utility generation of electricity, after coal-fired plants. Nuclear generation accounted for 14 percent of total utility net generation.

Generation from Renewable Fuels

Hydroelectric

Water is currently the leading renewable energy source used by electric utilities to generate electric power. Hydroelectric plants operate where suitable waterways are available; many of the best of these sites have already been developed. Generating electricity using water has several advantages. The major advantage is that water, a renewable resource, is a source of cheap power. In addition, because there is no fuel combustion, there is little air pollution in comparison with fossil fuel plants and limited thermal pollution compared with nuclear plants.

Like other energy sources, the use of water for generation has limitations, including environmental impacts caused by damming rivers and streams, which affects the habitats of the local plant, fish, and animal life. Seventy percent of the hydroelectric power in the United States is generated in the Pacific and Rocky Mountain States.

Other Sources

Other renewable resources-geothermal (heat energy beneath the surface of the earth), wood, waste, wind, and the sun (solar)-are energy sources that are constantly replenished.

Currently, renewable resources (other than water) supply less than 1 percent of the electricity generated by electric utilities. Most of the electricity produced from this category is from geothermal power. Electric utilities currently operate geothermal plants in two states (California and Utah). The Geysers, operated by the Pacific Gas and Electric Company, is the largest geothermal plant in the United States. Only a few utilities operate units that produce electricity from wind and solar energy. Wood and waste resources can be used to replace fossil fuels in utility boilers.

Environmental Aspects

When fossil fuels are burned to generate electricity, a variety of gases and particulates are formed. If these gases and particulates aren’t captured by some pollution control equipment, they’re released into the atmosphere. This overview provides a brief summary of the gaseous emissions from U.S. electric utilities and the methods employed to reduce or eliminate their release into the atmosphere. Among the gases emitted during the burning of fossil fuels are sulfur dioxide (SO2), nitrogen oxides (NOx), and carbon dioxide (CO2).

Electric Utilities

The more than 3,170 traditional electric utilities in the United States are responsible for ensuring an adequate and reliable source of electricity to all consumers in their service territories at a reasonable cost. Electric utilities include investor-owned, publicly owned, cooperatives, and federal utilities. Power marketers are also considered electric utilities-these entities buy and sell electricity, but usually do not own or operate generation, transmission, or distribution facilities. Utilities are regulated by local, state, and federal authorities.

Generally, interstate activities (those that cross state lines) are subject to federal regulation, while intrastate activities are subject to state regulation. Wholesale rates (sales and purchases between electric utilities), licensing of hydroelectric facilities, questions of nuclear safety and high-level nuclear waste disposal, and environmental regulation are federal concerns. Approval for most plant and transmission line construction and retail rate levels are state regulatory functions.

State public service commissions have jurisdiction primarily over the large, vertically integrated, investor-owned electric utilities that own more than 75 percent of the nation’s generating and transmission capacity and serve about 75 percent of ultimate consumers. There are 239 investor-owned electric utilities, 2,009 publicly owned electric utilities, 912 consumer-owned rural electric cooperatives, and 10 federal electric utilities. Approximately 20 states regulate cooperatives, and seven states regulate municipal electric utilities; many state legislatures, however, defer this control to local municipal officials or cooperative members.

Nonutility Power Producers

The approximately 2,110 nonutility power producers in the United States include:

  • facilities that qualify under the Public Utility Regulatory Policies Act of 1978 (PURPA).

  • cogeneration facilities that produce steam and electricity, but that are engaged in business activities other than the sale of electricity.

  • independent power producers that produce and sell electricity on the wholesale market at nonregulated rates, but don’t have franchised service territories.

  • exempt wholesale generators under the Energy Policy Act of 1992 (EPACT).

Traditional Electric Utilities

The U.S. electric power industry is composed of traditional electric utilities, including power marketers, and nonutility power producers. Utility service territories are geographically distinct from one another. Each territory is usually composed of many different types of consumers. Electricity consumers are divided into classes of service or sectors (residential, commercial, industrial, and other) based on the type of service they receive. Sectorial classification of consumers is determined by each utility and is based on various criteria such as:

  • demand levels.

  • rate schedules.

  • North American Industry Classification System (NAIC) Codes.

  • distribution voltage.

  • accounting methods.

  • end-use applications.

  • other social and economic characteristics.

Electric utilities use consumer classifications for planning (for example, load growth and peak demand) and for determining their sales and revenue requirements (costs of service) in order to derive their rates. Utilities typically employ a number of rate schedules for a single sector. The alternative rate schedules reflect consumers’ varying consumption levels and patterns and the associated impact on the utility’s costs of providing electrical service. Reclassification of consumers, usually between the commercial and industrial sectors, may occur from year to year due to changes in demand level, economic factors, or other factors.

Residential Sector

The residential sector includes private households and apartment buildings where energy is consumed primarily for:

  • space heating.

  • water heating.

  • air conditioning.

  • lighting.

  • refrigeration.

  • cooking.

  • clothes drying.

Commercial Sector

The commercial sector includes nonmanufacturing business establishments such as:

  • hotels.

  • motels.

  • restaurants.

  • wholesale businesses.

  • retail stores.

  • health, social, and educational institutions.

Sometimes the commercial sector also includes small manufacturing facilities.

Industrial Sector

The industrial sector includes:

  • manufacturing.

  • construction.

  • mining.

  • agriculture.

  • fishing.

  • forestry establishments.

An electric utility may classify commercial and industrial consumers based on either NAIC codes or demand and/or usage falling within specified limits, set by the electric utility based on different rate schedules.

The other sector includes public street and highway lighting; railroads and railways; municipalities, divisions or agencies of state and federal governments under special contracts or agreements; and other utility departments, as defined by the pertinent regulatory agency and/or electric utility.

The Changing Electric Power Industry

The electric power industry is evolving from a highly regulated, monopolistic industry with traditionally structured electric utilities to a less regulated, competitive industry. PURPA opened up competition in the generation market with the creation of qualifying facilities. EPACT removed some constraints on ownership of electric generation facilities and encouraged increased competition in the wholesale electric power business.

Continuing deregulation at both federal and state levels is transforming the historically monopolistic electric power industry into a competitive industry that will eventually increase competition in its generation and service components, and change the nature of the way electricity is priced, traded, and marketed in the United States.

The Energy Information Administration (EIA), created by Congress in 1977, is a statistical agency of the U.S. Department of Energy. The EIA can be reached by calling (202) 586-8800 or by visiting www.eia.doe.gov.

Saving energy is a very important topic and issue here in United States. So much so that President Bush has been quoted as saying, "Energy is a problem that requires action, not politics, not excuses, but action." So much of what we read and hear concerning "saving energy" is directed toward process and equipment such as steam traps and motors. I believe that the action President Bush spoke of should be directed toward the steam-generating boiler and specifically those boilers that have cyclone burners. Cyclone burners use more energy (oil, gas, and coal) than any other component or equipment found at an industrial or power generating facility.

A "Cyclone Burner" is sometimes called a "Cyclone Furnace." For now, we shall refer to them only as "cyclones," though they aren’t to be confused with the "cyclones" on a circulating fluidized bed boiler. To describe briefly, cyclones are a component of a cyclone fired steam-generating boiler that’s used to burn the coal to create the fire or heat in the furnace area (around 2,300 degrees fahrenheit [F]) so the boiler can meet its steam and heat requirements. They are an energy-consuming component that’s made up of three basic parts:

  1. The burner area at the back end, which ignites the coal by using oil or gas.

  2. The barrel area where the coal and air are mixed in a swirling or "cyclone" action and ignited by the oil or gas fired burners.

  3. The re-entrant throat where the fire from the ignited coal is forced into the furnace area of the boiler.

The cyclone barrel, re-entrant throat and burner throat areas are comprised of small tubes (1-1/8 inch to 1-1/4 inch in diameter) and are pin-or-flat studded. The refractory material is required on the studs and tubes for protection from the swirling (or cyclone) action of coal and from the slag created when the coal is burned.

Many things have changed over the years since the first cyclone boiler was introduced into the industry back in the early 1940s, but very little has changed to the application of the refractory. In the beginning, chrome plastic material was used and was referred to as plastic chrome ore. It was inexpensive and was rammed through the pin studs back to the tube surface. Kromight Gun (a brand name manufactured by the then Babcock & Wilcox Refractory Division) was another inexpensive gun-applied product.

These chrome-based products worked well in this hostile environment. Since the materials were less than $300 per ton, the total cost (per cyclone) to replace the refractory was relatively cheap. Unfortunately, chrome products are a potential health hazard and must be avoided. Today the products available are non-chrome based (high alumina or silicon carbide) and are almost six times the cost per ton (almost $1 per pound or $2,000 per ton) but the man-hours and quantity of material required remain almost the same.

Cyclones use oil or gas for the burners/igniters and coal to generate the furnace heat. The refractory that goes in the cyclone is a main contributor to its efficiency in burning coal. If the refractory fails to do its job then the cyclone will not operate efficiently-it will take more coal to meet the boilers’ steam and heat requirements. After the refractory fails it won’t be long before the cyclone itself will fail when the tube surface (and pin studs) is left exposed to the corrosive and abrasive nature of burning coal in a cyclone. Refractory is an energy saver because it has a direct affect on lower fuel costs (5 percent to 7 percent per year) and equipment and maintenance savings.

Lower fuel costs naturally coincide with lower equipment and maintenance costs. These savings are the result of properly installed refractory. Refractory can save energy and money at a rate that’s essential for efficient plant operation. The longer the refractory lining stays in place, the longer the boiler can remain in normal operation.

Longer Lasting Linings

There are several basic steps to follow for longer lasting linings. First, examine the existing refractory (or the lack thereof). Second, select the right materials. Next, properly mix and handle. Finally, follow the correct curing and dry out procedures.

Step 1: Examine the Existing Refractory

When replacing old refractory material, don’t automatically use the same material as the original. It’s better to examine the reasons for failure and adjust the selection accordingly. Ask yourself: Did the material spall due to thermal shock? Has it shrunk due to temperatures above its use limit? Does that gouge in the refractory lining indicate mechanical abuse? If the surface appears "glassy," is it due to operation at temperatures above the use limit? Does the lack of material indicate improper installation? The old refractory lining will offer several good clues.

Step 2: Select the Right Materials

Look at all service conditions (coal type, ash content and air temperature, to name several examples) before choosing a material. Refractory materials vary widely in temperature use limits, thermal shock resistance, and abrasion resistance. Pick a refractory material with the best combination of properties for your application and type of fuel you’re using. Refractory selection can now be considered using the data from Step 1 and knowing which application will be required or desired.

Step 3: Mix and Handle Properly

Most problems with refractory materials can be traced to improper handling or mixing. Care must always be taken in the storage of any type of refractory materials. They should always be stored in dry, well-ventilated conditions. This will ensure that the refractory will not lose any strength and should give the refractory material a shelf life of up to one year.

If the material is stored improperly, where the bags or boxes can become wet or exposed to dampness for extended periods, a certain amount of moisture may get into the material and cause a partial setting-up of the refractory. The refractory materials used in cyclones are too expensive to waste. Make sure that you check the manufactured date on the bags. For your cyclones, always have your refractory made just prior to the outage or installation and never use any refractory material that was manufactured more than six months prior to the installation.

Paying attention to the four following points should produce a serviceable lining in your cyclones:

Proper Proportions

The proper amount of water is essential if you’re gunning a refractory material. True, a wetter mix handles more easily, but it robs the refractory material of its needed strength. Too dry a mix, on the other hand, is difficult to place and it may set to a weak, porous, "popcorn" structure. A proper mix will usually seem on the thick side compared with conventional concrete.

Cleanliness

Many common industrial compounds can easily contaminate a refractory mix, and seriously affect its performance. Certain salts, for example, react with the binder to make it useless. So be sure to use clean water and clean mixing and handling equipment. Also, it’s best to use potable water because it is free of minerals normally found in tap water. Those minerals could affect the castable’s ability to reach its proper strength.

The Right Mixer

It’s vital to know that some gun-applied materials will require pre-wetting. This is important to know to make certain that your installing contractor isn’t using a continuous feed mixer. The continuous feed method means the dry material is dumped into a hopper and the water is only added at the nozzle. This could impact the ability for that refractory to meet its proper strength. For a refractory used in cyclones, reaching its proper strength is imperative.

Cold Weather

In cold weather, the strength of a refractory (plastic or castable) will be adversely affected if the material is installed in freezing temperatures or if mixed with cold water. It’s recommended by almost all manufacturers of refractory that both the material and the water temperature are in a range of 50 degrees to 70 degrees F.

Step 4: Curing and Drying

Once you have properly installed the refractory material, it must then be cured and dried. It’s only after the refractory has been cured and dried will the refractory be capable of performing as it was designed to do. All refractory materials except those that are phosphate bonded must be cured prior to the dry-out. Unfortunately, a lot of people don’t cure the cyclone refractory after installation. This is the number one reason for cyclone refractory failure or lack of longevity, because curing allows the chemical action to take place inside the refractory and assures that the refractory can reach its maximum strengths.

The cyclone refractory is normally dried separately from the rest of the boiler refractory. This is done by closing off the re-entrant throat opening and drying the refractory inside each cyclone separately. It’s very important to understand the temperature "hold" points and to have thermocouples inside the cyclones to monitor temperatures. Drying allows the refractory material to reach is maximum strength.

Know Your Quantities

Cyclones come in four sizes based on their barrel diameter (7, 8, 9 and 10 feet). Understand that the refractory material, regardless of the type, should always follow the contour of the tubes, as opposed to being flat or straight across. This is also known as "filling in the valleys." The refractory should be calculated for ordering and then installed to the top of the pin studs. Any material 1/8 inch or more over the studs will be gone soon after you fire your boiler into operation. The refractory materials are too expensive to waste by installing it too thick.

I recommend that all plant operations personnel know the exact amounts of material that’s required for their cyclones. It’s not hard to calculate. Once you have determined the amount of materials, you can compare material costs (remember, each product may have a different density) and compare labor applications if you’re comparing a gun-applied material versus a rammed material.

It doesn’t take long when calculating with a Lotus or Excel program. A plant only has to calculate for the size it has. As an energy consultant, my computer has each area (cyclone side re-entrant throat, furnace side re-entrant throat, cyclone side burner throat, furnace side burner throat, cyclone front closure, and barrel) broken down separately. This allows for efficient, quick and exact calculations. Additionally, I have done the same for labor and material estimates for both a rammed and gunned product. This allows for a thorough review when choosing between different products, taking into consideration the difference of material density and application.

Savings Significant when Done Correctly

Materials and refractory installation costs are very small compared to most components found in either the industrial or power boiler industry that’s using cyclones. Power plants can spend as much as $75,000 per cyclone per year. Refractory materials and their installation can cost as much as 20 percent of this yearly expenditure due to improper material selection or installation.

Refractory failure is a major contributor in boiler shutdowns. Refractory, properly designed and installed in your cyclones will last longer, minimizing the amount of shutdowns required, and save 5 percent to 7 percent in your annual fuel cost (oil, gas and coal). So pay attention to all aspects of the refractory materials that go into your cyclones and remember that improperly designed, specified, stored, installed, cured or dried, refractory will have an adverse affect upon energy usage and boiler operation. That’s why experts say, "Refractory installed to save energy also saves money at a rate that is essential for efficient plant operation."

References
  • ASTM C-64

  • Refractories in the Generation of Steam Power – McGraw-Hill Book Company, F. H. Norton (1949)

Achieving operational excellence is a continuous task for all manufacturers working to reduce costs and keep their plants profitable. Luckily, many opportunities exist for industrial plants to cut costs without jeopardizing jobs or the environment. For example, more than 50 percent of the input fuel used by the U.S. manufacturing sector is used to generate steam. More importantly, in a typical facility, a 20 percent to 30 percent improvement in steam system efficiency (the ability to meet their steam needs with 20 to 30 percent less fuel), is possible.

At an estimated annual cost of $18 billion for fuel, alone, in the 33,000 boilers used by industry, reducing steam fuel use can improve profits nationally. The chemicals industry can particularly benefit as it’s very steam intensive; steam production accounts for more than 50 percent of fuel used by the sector. Other sectors which benefit through steam system improvements include pulp and paper, food processors, steel mills, petroleum refining, and textiles.

Common areas in which to look for savings opportunities in steam generation, distribution, end use and recovery are outlined as follows. Insulation is a key component in this equation. By determining which are the most appropriate at a given plant, a good start can be made on improving the productivity and reliability of the plant, while cutting unnecessary costs.

Steam Generation

Demand Reduction

The boilers may well be producing more steam than is needed for the end uses. Evaluation of demand is especially important when downstream improvements such as insulation and condensate return are implemented-lower loss means lower generation needs. At Nalco Chemical Co.’s Clearing Plant in Bedford Park, Ill., a process engineer determined that a steam header pressure of 125 psig was no longer necessary due to changes in the some of the plant’s processes. A team of personnel from the maintenance, utilities, and production departments evaluated the feasibility of reducing the header pressure and decided to incrementally decrease header pressure while monitoring the effects of this change on system performance.

The pressure was reduced twice, first to 115 psig, and then to 100 psig. After determining no detrimental impacts on system operation, Nalco now operates the system at 100 psig, resulting in annual energy savings of 8 percent, far exceeding initial expectations, and saving $142,000 annually along with reduced carbon emissions. For this work, the plant received a 1997 Chemical Manufacturers Association Energy Efficiency Award.

In addition to a straight boiler generation reduction, a specific end use pressure might be reduced. As part of its Operational Excellence Program, Vulcan Chemicals, a business group of the Vulcan Materials Co., implemented a process optimization project involving two chloromethane production units. This four-month project required no capital investment and resulted in a reduction in process steam demand and significant cost savings. Vulcan lowered the steam system pressure in the first distillation column from 35 to 26 psig. This gave them a lower condensing temperature that requires less reflux during component separation. Average reboiler steam demand per unit of product decreased by almost 6 percent and resulted in yearly cost savings of $42,000. This plant also received a Chemical Manufacturers Association Energy Efficiency Award in 1997 for the project.

Boiler Tune-Up

The major areas of opportunity in boiler tune-up encompass excess air and blowdown optimization. Optimum excess air minimizes stack heat loss from extra air flow while ensuring complete fuel combustion. Stack temperature and flue gas oxygen (or carbon dioxide) content are the primary indicators of the appropriate excess air level; an adequately- designed system should be able to attain a 10 percent excess air level. The required action is to monitor flue gas composition regularly with gas absorbing test kits or computer-based analyzers. Highly variable steam flows or fuel composition may require an online oxygen analyzer, also called oxygen trim control.

Optimizing boiler blowdown helps keep steam quality high for effective production, while reducing fuel and water treatment expenses. Blowdown rates typically range from 4 to 8 percent. Relatively pure feedwater may require less, where high solids content water requires more. Extensive operating practices have been developed by an AIChE sister organization, the American Society for Mechanical Engineers (ASME). These blowdown practices depend on operating pressures, steam purity needs, and water deposit sensitivity of the system. For best blowdown results, investigate the ASME guidelines and also look into continuous blowdown control systems to help maintain optimal blowdown levels.

Clean Heat Transfer

Scale build-up can cause safety hazards from heat exchanger tube failure and boiler metal overheating, in addition to excess fuel use of up to 5 percent. Heat transfer surfaces can be kept relatively clean by pretreating boiler makeup water with water softeners, reverse osmosis, and/or demineralizers, treating returned condensate, if needed, and adopting proper blowdown practices. Remove existing scale either mechanically or through acid cleaning. It can also be useful to consult a specialist in water treatment.

Auxiliary Equipment

In addition to the automatic blowdown control system and oxygen trim control already mentioned, other equipment which can increase boiler efficiency include economizers, blowdown heat recovery systems, and controls.

Economizers transfer heat from the flue gas to the feedwater, and are appropriate when insufficient heat transfer (assuming heat transfer is clean of scale) exists within the boiler to remove combustion heat. Good boiler candidates are those above 100 boiler horsepower. Determine the stack temperature and minimum stack temperature to avoid corrosion (250 degrees Celsius [C] if natural gas is the fuel; 300 degrees C for coal and low sulfur oils; and 350 degrees C for high sulfur oils) after tuning the boiler to manufacturer specifications. This will help indicate whether an economizer makes sense economically in the plant. Blowdown heat recovery systems preheat boiler make-up water using the blowdown water removed and make sense in continuous boiler blowdown systems. Blowdown waste heat can be recovered simply with a heat exchanger, or in a flash tank. For controls, an oxygen trim control system provides feedback to the burner controls to automatically minimize excess combustion air for an optimum air to fuel ratio. This can result in fuel savings of 3 to 5 percent and is useful where fuel composition is highly variable.

Steam Distribution

Insulation

Insulation helps ensure proper steam pressure for production and can reduce radiative heat loss from surfaces by 90 percent. The Department of Energy (DOE) Industrial Assessment Center program demonstrated a savings potential ranging from 3 percent to as high as 13 percent of total natural gas usage on average through insulation installation. The optimum insulation thickness can be calculated with the DOE 3E Plus® software program, created by the North American Insulation Manufacturer’s Association.

Depending on pipe size and temperature, needed insulation thickness may range from 1 inch to more than 8 inches. For steam systems specifically, common insulating materials include fiberglass, mineral fiber, calcium silicate, and cellular glass. Material choice depends on moisture, temperature, physical stress, and other environmental variables. Appropriate actions include: first, insulate steam and condensate return piping, boiler surfaces, and fittings over 120 degrees Fahrenheit (F); second, conduct a survey of the overall facility steam system every five years for deteriorated and wet insulation; and third, repair or replace damaged insulation. As an example, Georgia Pacific’s plywood plant in Madison, Ga., insulated several steam lines leading to its pulp dryers. Using 3E Plus, they determined an optimal insulation for their steam lines and installed mineral fiber insulation. Georgia Pacific found this made their work environment safer and improved process efficiency. Together with steam trap maintenance, the plant reduced its fuel costs by roughly one-third over the year and also lowered emissions- 9.5 million pounds of carbon dioxide (carbon equivalent), 3,500 pounds of SOx, and 26,000 pounds of NOx on an annual basis.

To assist in assessing insulation’s benefits in industrial settings, the National Insulation Association created the Insulation Energy Appraisal Program (IEAP), an initiative designed to give facility/energy managers a better understanding of the true dollar and performance value of an insulated system. It quantifies the amount of energy and actual dollars a facility is losing with its current in-place insulation system and demonstrates the real world benefits of a more efficient system. The IEAP is also a part of the DOE’s Best Practices Allied Partnership program. Almost 300 professionals have been certified through the IEAP and are qualified to perform plant energy inspections and audits. To find out more, call (703) 683-6422.

Steam Leaks

Steam leaks can be dangerous in higher-pressure systems, above and beyond the significant energy waste they represent. Steam leaks are often found at valve stems, unions, pressure regulators, equipment connection flanges, and pipe joints. The first step is to conduct a steam leak survey. Large steam leaks are visible and ultrasonic detectors can identify even very small leaks. Tag the leaks and determine which can be repaired by your maintenance staff and which require service technicians.

Steam Traps

In steam systems that haven’t been maintained for 3 to 5 years, anywhere from 15 to 30 percent of traps may have failed, and regularly-scheduled maintenance should reduce this to under 5 percent of traps. The cost of one medium-sized steam trap that failed to open in an average pressure system might be $3,000 per year and more. Traps can be tested by a range of means, including visual inspection, listening to the sound, pyrometers, and ultrasonic and infrared detectors.

For optimum performance, establish a regular trap inspection, testing, and repair program that includes a reporting mechanism to ensure replicability and provides for documenting energy and dollar savings. Velsicol Chemical’s Chestertown, Md., facility implemented a preventive maintenance (PM) program to identify energy losses in their steam system. Velsicol’s PM program inventoried the plant’s steam traps, trained system operators to identify failed traps, and improved communication between maintenance and production personnel so that failed traps were quickly repaired or replaced.

This program also identified improperly sized traps or traps of the wrong type and planned their replacement. Implementing the program saves Velsicol more than $80,000 annually at an initial cost of just $22,000. It also reduced energy consumption on a per production unit basis by 28 percent, and had a payback of just more than two and a half months. The plant received a 1997 Chemical Manufacturers Association Energy Efficiency Award for the project. The effort reduced annual CO2 emissions by 2,400 tons. Yet another benefit was the reduced worker exposure to treatment chemicals. A large Rohm and Haas methyl methacrylate plant in Kentucky, implementing a similar program, saved nearly $500,000 each year.

Steam Recovery

Condensate Return

Return of high purity condensate reduces boiler blowdown energy losses and makeup water. This saves 15 to 18 percent of the fuel used to heat the cool makeup water, saves the water itself, and saves treatment costs and chemicals. Reduced condensate discharge into the sewer system also reduces disposal costs. Repair condensate return piping leaks for best results. If the condensate return system is absent, estimate the cost of a condensate return system and install one if economically justified.

Flash Steam Recovery

When the pressure of saturated condensate is reduced, a portion of the liquid "flashes" to steam at a lower pressure. This can be intentionally done to generate steam or unintentionally. Flash steam contains anywhere from 10 to 40 percent of the energy content of the original condensate depending on the pressures involved. Often the steam is vented and lost; however, a heat exchanger can be placed in the vent. Inspect vent pipes of receiver tanks and deaerators for excessive flash steam plumes and install heat exchangers. As an example illustrating the economics of steam and condensate recovery, the Bethlehem Steel Burns Harbor plant returned a portion of its warm condenser cooling water exhaust stream to the boiler feedwater and rerouted low pressure waste steam into a steam turbine generator. This, along with a turbine rebuild results in annual savings of approximately 40,000 MWh of electricity, 85,000 MMBtu of natural gas, and nearly $3.3 million. With a cost of $3.4 million more than a standard maintenance overhaul, the project had a simple payback of just over one year. The project also reduced high-temperature water discharge into the harbor and decreased coke-oven and blast-furnace gas emissions by 27.2 million pounds of carbon equivalent, 294,000 pounds of SOx, 370,000 pounds of NOx, 11,600 pounds of PM 10, 1,450 pounds of VOCs, and 14,000 pounds of CO.

Putting It All Together

The previously mentioned tips point out the power of taking a systems approach to energy management. Returning condensate and recovering heat from the end of the process makes true steam demand assessment, clean heat transfer maintenance, environmental emissions control, and fuel use minimization at the boiler easier. Pursuing the systems approach can be facilitated by using the resources of the DOE Office of Industrial Technologies. DOE assistance focuses on helping industry in developing and adopting energy-efficient technologies and practices through voluntary technical assistance programs on plant-wide energy efficiency.

Areas of focus include industry-specific emerging technologies, industrial steam systems, electric motors, drives and pumps, industrial compressed air systems and combined heat and power systems. In conjunction with the Alliance to Save Energy and industry steam experts, a network of resources has been established to help steam-using industrial plants adopt a systems approach to designing, installing and operating boilers, distribution systems, and steam applications. Benefits of the systems approach include lower operating costs, lower emissions, increased plant operation reliability, and increased productivity. Specific resources include:

  • tip sheets.

  • case studies.

  • answers to technical questions.

  • databases of training opportunities, technical tools, references and standards.

  • workshops which bring together public manufacturing resources, private-sector energy management assistance, and peer networking opportunities.

  • plant-wide assessment opportunities.

  • technical papers.

  • project financing guidance tools.

  • publicity and awards through case study data.

Existing resources are available through the Industries of the Future Clearinghouse ([800] 862-2086, clearinghouse@ee.doe.gov), the Web site (www.oit.doe.gov/bestpractices/steam) and the OIT resource room at (202) 586-2090. These resources also include a sourcebook providing a comprehensive steam system overview and references, and a steam scoping software tool providing guidance on how to profile and assess steam systems. Case studies in particular have a lot of power, and many of these are specific to the chemical industry. Internally, case studies help foster success replication for other company facilities as well as achieve internal company recognition. Externally, the company can receive recognition as an industry leader. DOE is available for assistance in case study documentation.

Achieving Full Potential

Too many manufacturing facilities are not achieving their full potential because of poorly operated and maintained steam systems. Steam efficiency lies at that rarely visited intersection of improved economic performance, greater energy efficiency, and environmental benefit. By taking advantage of available public and private energy management resources, any manufacturer can benefit. Continuous improvement and maintenance of steam system efficiency through monitoring and maintenance leads to greater reliability, cost effective production and price competitive products. Follow the accompanying steps to help pursue the systems approach.

  • Walk through your entire steam system by performing an audit.

  • Document the audit results and make appropriate improvements as outlined here.

  • Develop and implement a program for ongoing maintenance. The long-term benefits of system efficiency require continuous improvement through proper operating and maintenance practices.

These steps prevent a system from degrading into a mode of poor performance. Heightened awareness of operating costs and performance implications is key to understanding the importance of steam system management. Additional ways to discover and capture savings opportunities are by sharing experiences within and outside the company, and increasing interaction between facility operations and management to reconcile production and engineering facts with the financial and corporate priorities.

We insulate surfaces for many reasons. The most common include energy savings, personal protection and condensation prevention, along with protecting the environment from greenhouse gases and the deterioration of the ozone layer. Every fall, many people insulate surfaces, primarily pipes, to prevent them from freezing.

Much of this insulation is sold through the do-it-yourself centers. Using insulation to save energy or for personal protection is a fairly very straightforward and common sense concept. However, calculating the correct thickness to prevent condensation is a more complicated proposition because additional environmental factors such as relative humidity and wind speed play a major role in selecting the correct thickness. These added environmental variables are often unknown or vary widely. This is also true when it comes to determining the correct thickness to prevent pipes from freezing in cold weather. As we will see, if the temperature is below freezing for an extended period of time, pipes with no water flowing through them will freeze unless a heat tape is applied to compensate for heat loss. Insulation can prolong the time before pipes freeze, but not prevent it in all cases.

This paper is divided into two sections. First we will look at the effects variables such as ambient temperature, pipe size, fluid temperature and insulation thickness have on the time it takes for pipes to reach freezing temperatures. Second, we will look at some of the variables used to select the correct heat tape/trace for a given condition.

The concept of freeze protection is quite simple-use insulation to maintain the temperature of the fluid in the pipe above the freezing point (32 degrees fahrenheit [F]). Insulation thickness certainly plays a factor in this concept, as increased insulation retards heat flow. Ambient air temperature plays a major role. The lower the ambient temperature (greater temperature differential) the faster heat will be drawn from the residual heat in the fluid in the pipe. Pipe size and fluid temperature play a factor because each effects the amount of residual heat found in the pipe.

Effect of Variables When Considering Freeze Protection

The charts at top left (figures 1, 2 and 3) show the effects of variables when considering freeze protection. These include ambient temperatures, pipe size and fluid temperature.

Other considerations include pipe material and wind speed. Pipe manufactured from PVC provides some added time to freeze because it has a lower k factor than copper. However, there are other factors to be considered when considering PVC versus copper pipe from a material point of view, such as burst strength, and the ability to thaw or repair pipes. Wind speed will tend to slightly decrease the time to reach freezing.

The main difficulty in determining the correct thickness to prevent freezing is the time and ambient temperature factors. It’s often difficult to determine how cold an unheated crawl space, attic or outside wall will get when the temperature drops below freezing. Suffice it to say, if the temperature is low enough for a long period of time, the pipes will freeze without added heat input from either fluid movement (running water) or use of a heat tape/trace with sufficient Btu input to compensate for the Btu loss.

Using insulation by itself to prevent frozen pipes can be recommended in the "southern frost belt" area of the southeastern United States, where temperatures only drop below freezing for short periods of time during the night, while during the day the pipes will have fluid movement. In the northern regions of the United States, where freezing temperatures set in for prolonged periods of time, it’s recommended that a heat tape/trace be used in conjunction with insulation.

When insulating pipes, it’s important to insulate all exposed surfaces, including tees, valves or faucets. Exposed surfaces may cause localized freezing.

Flexible closed cell polyethylene or elastomeric insulation are often used for the purpose of insulating plumbing, both residential and commercial. These lines could be found in crawl spaces, walls, attics or piping in parking garages. Fire sprinkler lines are often insulated as well as in unheated warehouses. The closed cell polyethylene is well suited for these types of applications because of its excellent range of properties (low thermal conductivity and water vapor permeability) and ease of installation (no need for additional water vapor barrier).

Selection of a Heat Tape/Trace

Heat tapes/trace systems have come a long way in the past several years in terms of performance and ease of installation. It’s highly recommended to insulate lines that are heat traced to improve the performance of the heating cables.

The first step in selecting a heat trace system is to match the application and the environmental conditions with the correct heating cable power output. Selection guides are available from the manufacturers of the heating cables for this purpose. Criteria that will have a determining factor on the system selected will be pipe location, pipe size, pipe material, minimum expected ambient temperature, temperature at which the pipe is to be maintained, length of run and the type and thickness of applied insulation. Systems are available for freeze protection (above and below ground) along with flow maintenance applications such as grease or fuel lines. The heat loss through the insulation wall must be balanced with the heat gain provided by the heat trace tape. This balance will prevent the system temperature from escalating above the recommended use temperature for the insulation.

Depending on the application, you may choose a standard outer jacket on the heating cables or a more chemical resistant jacket for industrial applications. The heating cable length depends on the length of the run and the additional footage that may be needed to protect valves, flanges and pipe supports. These areas of high heat loss may require additional footage. In addition, extra cable will be needed for power connections, tees and end seals.

For added power output, higher voltage lines or additional cable strips may be run together. Again, the concept is to balance the heat input with the heat loss, and the type and amount of insulation used will effect this calculation. Typical heat trace tape wattages (per lineal foot) are typically available in 3, 5, 8 and 10 Watt products where 1 Watt = 3.412 Btu/hr.

Cables are designed for easy connections. Most heating cables are now self regulating in terms of temperature control that varies its power output to respond to temperature all along its length. This allows the cable to be cut to length in the field and it saves energy.

Heating cable systems can be controlled either manually, by thermostatic control or self-regulating. All heating cables should be Underwriters Laboratory (UL) Listed, Canadian Standards Approval (CSA) certified, or Factory Mutual (FM) approved for their use. The most common thickness for heat trace tape is 1/4 inch, and will require that the insulation inside diameter is sized properly to fit over both the pipe and the tape. If this isn’t taken into consideration, the longitudinal seam could experience excessive stress. Normally, because of insulation’s flexibility, no adverse effects are to be expected.

Heat Trace Cable System Recommended for Long Term Cold Conditions

Application of insulation will provide protection to pipes from freezing under short term cold conditions. For longer-term conditions, the use of a heat trace cable system is recommended in conjunction with insulation. Flexible closed cell insulation based on polyethylene resin is often used for this purpose because of its performance properties and ease of installation. The use of an insulated heat cable system provides a simple and reliable method to prevent frozen pipes in even the most severe conditions. Today’s heating cable systems have a number of benefits. They have the ability to be overlapped, and there’s no need for a thermostat. Also, they’re designed for energy savings and to eliminate overheating or burnouts.

Figure 1
Figure 2
Figure 3

An insulation system is the combination of insulations, finishes and application methods used to achieve specific design objectives.

Conditions exist in industrial installations, such as power plants, chemical plants, petroleum refineries, steel, pulp and paper mills, meat packing plants, food, soap and cosmetic process plants, and marine work, to name several, which require an insulation systems designer to be involved in the project during the design phase. Depending on the industrial process or function of the installation, these conditions include:

  • stringent control of extreme temperature parameters.

  • corrosive atmospheres resulting from the presence of process chemicals or the location of equipment and piping outdoors.

  • increased fire hazard caused by high temperatures and the presence of volatile substances.

  • presence of operating personnel (personnel protection).

  • sanitary and contamination requirements for food, meat packing, soap, cosmetic, dairy and brewery processes.

  • additional mechanical abuse to insulations from excessive handling, foot traffic on vessel tops and lines, and the added movement of expansion, contraction and vibration.

  • necessity for easy removal of insulation for predictable maintenance areas.

  • critical clearance and space limitations coupled with the need for greater thickness of insulations.

  • complex construction and installation schedules.

  • radiation hazards in nuclear facilities.

  • work accessibility requiring scaffolding, cranes and other items.

Pertinent data concerning the installation design objectives, the materials being processed or used, applicable government regulations or codes, operating data and temperature parameters must be determined far enough in advance of final specification preparation to insure the design of a properly functioning insulation system.

Nature of the Process

The possibility of spillage, leaks and accidental contamination of process chemicals and products is always present in industrial installations. Insulations should be chosen which don’t react to the chemicals contained in the vessels or piping to which they’re applied. Such a reaction may lower the ignition temperature of the process chemical or insulation material, contributing to fire hazard conditions.

Special care should be taken to use non-absorbent insulation in the presence of combustible or toxic liquids. Spontaneous combustion of a combustible liquid absorbed over the large surface area of insulation may occur as it oxidizes. Absorbent insulation may contribute significantly to an accidental fire by storing up the spilled or leaked combustible materials.

United States Department of Agriculture (USDA) standards for food, soap and cosmetic manufacturing plants prohibit use of insulations which sliver or dust, are toxic, or contain glass. Equipment, piping and insulation must be provided with finishes which will not support fungus, mildew or bacteria growth. The finish must resist washing down with high-pressure water, steam and detergents without appreciable deterioration.

In meeting USDA requirements, plastic laminates and finishes excel in their resistance to fungal and bacterial growth although their temperature and mechanical strength limitations pose problems in high pressure wash down areas and under long periods of steam cleaning.

Stainless steel is the most appropriate of the metal jacketing materials, having high resistance to corrosives and bacterial growth as well as high mechanical strength. Aluminum may erode in wash down areas or where strong cleaning chemicals are used. The use of weather and vapor retarder coatings, reinforced with glass cloth or mesh, provides a mechanically strong and sanitary finish for equipment and other irregular surfaces. Many are also resistant to chemicals.

Temperature Parameters of Piping and Equipment

In addition to the reduction of heat loss or gain, industrial insulation systems must maintain controlled temperatures required for process materials being transported from one point in a facility to another. Temperature control may be continuous, intermittent, cyclic or rapidly changed due to weather conditions or the necessity of steam cleaning and wash down periods.

An insulation of high thermal diffusivity, low specific heat and low density is desirable in installations which require rapid heat-up or cool-off of insulated surfaces. A process changing from hot to cold every few minutes requires an insulation that has the ability to change temperature quickly and has very low mass to retain heat.

The temperature of an insulation’s outer surface must be considered where insulation is used for personnel protection or where excessive surface temperatures might cause ignition of fumes or gases. On low temperature installations, surface temperatures must be above dewpoint to prevent condensation and drip. The emissivity property of insulation finishes is significant in these cases. High emissivity is recommended on finishes used for personnel protection treatments.

On installations where temperatures must be maintained at specific levels, it must be decided in the design phase whether added insulation thickness or heat tracing would provide the most efficient service. This decision is based on data other than the conventional economic thickness considerations.

Extreme temperature surfaces in industrial process and power facilities may require the use of materials and application methods which can absorb expansion, contraction and vibration movement. Stainless steel banding or expansion bands are recommended for applications with extreme expansion movement or on large diameter surfaces. Because most high temperature insulations shrink while the metal surface expands, methods such as double layer-staggered joint construction, the design and placement of cushioned expansion joints and/or the use of high rib lath between insulation and metal surfaces may be employed to protect the insulation seal.

Awareness of the nature of the process, its components, the relative temperatures of piping and equipment and the general location of such equipment and substances, aids the specifier in determining areas where excess heat or chemistry may create fire hazards or personnel hazards.

Metal Surfaces Receiving Insulation Treatment

A selected insulation shouldn’t be chemically reactive to the metal over which it’s applied. Basically, insulation installed on steel should be neutral or slightly alkaline. That installed on aluminum should be neutral or slightly acidic.

External stress corrosion cracking of stainless steel may result from the presence of chloride ions on its surface. Insulation containing chlorides or located on a salt-laden or chloride contaminated atmosphere must not be in direct contact with unprotected stainless steel jacketing or surfaces. In the case of stainless steel jacketing, factory-applied moisture barriers on the inner surface may be sufficient protection.

Insulation systems must be designed to prevent possible galvanic cell corrosion to metal piping and equipment. Some industrial, high temperature insulation materials contain salts which, when moist, set up a low voltage galvanic cell with the iron pipe or vessel wall as the positive pole and metal jacketing as the negative pole. This action results in either the pipe/vessel wall or the jacket, sacrificing itself to the point of failure. Humidity levels, temperatures and salt content must be considered when specifying insulation materials, mastics, jacketing and accessories.

Operating Data

The location of instruments and maintenance areas where personnel will be present is significant when specifying treatments for personnel protection and materials abuse protection from foot traffic, excessive handling and operational machinery. Rigid insulation materials and jacketing are recommended in these areas. High-pressure wash down areas require resistance to water and detergents along with high mechanical strength.

Future Access and Maintenance Requirements

Leaks are most likely to occur at valves, fittings and flanges. Low temperature insulation can be protected from leaks by sealing off adjacent insulation with vapor-retarder mastics. Removable fitting covers may be specified at predictable maintenance areas, while special leak detection mechanisms may be installed at other locations. However, on hot applications a rigid inspection and replacement program is the best prevention of large scale insulation destruction due to leakage.

Turbines, which require easy access for inspection and maintenance, can be insulated with removable insulation blankets fabricated from stainless steel mesh or high temperature fabric filled with fibrous insulation. These are attached to turbine surfaces by means of metal eyelets built into the blankets around the edges.

The floor level of large tanks can be protected from spilled chemical or water from wash downs by using a nonabsorbent insulation along the bottom skirt or support, or by sealing with caulking.

Atmospheric Conditions

The atmosphere surrounding industrial piping and equipment presents additional problems in the selection of finishes and jacketing. Of particular concern is the presence of chemicals or humidity which act to corrode metal finishes.

Because of its excellent weather-barrier and mechanical properties, metal jacketing is widely used on industrial installations. The metals most resistant to corrosive chemicals and humidity are stainless steel and coated electro-galvanized steel. Coated aluminum can be used to combat specific conditions by selection of the exact coating required. However, the coatings aren’t always abrasive resistant, leaving the aluminum open to attack at fastener openings and cuts.

Aluminum is weather resistant but doesn’t always hold up in wash down areas or where strong cleaning chemicals are used. Factory-applied moisture barriers are recommended on aluminum jacketing.

The coverings considered most resistant to corrosives and abrasive chemicals are the plastic types. Unless protected, some PVC type coverings may break down when subjected to the effects of ozone, infra-red or ultra-violet rays. Protective paints are available for PVC coverings not manufactured for outdoor use. Weather barrier coatings offer good protection from weather as well as from the chemical attack of acids, alkalies, solvents and salts, either airborne or as a result of intermittent spillage. Glass cloth and other fabric membranes are generally used as reinforcements and add mechanical strength to the insulation.

Maximum protection from chemical attack on cold and dual temperature service is achieved through the use of vapor retarder coatings. They, too, are applied with reinforcing fabric.

Stainless steel jackets and bands are recommended in areas which require superior fire resistance. Stainless steel is recommended over the use of aluminum due to the latter’s lower melting point. Some weather and vapor-retarder mastics also offer fire retardant properties to an insulation system.

Clearances

Because of the complexity of process piping and the added thickness required to control heat loss or gain, clearances often become so minimal that it may be necessary to insulate piping together in groups. This is also true in marine work.

Scheduling and Materials Storage

Precise industrial installation schedules and good application practice often dictate that insulation be finished as soon as possible after roughing in. The chosen materials must have the necessary strength to resist and excessive amount of handling and moving at the installation site. Materials which are moisture absorbent must be protected from water while being stored at the site. Storage areas should be clearly indicated for the insulation contractor in project specifications, and should be noted as covered or open.

Specifications

Contract drawings should indicate the extent and general arrangement of the site and the process piping to receive insulation treatment. The size of piping and equipment, line origination and termination, elevations, support locations, and orientation of nozzles, fittings and valves should also be indicated and properly dimensioned.

Quality of Materials

Insulation and associated materials should be specified and ordered to meet appropriate codes and standards. Manufacturers’ data sheets and test reports should be consulted in the selection process to determine conformity.

Adapted from Section III (Insulation Systems Design) of the National Commercial & Industrial Insulation Standards, published by the Midwest Insulation Contractors Association.

When it comes to guaranteed money savings and economical, efficient operation of a vast array of facilities, using thermal insulation is like "solid gold." Other devices and approaches in the "gold-plate" category, such as timers, logic controllers, and even energy conservation training, are a distant second. But there’s one aspect of thermal insulation’s overall use that has been historically overlooked or poorly-regarded: the use of removable-reusable insulation systems. With rising energy costs and the unwanted environmental emissions accompanying lost energy, the time has definitely come for facility owners, operators and energy managers to fully take advantage of this valuable money saving, energy conserving and emissions reducing tool.

History-The Bum Rap

Removable and reusable insulation’s reception and use has historically been mixed. People have variously referred to installation of these insulations with unflattering terms such as "covers," "bags," "diapers," and "pads," to name just a few. This is a bum rap …though in some instances the reputation may have been deserved due to incorrect specification, out-of-date construction methods, poor fit, and use of less than optimum materials for the application. But "giving a dog a bad name" shouldn’t detract from the excellent products that are available. To make the point even further, this type of insulation use should more correctly be named and regarded as that of "removable-reusable insulation systems."

Use a Facility-Wide Approach

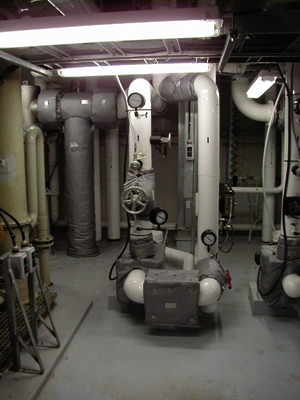
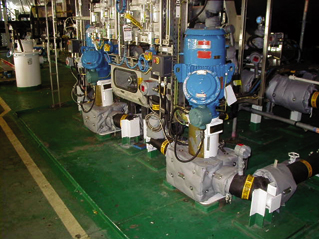
A facility-wide approach to specification and selection of removable-reusable insulation systems is important. It’s vital in reviewing and determining where these systems can be used and how to gain optimum results. A comprehensive review helps blunt the tendency to simply pick out single random pieces of equipment in a process-chain, to the exclusion of all others. Doing anything other than a full review doesn’t really make sense-certainly not from an economical standpoint in terms of operating or maintenance cost, nor process stability, or with regard to the environmental emissions which accompany lost energy. An example of this approach’s outcome is shown in photo of a pumping station and reactor lines (see Figure 1 at left).

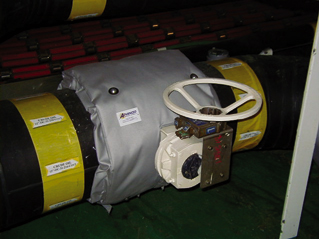
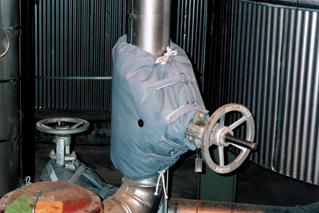
In the photo, all equipment that might otherwise be left uninsulated, either due to its awkward shape, location, or need for quick maintenance accessibility and fast return to service, has been insulated with a removable-reusable system. The component parts consist of removable-reusable insulation to cover the pumps, instrumentation, pump inlet and outlet valves, check valve and the reactor lines in the background. For a closer look at removable-reusable insulation covering various types of equipment, take a look at the pictures of the twin pump station (Figure 2), the motor driven butterfly valve (Figure 3) and the gate valve (Figure 4).

Performing such a facility-wide review may seem daunting, but to simplify this task, break it into manageable parts. Divide the overall facility into its various systems. For example, in a thermal power plant, boiler water feedheating and turbine condensate collection would be examples of systems. From this list, perform a drawing and/or process & instrument diagram (P&ID) review to help identify and list hardware items in the system. Then perform a field review. This examines the equipment as presently installed and how it’s insulated. From the field review, create an action list of all those items of hardware that are uninsulated, poorly insulated, or traditionally difficult to insulate with "rigid" insulation. Factors which play into this include the shape, size, maintenance requirements, location, elevation above ground, physical environment the equipment is in and myriad other reasons. In conducting the field survey, don’t forget such none-obvious items as pipe spools, manways and flange joints.

From this review, equipment that has traditionally been left bare, unaddressed, or inconveniently covered with traditional rigid insulation and metal are prime targets for covering with removable-reusable insulation systems. The identified equipment is gaining or losing heat, wasting energy, and costing a significant amount of money in operating and maintenance costs.

As an aid to this review, contemplating other industries where removable-reusable insulation systems are extensively used also helps focus attention on identifying the type, need and locations for installation. Removable-reusable insulation systems are extensively used in the offshore oil and gas exploration industry. One example is the Hibernia Oil and Gas rig pictured at the top of this story. There are several reasons for use in this and other marine applications. Though these are specific reasons for marine applications, they’re no less applicable to all manner of land-bound facilities, no matter how large or small. So it’s important to closely review all factors and reasons for insulating.

For insulating outside, above deck, these factors need to be considered:
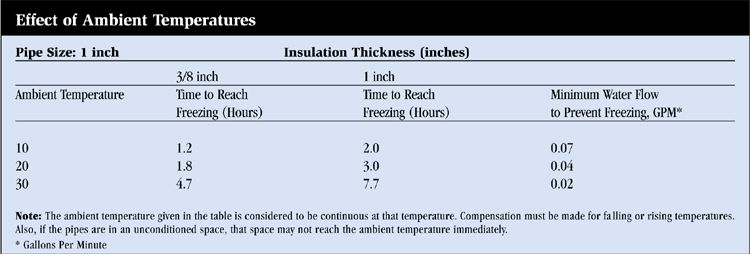
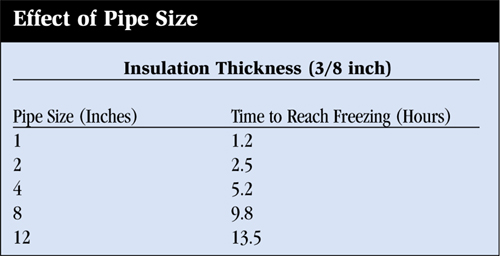
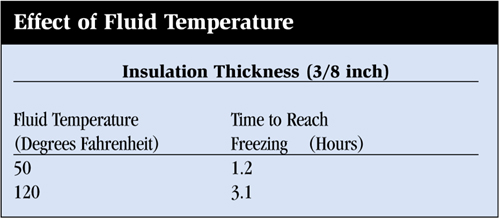
  • freeze protection

  • equipment installed in tight quarters

  • instrumentation protection and signal output stability

  • waste and environmental issues (If rigid insulation is used and removed, it can’t be readily disposed when you’re miles from land. It creates a waste issue.)

  • minimum down-time (This allows for rapid maintenance access and return to service, especially in adverse environmental conditions and heavy weather.)

  • manpower (Small crews only are available to access and complete maintenance. Outside crews can’t be easily or rapidly mobilized, if at all. Removal and re-installation of removable-reusable insulation systems is easily accomplished.)

For insulating inside, below deck, consider these factors:

  • working environment (temperature control in working spaces)

  • personnel protection for hot equipment

  • noise abatement

  • instrumentation protection and signal output stability

  • process stability

Having completed the field and drawing review, and considering where these systems will be used, you’re ready to commence the outline specification required for ultimate purchase and installation. This way the insulation, and not your wallet, can start taking the heat.

Outline Specifications

At the outset it’s paramount to understand, in contemplating using removable-reusable insulation systems, that they must be properly specified and professionally designed and manufactured from quality materials to be durable, effective and reinstallable many times over.

In specifying these systems, similar parameters and constraints apply as in the installation and use of rigid insulation. These are:

  • operating conditions

  • operating environment

  • materials

  • quality of manufacture

  • installation considerations

  • maintenance considerations

  • economics

If we take a look at these in turn, we will be able to highlight factors that are important to specifying types of removable-reusable insulation and to guarantee their success.

Basic Construction: Liners

Removable-reusable insulation has four basic parts: liner, insulation, outer jacket, and closure. Let’s take a look at each of these, beginning with liners.

One of the first considerations in selecting a liner material is the hot (or cold) face temperature on which the insulation will be installed. Some viable materials, and an outline of their general limitations are listed as follows.

Silicone Impregnated Cloth

This material is a very good selection for functional all-round general service. The matrix cloth is usually a glass fiber weave with a through-thickness impregnation of high-temperature silicone. This cloth is very flexible and easily handled. Upper temperature limitations for this material are in the range of 500 degrees fahrenheit (F) for continuous use, but above 500 degrees F can they take intermittent exposure of up to 700 degrees F for an accumulated time of about 100 hours.

Vermiculite Coated Glass Fiber Cloth

This material can be used at temperatures up to 500 degrees F. However, one constraint is that in humid or wet environments, moisture and heat can deteriorate the base cloth. This should be considered when contemplating outdoor applications, or use on steam or hot water systems where the potential for leaks exist (at valve bonnets or pipe flanges, for example).

Aluminum Foil Laminated to Glass Cloth

This is material that may be used on low-temperature applications. It’s reasonably flexible and low cost. The aluminum foil serves as a barrier to retard fluids entering the insulation layer from the inside. Its temperature limitation is about 200 degrees F. Above this temperature the lamination bond tends to break down due to adhesive degradation and the aluminum flakes.

Stainless Steel Foil Laminated to Glass Cloth

The foils used for this material are quite heavy (generally around 3 mils). Using this material provides a puncture-proof liner. However it can’t be folded due to its lack of flexibility. It also can’t be sewn. Construction of the finished product entails using "hog rings" to join it at the edges of the liner, to the outer jacket. This joining method has now become virtually obsolete in manufacturing quality removable-reusable insulations.

Silica Cloth

Woven silica cloth is used as a liner for very high temperature applications (up to 1,800 degrees F). Its main limitation is that it’s difficult to work with and frays easily.

Basic Construction: Insulation Layers

Various insulation layers are available. These include the following.

Man-Made Mineral Fiber

The usual candidates are available for this application. They include both rock wool and fibrous glass wool held together with an organic binder. Selection of this insulation material depends on the application. The main considerations, in addition to thermal conductivity, are the flexibility of this layer for handling during many installations and removals over the life of the finished insulation. Also, resistance to compression has to be considered. Compression could reduce the effective thickness of the insulating layer.

Needled Man-Made Mineral Fiber and Ceramic Mats

These don’t use the usual organic binders to hold the mat together. They’re nonwoven and held together by mechanically "needling" the internal fibers of the mat together using a special process. The usual organic binders start to decompose (oxidize) at around 400 degrees F. Use of organic binders above this temperature would cause loss of binder and cause degradation of the insulation to an extent that it would compress and lose thickness due to diminishing compressive strength. Also, loss of binder could lead to disintegration of the insulation layer. Needled man-made mineral fibers would therefore generally be used on installations operating in temperatures ranging from above 400 degrees F up to about 1,000 degrees F. Needled ceramic mat would be used in the highest temperature applications.

Other Specialized Materials

These may be specified and used depending on the application.

Basic Construction: Outer Jacket

There are several examples of outer jackets.

Silicone Impregnated Cloth

For functional all-round general service, this material is also a very good selection as an outer jacket, as well as a liner. The matrix cloth is usually a glass fiber weave with a through-thickness impregnation of high temperature silicone. This cloth is easily handled, impervious to the elements, very flexible, has excellent tear strength and is resistant to cracking, even in sub-zero temperatures.

Fluorocarbon (Teflon) Coated Cloth

Though this material can be pressed into general service, it’s best reserved for special applications in special environments. For example, these include environments subject to very aggressive corrosive attack, which would degrade other materials, or where complete cleanability and washdown are critical. Examples of the latter are in the food, pharmaceutical or nuclear industries.

One of the limitations of this material is that the fluorocarbon is coated onto the base glass fiber cloth, not through-thickness impregnated. A coating outcome is that the material wrinkles easily (think linen shirt versus permanent press). When the cover cools and is handled during several installations and removals, especially in cold temperatures, the material and coating tends to crack along the wrinkle lines.

Aluminum Foil Laminated to Glass Fiber Cloth

With the aluminum foil presented on the outside, this material gives a consistent look to an overall insulation installation. It’s low cost, but doesn’t have high puncture, weather or fluid-ingress resistance properties. It has the same limitations to steam and temperature exposure when used as an outer jacket as when used as liner, as mentioned earlier in this article.

Stainless Steel Foil Laminated to Glass Fiber Cloth

Use of this material provides a puncture-proof jacket. However it retains the same constraints when used as a jacket as it does when used as a liner: It can’t be folded due to its lack of flexibility, and it also can’t be sewn. Construction of the finished product entails using "hog rings" to join it at the edges of the jacket, to the inner liner or to an intermediate gusset. This construction method makes the overall finished piece of insulation difficult to weatherproof if used outside, or to prevent the ingress of fluids to the insulation layer if used indoors. Also, except in specific applications, use of hog rings as a joining method has now become virtually obsolete in manufacturing quality removable-reusable insulations.

Stainless Steel Knitted Mesh

This mesh can be added over any jacket to provide tear resistance (but not puncture resistance), to a jacket. Think of it as a kind of "chain mail" or "rip-stop" mesh for the jacket. Use of this mesh is now also becoming obsolete now that higher tear-resistant materials for constructing the outer jacket are available. Also, historically, this mesh has been hog-ringed in place, thus introducing the same weather and moisture-ingress problems as the previously mentioned stainless steel foil laminated to glass fiber cloth.

Vinyl Outer Covers

Vinyl outer covers in colors such as bright yellow and international orange can be supplied to the shape of removable-reusable insulations. The intent is to give the equipment high visibility. This can be for safety reasons, such as warning personnel to stay clear or use safety equipment. Steam pressure relief valves (PSV’s), are a good example (as shown in Figure 5). The noise level in proximity to large steam PSV’s when they release is high enough to burst eardrums and cause hearing damage.

Basic Construction: Closures

Once the removable-reusable insulation piece has been fitted around the piece of equipment to be insulated, some type of closure is required to hold it in place. There are several types of closures, including the following.

Fire Retardant Industrial-grade Velcro on a Strap

The strap is threaded through a stainless steel D-Ring buckle, doubled back on itself and pressed closed. This makes a good and strong durable closure and lends itself well to rapid removal of the removable-reusable insulation for maintenance.

Lacing Anchors

These are generally used for extremely high temperatures. The closure ligament used for lacing the removable-reusable insulation closed through the lacing anchors is generally 18-gauge stainless steel wire. This remains strong and serviceable in elevated temperature applications.

Draw Chords

The analogy here would be comparable to tying your shoelaces. Stainless steel grommets are installed along the closure edge of the removable-reusable insulation. Light "ropes" are threaded through the grommets and laced up to provide a good closure. The ropes can be made from quite ordinary or quite sophisticated materials. These can include: glass fiber, Nylon, Kevlar, or Fluorocarbon impregnated as may suit the application and operating environment.

Supplier Selection

Selecting the right supplier for removable-reusable insulations is vital. Factors to be considered in selecting suppliers include the following. These questions should be asked:

  • Do they have experience in the insulation industry?

  • Are they a well established and dedicated full-time manufacturer, with removable-reusable insulation systems as their prime product?

  • Are they experienced and capable field personnel able to make field measurements?

  • Are they experienced and capable designers who can translate the field measurements into removable-reusable insulation designs?

  • Do they have an experienced work force to manufacture the removable-reusable insulations?

  • Do they have a good list of projects, both large and small, and in diverse applications, which can be referred to by potential purchasers?

  • Do they have a thoroughly complete, available and professional presence and support staff to fully specify, design, manufacture and deliver their products for installation and use?

  • Is installation assistance and follow up available, if required?

  • Do they have a formal quality management system to support and guide all of the previously mentioned factors?

If you’re considering a supplier who can’t meet all of these criteria, think twice. You usually get what you pay for. When considering tenders, bids and quotes, don’t fall into the trap of just accepting the low bid. Accept the lowest-priced technically acceptable bid. A good bid supplies an excellent, durable, well-designed product, with all the professional, manufacturing, installation and follow-up support provided as a routine service.

Product Design and Manufacture

The basic steps in product design and manufacture are:

  • drawing and site review.

  • outline specification.

  • an estimate/budget quotation with or without manufacturer’s site review, as needed.

  • purchase order issue.

  • finalization of the specification.

  • preliminary design.

  • finalization of the design and production of the manufacturing specification.

  • the manufacture and delivery of the finished removable-reusable insulations to the customer, complete with instructions on installation.

  • ongoing quality management throughout all of the previous steps.

  • customer and follow-up support as needed.

We have already covered outline review and specification, so let’s take a look at the balance of steps in product design and manufacture.

Estimating Budget and Finalizing Design

A rough quotation and budget estimate should be available to the buyer following receipt of an outline specification listing what removable-reusable insulations are needed. This can be further developed through discussions with the supplier. To augment this, quality removable-reusable insulation manufacturers should be able to conduct a site survey and present an estimate or quotation on larger (and sometimes smaller) jobs.

During a site review, the manufacturer will make site measurements and take notes of the operating parameters, operating conditions, physical location, dimensions, heat tracing, space constraints and adjacent equipment and processes. From this information, a design sketch will be produced.

The information on the design sketch and site measurements will allow the design to be completed. It should be noted that thorough, skillful design is essential to manufacturing a functional and well-fitting removable-reusable insulation system. This information is then transferred to a design and manufacturing sheet, which forms the manufacturing specification and goes to the layout and cutting table. It shows layout and dimensions for the liner, insulation layer, jacket, closures, and miscellaneous gussets. It also should show the materials to be used and the manufacturing inspection points and requirements.

Manufacturing

Again, it’s critical that professional, experienced full-time production staff lay out, cut, assemble, sew and inspect the liner, insulation layer and jacket into the final removable-reusable insulation piece. This is a highly skilled job, and the final product should fit like a kid glove or a Saville Row suit. If it doesn’t, something is wrong. The methods of joining the various parts of removable-reusable insulations together have become increasingly sophisticated. Top quality covers will now be more inclined to be sewn instead of hog-ringed together. Extremely durable high-tech threads, including Kevlar-coated stainless steel thread, Teflon-coated glass, polyester, and plain Kevlar threads are available for this task.

The picture shows some of the design layout and quality control inspections being undertaken on a partly finished insulation piece. The complexity of manufacture is reasonably evident in the picture. Overlapping flaps are visible, showing the detail needed to help keep the elements and errant fluids out, and the inner insulating layer dry.

There are many other nuances of design and manufacture of first-rate removable-reusable insulations that extend far beyond the space available for this article. These all come from field and manufacturing experience and are integrated into designs by experienced manufacturers.

Finishing

Finishing of removable-reusable insulations is also very important to long life and durability. Some finishing operations include labeling, along with integrating quilting pins into the finished product. Using quilting pins is important. These prevent the internal insulation layer from shifting between the inner liner and outer jacket. If electric tracing is present, or no abrasion is allowed against the insulated face of the equipment, then the quilting pins may be capped with "dome" caps to prevent damage to the tracing or equipment surface.

Finally, identification of the individual pieces of a removable-reusable insulation system is important. The labeling should be durable and strongly attached. Embossed metal plates meet these criteria. Information included on the labeling might include the manufacturer name, the job number and the customer purchase order number. It might also include the manufacturer’s piece number tied back its quality management records, the process system on which the removable-reusable insulation system will be installed, and the particular piece of equipment on which the removable-reusable insulation piece will be installed and remain.

Labeling is important since, when the in-field design sketch was made, the closures on one piece of insulation may have been placed in a different orientation than another piece, even though it’s fitted on identical equipment. This choice of closure orientation, for example, may be due to such factors as interference with adjacent equipment, or placement of the closure such that it’s oriented for easy access for maintenance, particularly if above grade. Other factors may include identical valves having their bonnets rotated and installed at different orientations on the bolt-circle pattern. The nuances are too great to mention here, but must be considered. These are the hallmarks of a professional manufacturer.

A formal quality management system should be in place to ensure consistency of manufacture of removable-reusable insulation. That there should be full manufacturer support through all phases of specification, design, delivery, installation, and after sale support shouldn’t even be a question. It’s essential to customer satisfaction and durable well-designed products.

Economics of Removable-Reusable Insulations

We should look briefly at the economics of removable-reusable insulations. Properly specified and selected, these insulations pay for themselves in very short order …most often in less than a year; sometimes in a matter of months. The dilemma of "If I cover it with rigid insulation to save energy, I lose maintenance accessibility" no longer exists. With removable-reusable insulations, savings can now be realized by insulating equipment that was previously awkward, inaccessible, impractical or expensive to tackle with rigid insulation.

The initial overall cost of covering a piece of equipment with removable-reusable insulation may be somewhat higher than with rigid insulation. It depends on the application. But payback can be determined reasonably precisely by a quick engineering analysis of the application. Also the initial price advantage offered by rigid insulation disappears quickly the first time it has to be removed and replaced. Further the waste from the removed rigid insulation has to be disposed of, and will generally end up in a landfill.

The second area of savings stems from shortening process downtimes and outages. Rapid, easy maintenance accessibility to hot equipment and fast return to service mean less downtime. The marginal hourly cost of having a high-volume manufacturing or industrial process taken out of service for forced, routine or planned maintenance can be tremendous.

Finally, the third potential area for savings is in providing personnel protections from hot equipment. Replacement of lost labor is expensive. Workers’ compensation and insurance premiums cost money. However, more importantly, there’s far more than an economic cost when someone becomes unnecessarily injured.

Removable-reusable insulations and systems gives full meaning to the industry battle cry of "reduce, reuse, recycle." Good luck with your mining expedition …these products are absolutely 100 percent, 24 karat solid gold.

Figure 1
Figure 2
Figure 3
Figure 4
Figure 5