It has long been evident to those in the steam-generating industry and to those closely connected with the power generating industry that a gap exists in the understanding of pricing major projects that extend over long time periods. The power-generating industry can save millions of dollars by understanding the problems associated with these extensive pricing projects. Understanding the difference between the marketing/sales view versus the accounting view of pricing as well as knowing the long-term effect that pricing has upon the power-generating industry can offer huge savings as a result of this practical knowledge.
In an effort to fill the gap, here is practical information to raise the awareness and understanding of marketing and pricing as applied to long-term, multi-million-dollar projects with long-term deliveries such as new power generating boilers or air pollution equipment. The comments and considerations as presented do not necessarily apply to short-term projects or off-the-shelf items.
Many power and OEM (Original Equipment Manufacturer) companies accept bids from other companies (i.e. construction companies, contractors, material suppliers, etc.) without the understanding of the bidding process. Otherwise, they would not accept half of the bids they receive. Many people in the power-generating industry think of pricing as a cost plus a markup. This type of thinking is driven by accounting and not pricing and may cost the power-generating industry millions of dollars through paying more for their new steam-generating boiler, air pollution equipment, and for bril (brick, refractory, insulation and lagging). These are all major energy-saving components found at all steam-generating facilities.
Prior to the 1960s, all the major OEMs had marketing and pricing departments that acted independently from their accounting department. The accounting department would assign an accountant to work with the pricing department. The price developed would then be given to the sales department for the purpose of negotiating a contract. This all began to change in the 1960s.
Starting in the early ’60s, the boiler industry developed membrane tube wall construction. This led to the ability to make larger, higher-capacity boilers. The capacity or size of the boilers began to increase from 100-250 megawatt to 300-600 megawatt to 1000 megawatt boilers. This meant that the contract values also began to grow from a million dollars to fifty million dollars to one-hundred million dollars. The manufacturing and engineering time also grew from an average of six months to time periods of three to five years. This led to a decrease in the number of bidding opportunities. Instead of a company wanting two or three small boilers, it now could buy one very large boiler. Therefore, competitive pricing increased as the number of bidding opportunities decreased. Handshake deals were out and customers became more budget-conscious with the larger expenditures. It became more important than ever to evaluate the price, the design, the terms, and the conditions of that price.
With the increase in new boiler demand, it was imperative that marketing and pricing work together. However, as marketing and pricing were partnered together, the accounting and pricing departments were kept separate, creating a system of checks and balances.
Going back only 20 years ago, it was clearly understood that these departments had specific responsibilities. For example: The marketing department was responsible for setting the goals of the company. The pricing department was responsible for achieving those goals and would be held accountable for the future of the company. The accounting department was responsible for reporting what was current on that day at that day’s dollars and on the progress of achieving the company goals. The process of submitting a bid to a power company was done through the pricing department to the marketing/sales department and reported and tracked daily by the accounting department.
The pricing that was bid (bid price) and ultimately accepted by the power-generating companies during this time period goes much deeper than cost + mark up = selling price. There were many factors or strategies that were taken into consideration before a bid price was submitted. These were strategies that worked for the power generating industry.
A bid price is more than a dollar value. It is formula tied to a predetermined set of terms and conditions. A bid price is a price that is given (or accepted) on a real project that is to be completed in a specific time period and tied to a predetermined set of terms and conditions. The formula for a bid price is given as: 1) an adjustable price*, 2) a firm price** or 3) a combination of the two.
*An adjustable price is a price given in current day dollars subject to an adjustment based on various published indices (i.e. steel, labor rates, etc). The cost of a project will develop over a long period of time from bid date to construction date. However, most manufacturing costs are usually stable for at least six months. The exposure to risk is greater for the buyer because of the potential changes in the indices.
**A firm price is not subject to adjustment and is a fixed price based on a delivery and installation time specified. The exposure to risk is equal for both the buyer and the bidder.
Along with these types of bids, a bid price can be broken down to a material supply only or coupled with installation. Both the material and labor can be quoted to separate terms and conditions and different types of bid price. For example, the material price can be quoted part firm and part escalatable while the labor portion can be totally adjustable based on man-hours, labor rates, etc.
In years past, the pricing submitted would be based on a marketing strategy. The marketing strategy would be based on the market conditions of competition as well as the manufacturing considerations and would be used to set a sort of "competition pricing." This price would be set based on market value, market strategy for negotiations, future opportunities, duplications and the company’s need for work. (Note that costs were yet to be considered in the pricing decision.)
Then, after this price had been established, it would be evaluated against the company’s cost. But what is cost?
Cost is the sum total of the fixed and variable expenses to manufacture a product. Fixed costs include the expense of running the business (rent, utilities, office equipment, insurance, salaries, depreciation and property taxes). Variable costs that include raw materials, hourly wages paid to laborers and contractors, warehouse and shipping costs and manufacturing efficiencies (efficiencies covering shop loading, employee attitudes, and the use of new or antiquated equipment).
Having evaluated some of the pricing and strategy, the pricing department must now look at costs. This review of costs is required and necessary for two important reasons:
1) To analyze the effect the theoretical costs have on the projected bid price where price and cost deviate
2) To act as a watchdog on the accounting department.***
***We are all aware of the recent disclosures in the media relating to accounting misreporting and projections of profit and loss. This would never have happened if the accounting projections of profit and loss had been reviewed, understood, and/or challenged by another independent group (i.e. pricing department).
What is wrong with a bid price that is based on cost only (i.e. price = cost + markup) versus a price based on a pricing strategy as described above? First, a bid price based on cost only does not recognize the magnitude of the dollars involved but favors the smaller projects and overprices and potentially loses the larger projects. For example:
An accounting-driven company that has established their standard markup to be 30% [20% covering G&A (general & accounting cost) and 10% profit] would prefer offering a price of $100,000 rather than $1,000,000 with a 15% markup. The accounting-driven company is stuck on G&A. The G&A to these types of companies are a fixed percentage, which makes the $1,000,000 bid a negative net profit because the 15% will not cover their established G&A rate of 20%. The smaller $30,000 gross profit price ($100,000 x 30%) is more desirable compared to the larger gross profit amount of $150,000 ($1,000,000 x 15%) simply because of percentages. Therefore, an accounting-driven company would increase the markup to 20%. Their only reason for this increase would be to achieve their vision of what is profit and loss and company G&A.
Secondly, a bid price that is based on cost may include accounting adders for covering shop inefficiencies and projected labor rate increases. When a bid price is based on cost then that cost is affected by a labor rate increase that will then be static for a semiannual or annual period of time causing a current day spike in costs. This will have an adverse affect upon a large project that spans years (i.e. a new steam-generating boiler).
A marketing-driven company takes into consideration four simple rules and sets their pricing based on the market value, marketing strategy for negotiations, future opportunities and duplications, and the company’s need for work. The four simple rules are:
Rule 1: A price being offered should always ignore poor shop performance as a basis of cost structure because you cannot sell inefficiency.
Rule 2: A bid price should always reflect the "conditions" of the day.
This rule covers a wide range of conditions such as the market conditions (i.e. number of available opportunities), competitive condition (how many bidders and who), manufacturing needs (shop loading), future long term business (possible duplications with other customers), corporate conditions (profits and cost recoveries), the bid price formula (the customer’s terms and conditions, and your company cash flow) and the economic conditions (inflation or deflation, interest rates). Typical questions: What is the number of acceptable bidders and their needs for the contract? What is the number of contracts possible on the horizon? What are the company’s own needs for the contract? What is the possibility of future duplication?
Rule 3: A bid price must recognize design considerations.
This rule covers such things as unit efficiency, inputs and outputs, and the advantages and disadvantages with respect to competitor designs. Typical questions: What is the customer asking for? Why or how will the unit or equipment being offered meet the customer’s desires? How does the unit or equipment design as requested by the customer meet or compare with the company’s own standards? What has impacted the design and the affect on competitive design? Do the specifications favor the competition? Does the bid meet the specifications?
Rule 4: A bid price must take into consideration the customer’s financial position.
What this means is the type of price you offer should take into consideration the customer’s financial conditions and cash flow needs. Typical questions: Will there be any up-front payments or delay terms? Can the customer pay for what is being offered? Does the customer understand the costs involved with what was specified? Will the customer accept changes or properly evaluate the bid changes? Will the customer negotiate?
As you can see, the difference between an accounting-driven company and a marketing-driven company is as different as night and day. An all-important point to remember is that a price accepted can have a lasting effect upon the market, your relationship with your contractors or material suppliers and with the power-generating industry as a whole. A typical example in the power generating industry is:
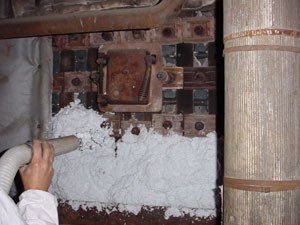
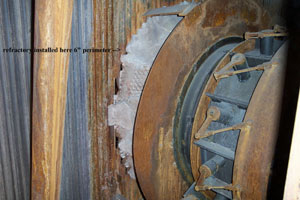
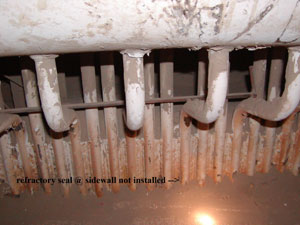
A power-generating company asks for help because they have a lagging and insulation** design and installation problem. However, the real problem was actually their perception of cost and the type of contract that they had awarded. They awarded the project to the lowest bidder and made the contract time and material. This opened a whole set of new problems. The contractor’s productivity slowed to a snail’s pace; the schedule was impacted, and the lagging had to be installed over the insulation while the boiler was running. The power-generating company had been provided with enough information (quantitative take-offs, specifications, drawings and schedule) that would have allowed them to go out for bids on a firm price. Unfortunately, what they saw were dollars at the fixed amount that seemed much higher than what they thought the costs would be if they allowed the contractor to work on a time and material contract. This type of example and problem occurs often in the power-generating industry.
** Insulation and lagging are key components of any steam-generating facility that is vital for efficient boiler operation, necessary for personnel protection, required for heat conservation, and if installed and designed correctly, will save energy and money at a rate that is essential for efficient plant operation. The problem, as described above, is a typical example, but one that does not take into account boiler-construction-schedule delays or OEM material delivery delays that always impact the insulation and lagging installation and cost.
Another example is the common practice of accepting partnering-type contracts with OEMs to meet their NOx emission or new boiler requirements. A partnering-type contract is a relationship established between a manufacturer (with or without construction) and the power plant to sole source the entire project. The cost projected by the OEM is usually a "not-to-exceed" dollar amount with incentives given to the OEM for completing early or under the projected total man-hours. Unfortunately, the cost or man-hours established offer no assurance that after the project is completed, the final costs to the power plant will be less or equal to that which was originally bid. If the original projected dollars are set high, then the odds are they will be completed under budget. A partnering-type contract almost always favors the OEM or construction company and not the power plant and does not reflect a market value for the work to be supplied or installed.
Conclusion
Understanding marketing and pricing is needed because the dollar value of the bid price and the type of contract awarded have a direct effect upon the whole power-generating industry. This contributes to the market value (cost) of a new boiler, the air pollution system, or even the insulation and lagging. The size of a major project requires an in-depth understanding of marketing strategy, engineering, manufacturing and labor costs. The structuring of a bid price for these long-term projects should not be a cost plus markup approach as used on off-the-shelf goods. Reducing the cost to the power-generating industry will help reduce their initial capital cost. This means that good competitive pricing is needed from all sectors (manufacturers, contractors, material suppliers, etc.). The power companies need to take a long, hard look at the bid prices they accept. Our country’s energy is generated by the power industry, and all companies involved hold some measure of responsibility to help keep those costs down. It begins with understanding the power-generating market and the pricing that is accepted or presented.
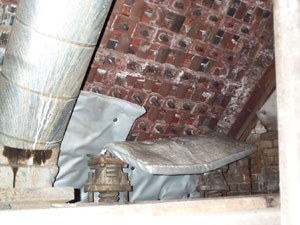
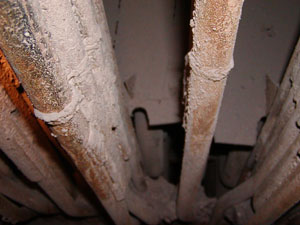
 Figure 1
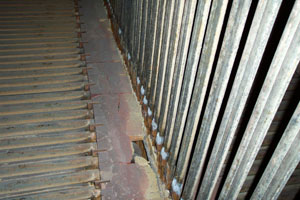
 Figure 2
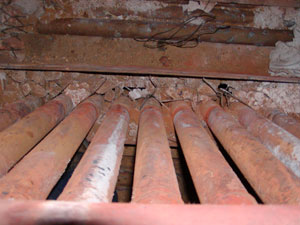
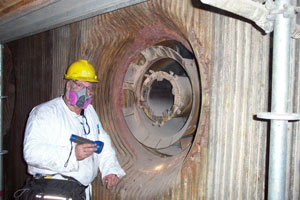
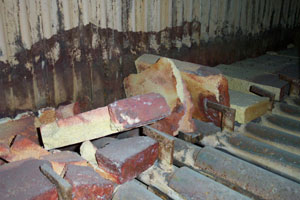
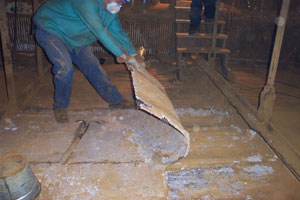
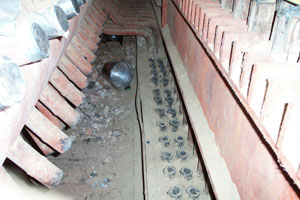
New circulating fluid bed boiler