Category Archives: Global

As warmer
weather moves across the country, affecting more U.S. workers, it becomes
increasingly important for companies to focus on protection from heat-related
illness. A discussion of legal requirements for employers related to the
General Duty Clause and the need to address heat stress was featured in an
article titled “Heat Stress and the General Duty Clause” by NIA’s legal counsel
Gary Auman in the October 2012 issue of Insulation Outlook, available at
www.InsulationOutlook.com. The following article discusses some of the
symptoms of heat illness and offers ideas and resources for those looking to
strengthen or develop a heat illness prevention program for their workers. This
article seeks to start a discussion about this issue, and readers are encouraged
to speak to their own experts and legal counsel about how to create a plan and
protect their employees. If you have any concerns about the adequacy of your
heat illness prevention program, you are encouraged to consult with your
company physician regarding the environment in which your employees work and
the safeguards you have in place.

Heat illness is a serious condition that claims lives every year. If
your heat illness prevention program consists of simply making water coolers
available to your employees, you may be putting your workforce at risk. Because
of the significant number of individuals affected, the Occupational Safety and
Health Administration (OSHA) is emphasizing the need for all construction
companies to have a heat illness prevention program in place that includes
effective training of all employees. High temperatures, high humidity, radiant
heat sources, and strenuous physical activity are all risk factors for heat
illness, and these are all common workplace conditions in the insulation trade.
A comprehensive heat illness prevention plan is an important part of any
environmental, health, and safety program. As the summer season begins, it is
crucial to evaluate your safety programs to ensure you are doing everything
necessary to guarantee the safety and health of your employees.

Heat Illness Symptoms

Heat illness refers to a range of health problems
that occur when a person cannot maintain a normal body temperature. A person’s
body temperature depends on environmental conditions and the heat generated
through physical exertion. Excess body heat is controlled primarily by
perspiration. When a person cannot effectively shed excess body heat, then heat
illness may occur. Heat illness can take several forms, from mild heat cramps
to life-threatening heat stroke.

Exposure to hot environmental conditions, other heat sources, and
metabolic heat (from exertion) are the primary risk factors for heat illness.
Many other factors, however, can contribute to an individual’s likelihood of
developing the condition, including diet, hydration, medication, pre-existing
conditions such as high blood pressure and diabetes, obesity, and even sunburn.
These factors, combined with the necessary use of personal protective equipment
and work clothing, contribute to thousands of workers becoming ill and being at
risk for serious complications, including death.

Heat cramps are a mild form of heat illness, but they should be viewed as
a red flag for more serious problems. Heat cramps are the result of dehydration
and a loss of salt. A person suffering heat cramps may not require medical
attention as long as certain precautions are taken, including taking a break
from activity and rehydrating with water or a sports drink. Salt tablets are
generally not recommended unless directed by a doctor, as a normal, healthy
diet should replace salt loss. Everyone should drink more fluids than usual
during hot periods, even if they do not feel thirsty. Thirst is a signal that
you may already be dehydrated. An easy teaching point to pass on to your
employees is to monitor the color of their urine. Dark-colored urine is a
classic sign of dehydration.

Heat exhaustion is a more
serious form of heat illness that is caused by a loss of salt and fluids. It
can occur gradually over several days or happen more suddenly. Heat exhaustion
is characterized by heavy sweating, pale skin, tiredness, weakness, dizziness,
and nausea. An individual affected by heat exhaustion will have a rapid, weak
pulse rate and fast, shallow breathing. Although heat exhaustion is treatable,
it should not be taken lightly, as it can progress to heat stroke. Workers
suffering from heat exhaustion also may be less alert or confused, and
therefore be at greater risk for accidents. These workers should be removed
from the work area and escorted to a cooling off area. At the cooling off area
they should be monitored and the Mayo Clinic recommends that they drink cool
liquids and have wet towels, ice packs, or cooling blankets applied to their
skin after removing excess clothes while you consult with medical personnel.
Sitting them in front of a fan or misting the person with water may also help
cool them down. Be aware that further treatment, including medical help and
intravenous (IV) fluids may be needed to help them rehydrate. Remember, you
should not just direct them to a cooling area, but personally escort them, as
they may be disoriented. An individual who is suspected to be suffering from
heat illness should not be left alone or be expected to obtain their own treatment.

Heat stroke is the most serious form of heat illness. It occurs when the
body becomes unable to regulate its own temperature. Heat stroke is
characterized by rapidly rising body temperature, the cessation of an
individual’s sweating mechanism, and the body being unable to cool down. Heat
stroke can cause death or permanent disability in a matter of minutes or hours
and may lead to brain damage, loss of kidney
function, and other organ damage. Warning signs of heat stroke include
flushed, hot, and dry skin; a lack of sweat; rapid, strong pulse; headache;
confusion; muscle cramps or weakness; nausea and dizziness; and loss of
consciousness. You should immediately call for emergency medical assistance if
you suspect someone is suffering from heat stroke. To treat heat stroke
immediately while waiting for medical assistance, the American Red Cross
recommends complete immersion (up to the victim’s neck) in cool water, if
possible.

Resources for Employers

Several government agencies and consensus groups
offer guidelines for preventing heat illness in the workplace. OSHA has an
ongoing campaign to prevent heat illness in outdoor workers. OSHA’s website, www.osha.gov,
details the agency’s outreach initiative, which stresses the core components of
water, rest, and shade. The website offers educational and training resources
for employers, and information on using the heat index—a temperature value that
factors in relative humidity. Since the sweating mechanism is less effective at
cooling a worker’s body in high humidity environments, the heat index, which
combines temperature with humidity, should be the resource used to determine
what safeguards to put in place. Users of the chart are cautioned that the
numbers on the chart are meant to refer to work that is out of direct sunlight;
the chart indicates that if work is in the sun with little or no breeze, then
15 degrees should be added to the temperature component.

Although Federal OSHA does not have a specific standard on heat illness,
Section 5(a)(1) of the OSH Act, known as the General Duty Clause—which is
described in the October 2012 article mentioned previously—states that
employers must provide “employment and a place of employment which are free
from recognized hazards that are causing or are likely to cause serious
physical harm…” It is clear from OSHA’s campaign on heat illness that the
threat presented by this condition, which can have serious detrimental effects,
is real. Therefore, employers have a legal obligation to provide safeguards for
their employees to protect them from the hazardous effects of heat illness.

Employers with operations in
California should be aware that Cal/OSHA has a standard on Heat Illness
Prevention for workers in outdoor places of employment. The standard has
requirements for the provision of drinking water, access to shade, training for
employees and supervisors, and observation of employees working in high-heat
situations. The Cal/OSHA standard is a good starting point for an organization
looking to develop a heat illness prevention program. It contains clear and
straightforward instructions with trigger points for specific control measures
at different temperatures.

Another resource for employers is the American Conference of
Governmental Industrial Hygienists (ACGIH), which is generally recognized as
having the most current exposure limits for workplace contaminants and physical
agents. The ACGIH publishes an exposure limit to protect workers from the
effects of heat illness. That exposure limit, called a Threshold Limit Value—or
TLV—takes into account environmental conditions, workload, and protective
clothing. The ACGIH TLV is based on a special temperature reading called a Wet
Bulb Globe Temperature (WBGT), which factors in relative humidity and radiant
heat sources such as direct sunlight. The TLV determines a work-to-rest ratio
depending on the WBGT reading and the workload. The services of a safety and
health professional, or a representative from your Workers Compensation
carrier, may be needed to perform a heat stress evaluation using the ACGIH
threshold limit value.

Another helpful resource is the National Institute for Occupational
Safety and Health, an agency established to assure safe working conditions for
employees. The NIOSH criteria document for heat stress is fairly simple to use
and sets out a 5-part program that should, if followed, provide more than
adequate protection for your employees.

Developing a Heat Illness Prevention Plan

If you determine
there is the potential for heat illness after evaluating your workplace, you
should develop a comprehensive heat illness prevention plan. The plan should
include training for workers and supervisors, procedures for acclimatization,
control measures, methods for cooling workers off, steps for caring for
heat-related illness, and emergency procedures.

Training for employees and
supervisors should include the types of heat illness and risk factors,
prevention of heat illness, signs and symptoms of heat illness, care and
emergency treatment, as well as the control measures to reduce or prevent heat
illness. Training should emphasize that employees should immediately report any
signs or symptoms of heat illness in themselves or observed in others to a
supervisor.

Control measures in the plan
should include (but are not limited to):

  • Providing
    drinking water and encouraging workers to drink 7 to 10 ounces of water every
    15 to 20 minutes, even when they are not thirsty.

  • Scheduling more demanding tasks early in the day
    whenever possible, when the temperature is likely to be lower.

  • Instructing
    employees to wear loose-fitting, light-colored clothing, whenever feasible for
    their positions.

  • Providing a
    formal program for the acclimatization of employees who are new to working in
    extreme temperatures or who are returning from a week or more away from work in
    extreme temperatures.

  • Providing
    shaded shelter where employees can rest out of direct sunlight.

  • Providing
    regularly scheduled rest periods in a cooling-off area with a temperature of 75
    degrees, with a frequency determined by the heat index.

  • Training
    employees in the detection of heat-related problems in themselves and fellow
    workers.

It is also recommended that employers increase the frequency of water and
rest breaks on extremely hot or humid days, and encourage employees to monitor
one another for signs of heat illness. Engineering controls are preferable when
possible, including air conditioning, fans, or general ventilation.

Acclimatization is also an
important element of a heat illness prevention plan. Workers who are not used
to the heat are more susceptible to heat illness. It can take up to 2 weeks
before a worker is fully acclimated to working in the heat. Allow more frequent
breaks for new workers, or during sudden heat spells.

Another core component of the
plan is to make sure employees know the signs of heat illness and how to react
when somebody shows signs of heat illness. Make sure an adequate number of
employees are trained in first aid and cardiopulmonary resuscitation (CPR)
procedures, post first aid and CPR instructions in worker areas, and ensure
emergency services are notified promptly. It is also important to confirm that
there are no cell phone dead zones in working areas, and that the work site is
easily accessible to emergency medical service (EMS). If the work site is in a
remote area, include alternate communication strategies and plans for getting
rapid access to EMS in your safety plan or program.

Plan Ahead

Implementing a
comprehensive heat illness prevention program will reduce the frequency and
severity of heat illness affecting your work force. Be aware of the
environmental conditions in your workplace that may lead to heat illness, and
factor in the internally generated heat from a physically demanding job. Make
sure employees and supervisors are properly trained on the environmental and
personal risk factors, as well as heat illness control measures including
water, rest, and shade. NIOSH, OSHA, and Cal/OSHA have simple guidelines based
on heat index or temperature that you may use to develop your own safety
program. For a more detailed evaluation, consider using the ACGIH TLV, which
factors in workload, other heat sources, and protective clothing. Finally, put
your plan in writing and enforce it like any other safety or health policy. It
is not enough to assume employees will take it easy if they overheat; treat
heat illness like the serious workplace hazard that it is, and manage it
accordingly. While heat illness poses a serious threat, it can almost always be
prevented if the proper precautions are taken. Finally, when you are aware that
the work you are bidding is going to have to be completed in a potentially
heat-extreme environment, factor that into your schedule and bid to allow time
for necessary acclimatization and rest periods as well as the possibility of
having to cease work early or work a short day if the heat index gets into the
extreme danger zone.

Microporous insulation
is a composite material in the form of compacted powder or fibers with an
average interconnecting pore size comparable to or below the mean free path of
air molecules at standard atmospheric pressure. Microporous insulation may
contain opacifiers to reduce the amount of radiant heat transmitted.

The resulting
blend of materials and pore structure produces a thermal insulation with
extremely low thermal conductivity across a broad temperature range. The
Microporous core material is completely inorganic, making it non-combustible
and suitable for passive fire protection applications.

An ASTM
specification for Microporous insulation is under development with the
following Grades and types: Grade 2 Hydrophobic has been chemically treated to
make the insulation water-repellent. The water repellency
is maintained up to its grade operating temperature
of 250°C. Above this temperature it performs as standard Grade 2.

Microporous Board
Insulation

Microporous Rigid
Boards (Type I) are supplied in 2 primary forms. The first, typically identified as block or board, is an
un-faced flat section of Microporous
insulation compressed to a density
of typically 18–25 pcf. The second type, identified as panel, is a flat section
of Microporous insulation which has been encapsulated with a high temperature
glass facing to minimize dust and improve handling. Normal densities are 14–18
pcf. Rigid Boards have superior compressive strength but normally cannot be
flexed without cracking or breaking the material. Boards are produced in
thicknesses from ⅛” to 4″ depending on the specific type.

Microporous Flexible
Panel Insulation

Flexible Microporous
Panels (Type II) are manufactured at a lower density of approximately 8–16 pcf.
They are also faced with a high temperature glass facing but also are often
stitched through, in one or two directions, using a high temperature thread.
The lower density and the segregation caused by the stitching allows the
material to be flexed to cylindrical or contoured surfaces. Thicknesses range
from ⅛” to ¾”.

Microporous Pipe
Sections (Type III) are supplied as hollow cylinder shapes split in half
lengthwise or as curved segments. Pipe insulation sections are typically
supplied in lengths of 19.7″ (½ meter), and are available in sizes to
fit most standard pipe sizes. Microporous Pipe Sections are faced with a high
temperature glass facing to improve handling. The thickness is 1″ (25mm).
Thicker insulation can normally be supplied as nested sections for most pipe
sizes. Pipe sections can also be used in combination with Type II Flexible Panels
to meet specific thickness requirements.

With the
exception of Hydrophobic Grade, all Microporous Insulation is permanently
damaged by liquid water. Therefore protective jacketing must be used when the
application is subjected to potential environmental conditions or water spray.
Likewise, care must be taken during transportation, storage, and installation
to prevent contact. Humidity does not degrade Microporous Insulation.

The standard facings for most Microporous
Insulations are high temperature
glass fabrics that have a use
temperature that is below the maximum use temperature of the core. In the
majority of applications, the Microporous Insulation is further jacketed,
encapsulated, or sandwiched with other materials in a static environment. In
these environments, the facing provides mainly a handling and installation
benefit. In applications where the product must function dynamically at
temperatures above 800°F, the product should be encapsulated in materials
appropriate for the environment.

Typical values
for thermal conductivity in Btu•in/(hr•ft²•°F) are 0.15 at 392°F, 0.17 at
752°F, and 0.19 at 1112°F. Microporous Insulation has compressive strength of
80 psi for a 10% deflection in a typical board product.

Microporous
Insulation is most often used where a maximum amount of thermal resistance is
needed with minimal thickness and weight. Typical applications include piping
and equipment operating at temperatures above 250°F, tanks, vessels, heat
exchangers, valve and fitting insulation, exhaust ducts, electronic
instruments, and fire protection.

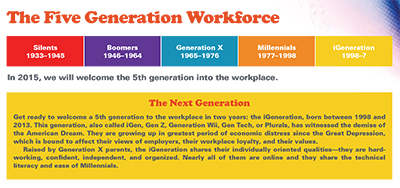
Demographers have noted that,
beginning in 2015, we will have five generations in the workforce.

Welcome to
Workforce 5.0. Why 5.0? We are on the cusp of yet another generation entering
the 4-generation workforce. Demographers have noted that, beginning in 2015,
we will have 5 generations in the workforce. Now is the time to learn new
approaches to understand, work alongside, and manage multiple generations of
employees, colleagues, and customers.

Today’s Multigenerational Workplace

Each of the
generations working today carry their own perspectives, changing priorities,
work ethic, and distinct and preferred ways of working and being managed. That
is because within each generation, members are shaped or influenced by the same
events, experiences, and images—typically those things happening in the world
when the generation was coming of age, between the ages of 17 and 23. The
experiences of our youth shape our points of view. Additionally, our age and
our life-stage dictate some of our needs and preferences.

Appreciating generational
dynamics allows you to find common ground with colleagues and employees from
all generations, and communicate information they want in the manner they want
it. Understanding a client’s age-based point of view is an indispensable soft
skill that you can use to establish connections, communicate effectively, and
make the sale. Another area where this is helpful is in leading people of all
ages. Supervisors and managers today will be more effective if they can “manage
the mix.”

Let’s start with an overview of
the generations to begin to understand “where they’re coming from,” as a Baby
Boomer might say.

Meet the Generations

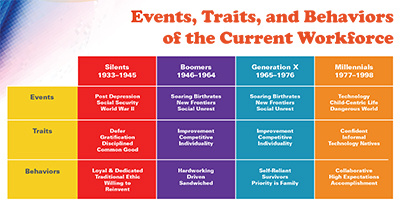
The Silent Generation
(Born 1933–1945)

The 50 million members of the Silent Generation
defy generalization, as they appear more diverse than the other generations.
While many Silents have already left the workforce, plenty of others remain,
and they are reinventing the concept of career maturity and retirement. They
see themselves as vigorous, contributing members of the workforce.

The oldest members of this generation grew up in the aftermath of the
Great Depression. However, in their lifetimes, their financial cycle moved from
a cashless childhood to an affluent adulthood, due in part to economic growth,
plentiful jobs, retirement benefits, and their propensity to live well within
their means as a generation. They built their success on hard work,
self-discipline, and postponing material rewards.

As a generation, they put the group before the individual, making them
strong team players. Sometimes referred to as the “facilitative generation,”
many Silents have taken leading national roles as diplomats, civil rights
leaders, and distinguished civil servants and politicians. Employees from this
generation are often described as disciplined, loyal team players who work
within the system. They have a huge knowledge legacy to share, and they embody
a traditional work ethic.

How do Silents fare in today’s workplace? Their experiences, along with
their disposition toward service, make them excellent coaches and mentors, and
their sense of fair play makes them helpful workplace arbitrators and
mediators. Silents prefer due process—they often create and use formal
procedures—combined with adhering to the rules. They value moderation,
preferring to think things through before taking action.

Baby Boomers (Born
1946–1964)

Composing the most populous generation in the
United States, the 76 million Baby Boomers typically grew up amid economic
prosperity, suburban affluence, and strong nuclear families with stay-at-home
moms. Some researchers divide the Baby Boomers into two groups: those born
between 1946 and 1954 (the “Woodstock” group, known for their idealistic
endeavors and social conscience), and those born between 1955 and 1964 (the
“Zoomer” group, known for their preoccupation with “self”).

Boomers came into the workforce
en masse and made the rules that many companies play by. They are ambitious,
and many define themselves by their careers. The Boomers’ paradox today is that
many are reaching a stage in their lives marked by ambivalence about the very
rules they created. Nevertheless, the generation tends to be optimistic,
competitive, and focused on personal accomplishment.

They continue to work hard,
working more than the historical 40-hour workweek. As younger generations enter
the workplace, Boomers are expecting them to pick up this traditional approach
to work.

This generation is comfortable in the culture they have created, and
they view change as sometimes painful, yet inevitable. Many companies
experience their biggest generational conflict when Boomer managers are
confronted with younger employees who do not fit the mold that they created.

Generation X (Born
1965–1976)

The 41 million members of “Gen X” live with the
corporate footprint of previous generations and are reshaping organizations to
meet their generation’s priorities. They prefer to work independently and are
highly committed to good bosses, stimulating projects, and capable peers.

Members of Generation X grew up
in a very different world than the previous generations. Divorce and working
moms created “latchkey” kids out of slightly more than half of this generation,
which led to traits of independence, resilience, and adaptability. Generation X
members feel strongly that they do not need a supervisor constantly looking
over their shoulders. They prefer hands-off management and mentoring, and
micromanaging does not work with them.

Generation X saw their parents
face job insecurity and layoffs, and many of them entered the workplace in the
early 1980s, when the economy was in a downturn. Because of these factors, the
generation has redefined loyalty. Instead of remaining loyal to their company,
their loyalty is most often to their work, their team, and their immediate
boss.

Today, Generation X is solidly
at career midpoint. They are managers, tenured employees, business owners—and
they are busy raising families and contributing to their communities. They
expect time flexibility that allows a separation of work from family. Rather
than buy into the Boomers’ work ethic of long hours at the office, Gen Xers
focus on getting the job done through nontraditional work hours, job-sharing,
telecommuting—whatever works.

This generation takes
employability seriously, although for them, climbing the career ladder has been
replaced with building a career portfolio, which they continue to grow,
building a skill set that supports their need for independence even as they
attain increasing levels of responsibility. They can move laterally, stop and
start—their careers are fluid, with on and off ramps.

Millennials (Born
1977–1998)

The youngest generation in today’s workforce was
raised at the most child-centric time in our history. Perhaps it is because of
the showers of attention and high expectations from parents that many
Millennials display a great deal of self-confidence, to the point of appearing
cocky.

This generation is packed with power and potential. The challenge for
their managers is to live up to the high standards and expectations the
Millennials bring to the workplace.

Sometimes coached by their parents, Millennials do not seem to see the
value of paying their dues or earning their stripes. Many perform best with
some structure, especially younger Millennials who are newer to the
workplace—they are learning to work as well as learning the work. Many Millennials
also have a bit of a “whatever” view of title and position, showing less
reverence for positions that are simply based on experience, which they think
Baby Boomers overemphasize.
Millennials respect knowledge and learning. They want a relationship with their boss, which
does not always mesh with Generation X’s preference for independence and
hands-off style. Millennials will leave for greener pastures if challenge,
learning, and fun are absent from their work.

That said, Millennials are
typically team-oriented and work well in groups, preferring collaborative work
to individual endeavors. In addition, they are used to tackling multiple tasks
with equal energy, and they expect to work hard. They are effective at
multitasking, having juggled school, sports, and social interests as children.

As you might expect, this group
is technically literate as no one else. Technology has always been part of
their lives—whether it is mobile phones, text messaging, YouTube, Facebook, or
Instagram.

Today’s Shifting Demographics

You have
probably seen this in your own organization: Today’s workforce is aging because
Silents and Boomers are staying on the job longer, and avoiding retirement for
financial reasons or reluctance to stop working. From 2006 to 2016, the labor
force of those aged 65 to 75 is predicted to grow at a rate of 80%—and for
those aged 75 and older, at a rate of 78%.

Meanwhile, Millennial workers
are no longer a novelty as their numbers increase. In fact, by 2014,
Millennials will approach 47% of the workforce! However, a large number of this
group is currently unemployed or underemployed due to the economic downturn.

As the economy picks up, watch
for more Millennials (a generation nearly as large as the Baby Boomers) to
start snapping up new jobs in all industries, while Silents and Boomers
continue to hang onto employment, and Gen X seeks to move up or on in their
careers. All of this will take place in an economy that is increasingly
knowledge- and services-based, technology driven, and global. The competition
for jobs is only going to get fiercer as members of all generations will be
competing for positions that are still limited.

Today, and in the near future, it will be less and less common to be
working with your peers; you will be working with all these different
generations. If you are a manager, you are the leader of people of all ages,
and will be for the rest of your career.

Managing the Mix

In a recent study by the Society of Human Resource
(HR) Managers, almost 25% of HR professionals reported generational conflict in
their workplace, and a full 60% of employers are experiencing tension between
employees of different generations. While 47% of younger employees surveyed
complained that older managers were resistant to change, 33% of older employees
found younger workers’ informality and need for supervision problematic.

You probably do not need these
statistics to know that the generational mix in today’s workplace can be
challenging. Managers and supervisors who are armed with the knowledge, skills,
and practices to engage with each generation can go a long way to reducing the
statistics cited above. When you can meet the preferences and priorities of
each generation, communicate in ways that are effective and appropriate, and
understand everyone’s career goals and values, you also will have completed
much of the heavy lifting needed to recruit and retain good employees of all
ages.

The starting point is to remind yourself which generation you are
building a relationship with and speak to that generation’s quirks and
qualities, which will make your management style more effective. Note: Please
do not ask an employee his or her age or birth year! Instead, look for clues,
asking questions like “Should I call or text?” or “Did you do anything interesting
this weekend?” The information you collect will help you make an educated guess
at the person’s generation and work-style preferences. Another approach is to
directly ask employees about their communication or work-style preferences.

We can apply some basic knowledge about each generation’s
characteristics and attitudes (combined with some common sense) to manage in
ways that improve our performance. Here are some best practices for various
aspects of management, broken down by generation. Note that the information and
tips below are intended to augment (not replace) your company’s HR employee
training and review policies.

Management Dos and Don’ts for Each Generation

  • Silents: Members of the Silent Generation expect a fair
    day’s work for a fair day’s pay. Therefore, it makes sense for you to develop a
    relationship with Silents focusing on the work, and recognizing and respecting
    their preferences for more formal protocol and etiquette. What generally will
    not work with them is acting too personal, using slang or profanity, or being
    disorganized or unprofessional.

  • Boomers: Build a relationship with Boomers that recognizes their
    contribution and hard work. Acknowledge their “sandwich” responsibilities of
    caring for children and parents by offering flexibility. When appropriate,
    encourage Boomers to lighten up a bit and let go.

  • Gen Xers: Adopt an approach that is hands-off and gives them
    autonomy. Tell them the goal and then get out of their way while they figure
    out how to get there. They value work-life balance, so offer options and
    flexibility.

  • Millennials: Give them projects and assignments that challenge
    them—continually. At the same time, offer structure, guidance, and frequent
    check-ins. Be a resource for them and, when possible, put them in team
    situations. What will not work: The hands-off style that Gen Xers prefer, being
    formal and fussy, or taking too much of their time.

Retaining the Generations

  • Silents: Create significant mentoring roles capitalizing on their
    strategic and bottom-line approach to the business. Appreciate and acknowledge
    their contributions.

  • Boomers: Provide work-life balance. Come up with new challenges
    that match their skills.

  • Gen Xers: Resist micromanaging. Offer flexible work hours and
    flexible work—change it up.

  • Millennials: Personalize their work. Create a collegial team
    environment.

Coaching the Generations

As a manager, your role should include coaching
individual employees, with a strong emphasis on providing feedback.

  • Silents: Make time for an in-person coaching conversation. Give
    these employees the opportunity to mentor others in your group.

  • Boomers: Fight potential skills obsolescence with reverse
    mentoring, conference participation, and key interactions. Stick with 3-minute
    coaching conversations.

  • Gen Xers: Build their skills portfolio and change it up
    regularly by giving them different challenges and opportunities. Candidly
    discuss their professional reputation. A quick email can be a coaching
    conversation.

  • Millennials: Explain the importance of seemingly routine tasks.
    Set specific expectations, targets, and goals, and give plenty of feedback.
    Text them coaching tips or direction.

Communicating with the Generations

  • Silents: This generation prefers face-to-face meetings, phone,
    and mail. Technology will not always seem like a solution to them, but do not
    underestimate their comfort with the Internet, email, etc.

  • Boomers: Boomers also like face time and phone conversations.
    Like Silents, they may be quite comfortable browsing your blog or sharing
    Tweets.

  • Gen Xers: Reach them on their computers and smartphones with
    email, web-based information, and social networking. Remember, they generally
    like plenty of hard data to help them make a sales decision.

  • Millennials: It should come as no surprise that this generation
    relies heavily on e-communications, including text messaging and social media.
    They live at the speed of light and expect immediate responses to their
    communications.

Motivating the Generations

  • Silents: The top motivators for Silents are challenge,
    stimulation, and variety; the knowledge that they are making a difference;
    appreciation; and autonomy. They are de-motivated by reporting to a bad boss;
    boredom and lack of challenge; an inability to learn and grow; and lack of
    appreciation.

  • Boomers: This generation is motivated by challenge,
    stimulation, and variety; the knowledge that they are making a difference;
    appreciation; and an enjoyable environment. They are de-motivated by lack of
    appreciation; reporting to a bad boss; boredom and lack of challenge; and
    micromanagement.

  • Gen Xers: This generation is motivated by challenge,
    stimulation, and variety; career growth and learning; having work-life balance;
    and the knowledge that they are making a difference. They are de-motivated by
    reporting to a bad boss; micromanagement; lack of appreciation; and no
    work-life balance.

  • Millennials: This generation is also motivated by challenge,
    stimulation and variety; career growth and learning; an enjoyable environment;
    and pay. They are de-motivated by boredom and lack of challenge; lack of
    appreciation; reporting to a bad boss; and an inability to learn and grow.

A Good Boss to All Ages

With all this
information about how to manage diverse employees, how can we be good bosses?
The good news is that you can be a good boss to every single employee without
coming across as a bad boss to any one generation. For example, a good boss
makes an effort to build a climate that fuels engagement.

To create an enjoyable and
engaging climate, begin by imagining your employees are volunteers, not paid
employees. Identify what about your leadership keeps them coming to work for
you. Follow these basic tips:

  1. Keep
    commitments and appointments with employees.

  2. Schedule
    lunch with employees; take time to get to know each of them.

  3. Keep
    your sense of humor, celebrate successes, and encourage relationship building.

  4. Know
    every employee’s name, family members’ names, and at least one hobby and
    outside interest.

  5. Consistently
    reaffirm the value of the employee to the team, the department, and the
    organization.

  6. Consider creating competitive challenges (such as
    outdoor sports activities) with other teams or departments.

  7. Give back—to your team, the company, and the
    community!

A good boss
leads with frequent feedback and communication.

  1. At
    least once a month, tell people why and how their work is significant.

  2. Frequently
    express appreciation for each employee’s contribution.

  3. Walk
    around, say hello, and greet people at the beginning of their day.

  4. Connect
    with people in person, by email, phone, text, or instant messaging.

  5. Make
    sure employees see the link between their work and the organization’s mission,
    goals, and values.

  6. Use
    positive messages (rather than “or else” statements) to inspire.

Meet with employees once a month to discuss work.
Ask:

  • What’s going well?

  • What’s not going well?

  • What can I do to support you?

A good boss dispels the old
“it’s just a job” mentality by committing to the workforce a future of
contribution, meaningful work, and mutual success. These actions will appeal to
all generations:

  1. Work
    with employees to develop a list of potential projects, challenging
    assignments, and tasks that could enhance their careers.

  2. Have
    a career conversation. Make arrangements for a quiet place without
    interruptions and focus on the employee and his or her career. Ask:

    • What do you like about your work?

    • What talents do you have that are not being used?

    • Are there other projects or
      assignments of interest to you?

    Confirm that the employee has a career path or professional development
    plan.

  3. Arrange for a senior manager to meet with your
    employees. Ask the manager to talk about his/her own lessons learned and
    how to manage one’s career.

  4. Have
    a team member spend time with an important customer, then discuss the key
    learning.

  5. Develop
    a training plan for your team that encompasses the skills your team members
    need now to make sure they are prepared for the future.

  6. Switch
    things up. To freshen routines and enable cross training, have employees switch
    roles for a day (or half a day), then meet as a group to discuss what was
    learned.

  7. Schedule
    “Power Down Days” for yourself and delegate tasks to team members. Do not take
    on any tasks that team members can handle effectively.

In Conclusion

This may seem like an overwhelming amount of
information to absorb and incorporate into your management style. However, by
increasing your awareness of the different work styles and preferences of the
4—soon to be 5—generations in your workplace, and making some simple
adjustments to how you lead each one, you will improve your own quality and
enjoyment of work as well as that of your employees.

Figure 1
Figure 2

As a part of
efforts by the Department of Energy’s Advanced Manufacturing Office to improve
the energy efficiency of the U.S. industrial and commercial sectors, the
National Insulation Association (NIA), in conjunction with its Alliance
partners, worked to design, implement, and execute the Mechanical Insulation
Education & Awareness Campaign (MIC).

The MIC is a program to
increase awareness of the energy efficiency, emission reduction, economic
stimulus potential, and other benefits of mechanical insulation. An integral
component of the MIC was the development of a series of “Simple Calculators.”
The calculators, listed below, provide users with instantaneous information on
a variety of mechanical insulation applications in the industrial/manufacturing
and commercial markets.

  • Condensation Control for Horizontal Piping

  • Energy Loss, Emission Reduction, Surface Temperature, and Annual Return
    for Equipment and Piping

  • Insulation Financial Returns

  • Estimate Time to Freezing for Water in an Insulated Pipe

  • Personnel Protection for Horizontal Piping

  • Temperature Drop for Air in an Insulated Duct or Fluid in an Insulated
    Pipe

The calculators are online as part of the National Institute of Building
Sciences’ Mechanical Insulation Design
Guide (MIDG), www.wbdg.org/design/midg_calculators.php. You can also access them through a link on NIA’s
website: www.insulation.org. The calculators are fast, free, and
functional tools that make it easy to discover energy savings, financial
returns, and other information for the design of mechanical insulation systems
for above- or below-ambient applications.

This article provides an
overview and a guide on how to use the Financial Returns Calculator and the
Personnel Protection for Horizontal Piping Calculator.

Insulation Financial Returns Calculator

Insulation systems are frequently designed with the
objective of minimizing costs. Properly designed insulation systems can reduce
heat loss or gain from (or to) mechanical systems by 90 to 98%. Since energy
must be purchased to offset these heat flows, insulation systems can quickly
pay for themselves in reduced energy costs.

Insulation projects, like many
energy-conservation projects, generally involve making an initial investment
that will result in future cost savings. A number of approaches can be used to
measure the financial desirability of an insulation project. All require
estimates of the initial investment (in this case, the installed cost of the
insulation system) and the resulting future savings. Some of these financial
measures are simple, like return on investment (ROI) and simple payback period.
Others are more complicated and take into account the time value of money,
inflation, and taxes.

This calculator was developed
to provide a convenient way to estimate the financial returns related to
investments in mechanical insulation: simple payback in years, internal rate of
return (IRR or ROI), net present value (NPV), and annual and cumulative cash
flow. It can be used for an overall mechanical insulation project or for a
small investment such as insulating a valve or replacing a section of
insulation. Tax implications of the investment have not been considered in the
Financial Calculator. You should consult your financial advisor for specific or
tailored financial calculations. (For further information on the definition of
terms used in the calculator, please refer to the MIDG website.)

The calculator requires input information for five variables. The
“Results” and “Calculations” sections are updated as each input variable is
entered. Here are instructions and additional information for each input
variable. Sample inputs appear in a box, after each instruction.

  • Line 1. Enter the cost of installing or replacing insulation, $10000

    The default value is $10,000. However, you may
    enter any positive dollar amount. You may use the overall cost of a mechanical
    insulation project, or a small mechanical insulation investment.

  • Line 2. Enter the estimated energy
    cost savings during the first year, $/yr
    5000

    The default value
    is $5,000/yr; however, you should enter the estimated savings for the scope of
    work you identified in Line 1. You can use the Energy Calculators for
    Horizontal Piping and Equipment within the MIDG Simple Calculator section to
    estimate the annual savings. See the March 2013 issue of Insulation Outlook
    for instructionson on using the Energy Calculator for Horizontal Piping.

  • Line 3. Enter the projected
    annual energy cost escalation rate, %/yr 3.0

    Energy cost savings after the first year are assumed to increase at the
    energy cost escalation rate. The default value is 3%; however, you should enter
    your best estimate of the percentage

    that you expect the cost of your energy source to increase by
    annually over the life of the scope of work identified in Line 1.

  • Line 4. Enter the estimated economic life of the insulation system,
    yrs
    20

    The default value
    is 20 years; however, you should enter your best estimate as to the expected
    useful life for the scope of work identified in Line 1.

  • Line 5. Enter the discount rate
    for NPV calculation, %
    5.0

The default value is 5%. NPV is the difference between the present value
of cash inflows and the present value of cash outflows. The input box requires
selection of an appropriate discount rate, sometimes referred to as the “hurdle
rate” or the “required rate of return.” It should be established as equal to
the highest rate of return available on alternative investments of comparable
risk, or a company-established minimum threshold.

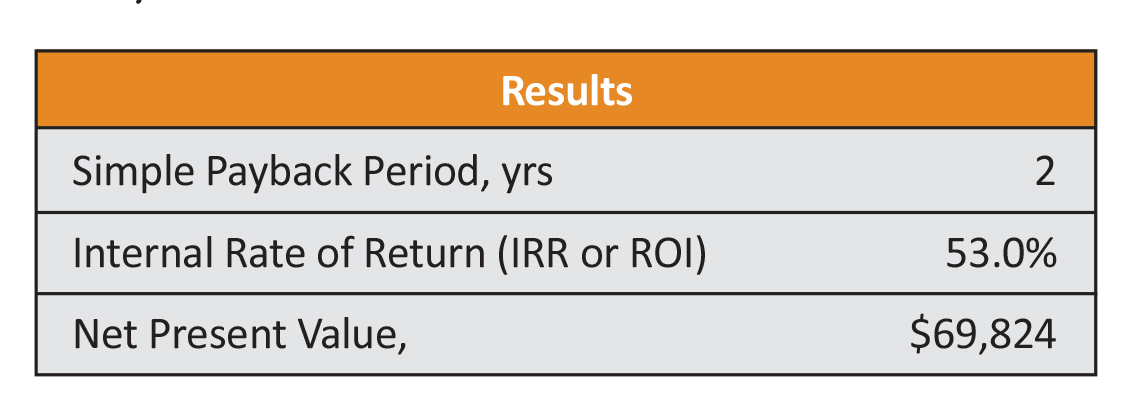
Based on the input information entered, the “Results” section provides
the calculated simple payback period, IRR or ROI, and NPV. An example using the
default values for all input variables is shown below. Note that the simple
payback is calculated as the initial cost divided by the first-year savings.
The calculator assumes that initial investment occurs at the beginning of Year
1, and annual savings occur at year-end. Savings after 20 years are ignored.

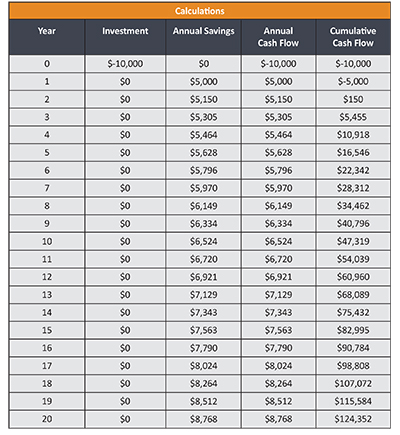
The “Calculations” section, using the default values for all input
variables, is shown below. This section illustrates the initial Investment, the
Annual Savings, Annual Cash Flow, and Cumulative Cash Flow over the economic
life of the application. Using the default value examples, a $10,000 initial
investment yielding $5,000 of first-year savings will yield $124,352 net of the
initial investment—before discounting—at the end of 20 years. The NPV of this
investment is $69,824.

Personnel Protection Calculator for Horizontal
Piping

As described on the MIDG—Simple Calculators web
page, this calculator estimates the maximum contact exposure time on the outer
surface of a horizontal pipe insulation system based on the potential for
contact burn injuries. Input requirements include the pipe size, operating
temperature, ambient temperature, wind speed, and details about the insulation
system (material and jacketing).

The maximum contact exposure
times are estimated using the procedures outlined in ASTM C 1055-03 (Reapproved
2009) Standard Guide for Heated System Surface Conditions that Produce Contact
Burn Injuries. This guide establishes a means by which the engineer, designer,
or operator can determine the acceptable surface temperature of a system where
contact may be made with a heated surface.

For the purposes of this calculator, the maximum contact exposure times
are based on an acceptable injury level of first degree burns (reversible
epidermal injury, or the limit represented by the lower “Threshold B” curve
shown in Figure 1 of the Standard). Acceptable contact times will depend
on the application. The Standard recommends, based on a survey of the medical
literature, 5 seconds for industrial processes and 60 seconds for consumer
items.

The insulation materials
included in this calculator were selected to be representative of some of the
materials commonly used in the industry. The list is not inclusive of all
materials types and other materials are available. The calculator does not
screen for material temperature limitations, so use caution when selecting the
materials.

For further information on the
thermal conductivity data used in the calculator, please refer to the MIDG
Personnel Protection Calculator for Horizontal Piping. Also note that some
materials are not available in all of the sizes and thicknesses covered, and
some are available in sizes and thicknesses not listed.

The calculator requires input
information for 6 variables. The “Results” section is updated as each input
variable is entered. Following are the instructions and additional information
for each input variable.

  • Line 1. Select Nominal Pipe Size NPS 4

    The default value is an NPS of 4″; however, you
    can select any pipe size from ½” to 24″ from the drop down box.

  • Line 2. Enter operating (process) temperature, °F 800

    The default value
    is 800°F. You should enter the actual operating or process temperature.

  • Line 3. Enter average temperature of the air surrounding the pipe, °F
    75

    The default value
    is 75°F; however, you should enter the average surrounding or ambient operating
    temperature, in Fahrenheit, for the area in question.

  • Line 4. Enter the wind speed of the ambient air (if unknown, use 0
    mph for worst-case conditions)
    10

    The default value
    is 10 mph. However, when in doubt, use 0 mph, which represents the worst-case
    conditions.

  • Line 5. Select an insulation material Mineral Wool (to 1200°F)

    The default box
    indicates Mineral Wool; however, you may select one of eight insulation
    materials from the drop-down box: Calcium Silicate, Cellular Glass,
    Elastomeric, Fiberglass, Mineral Wool, Polyethylene, Polyisocyanurate, or
    Polystyrene.

  • Line 6. Select the effective emittance of the exterior surface
    0.80 – Painted Metal

    The default box
    indicates painted metal; however, you may use the drop-down menu to select one
    of twelve exterior surfaces. For a detailed discussion and definition of
    emittance, please refer to the MIDG website.

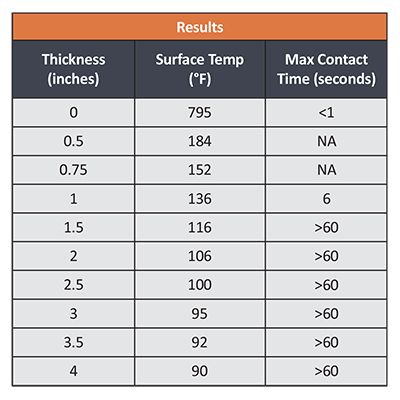
The “Results” section, using
the default values for all input variables, is shown below. The section
illustrates, for a range of thicknesses of the insulation material selected,
the calculated surface temperature and resulting maximum contact time in
seconds.

Note that the Personnel Protection Calculator incorporates a number of
important simplifying assumptions. Refer to the MIDG web page for further
discussion of these assumptions.

Summary

While they do not address every insulation material
or application condition (thus the term, Simple Calculators), the Simple
Calculators are intended to provide the user with online, easily accessible,
snapshot information on some of the most frequently asked-about benefits and
design considerations of mechanical insulation systems.

Whether you need basic
insulation information or are designing a complex insulation system, MIDG (www.wbdg.org/design/midg_introduction.php)
is a tremendous resource for the novice or the experienced user. Along with the
calculators, it contains everything you need to know about the design,
selection, specification, installation, and maintenance of mechanical
insulation. MIDG is continually updated with the most current and complete
information, including the Simple Calculators. These tools can be very helpful
in designing a mechanical insulation system and they allow the user to easily
determine the many benefits and value of mechanical insulation.

Figure 1
Figure 2
Figure 3

Molded Expanded Perlite
Insulation Products

Molded Expanded Perlite
insulation is defined by ASTM as insulation composed principally of expanded
perlite and silicate binders. It may also contain
reinforcing fibers.

Perlite Pipe and
Block Insulations are covered by ASTM C610. The standard covers the material
for operating temperatures between 80°F and 1200°F.

Perlite pipe
insulation is supplied as a hollow cylinder split into half or
quarter sections, or as curved segments. Pipe insulation sections are typically
supplied in lengths of 36″, and are available in sizes to fit most standard
pipes. Available thicknesses range from 1″ to 4″ in ½” increments. Thicker insulation
is supplied in nested sections.

Perlite block insulation is supplied in lengths of
36″ and 1 meter, widths from 24″ and in thickness from 1½” to 6″ in increments
of ½”. Perlite molded fitting cover insulation is available for a wide variety
of standard elbow and tees.

Scored and V-Groove
sections are also available. Special shapes such as valve or fitting insulation
can be fabricated from standard sections.

Perlite is normally
finished with a metal or fabric jacket for appearance and weather protection.

The specified
maximum thermal conductivity for both block and pipe insulation is 0.48
Btu•in/(h•ft²•°F) at a mean temperature of 100°F.

Perlite insulation
products also comply with the ASTM C610 requirements for flexural (bending)
strength, compressive strength, weight loss by tumbling, moisture content,
linear shrinkage, water absorption after heat aging, surface-burning
characteristics, and hot surface performance. Additionally, it complies with
the standard for use in contact with austenitic stainless steel.

Typical applications include piping and equipment
operating at temperatures above 250°F, tanks, vessels, heat exchangers, steam
piping, valve and fitting
insulation, boilers, vents, and exhaust ducts.
Perlite insulation is often used in insulation systems where water may enter
and cause corrosion or process problems. Examples of this would be wash-down
areas, deluge testing, pipes that cycle in temperature, and stainless steels that
are susceptible to stress corrosion cracking.

Figure 1

The
mechanical insulation industry, and the economy as a whole, continues to
rebound from the recent recession. The recovery is slow and varies by region,
market segment, and even within states. The good news is that the industry is
slowly recovering and the signs are there, although fragile, for continued
moderate growth. The industry is moving forward.

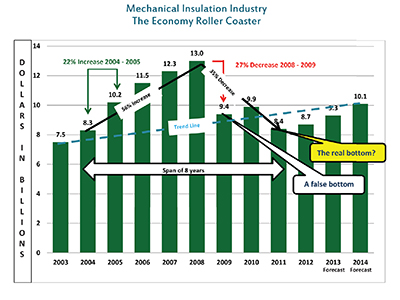
After
years of significant growth (2003–2008), the commercial and industrial
mechanical insulation market saw a decline in 2009 of over 27%. The 2010 survey
indicated that the industry had potentially bottomed out and was beginning to
recover. Like many other industries, we soon found that optimism was unfounded
and we had encountered a false bottom. 2011 yielded a 14.7% decline from 2010,
which—for all practical purposes—erased the gains of 2005–2008. Margin erosion
represented a significant portion of the 2011 decline. It does appear, however,
that the bottom has been reached, with 2012 showing 3.5% growth over 2011.

While the growth in 2012 is encouraging, it is
unfortunately beginning from a smaller base, and the general economic recovery
is still tenuous and subject to sudden change. Thus it is not a question of
whether the recovery has begun, but at what pace it will continue. For the
first time, the industry survey asked respondents to provide information
relative to growth expectations for 2013 and 2014. The respondents were
confident about the recovery and indicated they were expecting, on average, a
total of 7% and 8.9% growth, respectively.

The survey was sponsored by the National Insulation
Association (NIA) Foundation for Education, Training, and Industry Advancement
(Foundation). The goal of the survey is to obtain valuable data regarding
sales, market size, and growth for the U.S. commercial and industrial
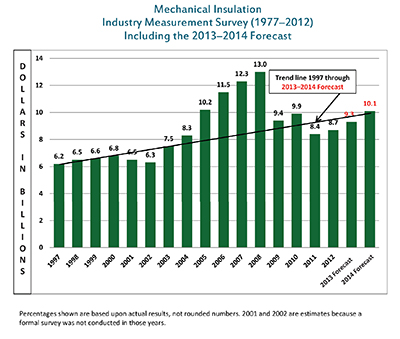
mechanical insulation market. Since the first survey was completed in 1997, the
market has shown a net growth that equates to a 2.4% annual compounded growth
rate. While that compounded growth rate may not seem overly impressive, you
must consider that the recent recession drove an industry decrease of over 35%
from 2009 through 2011. Over the 16-year period in which the survey has been
conducted, the range of growth has varied from over 22% in 2005, to a decrease
of more than 27% in 2009. That is a severe variance in a relatively short
period of time.

While
survey results are always subject to individual interpretation, the following
takeaways have been generated through discussions held both before and after
the tabulation of survey data.

  • The survey is based upon dollars, not units, and a consistent approach
    has been utilized over the 16-year period. Based on the survey methodology, the
    results should reflect conservative numbers. The survey does not include data
    related to metal building insulation; heating, ventilating, and air
    conditioning (HVAC) duct liners; original equipment manufacturer products; building
    insulation; refractory products; other specialty insulations; or insulation
    products or technologies not currently encompassed in NIA’s scope of mechanical
    insulation products. The value added by fabricators and laminators has not been
    accounted for, nor has the potential impact of imported products from outside
    North America.

  • The survey is meant to be a national picture for the respective calendar
    year. Based upon observations and feedback, there are significant geographical
    and product variances in the survey results. This is consistent with any survey
    of such a broad nature.

  • The growth exhibited in 2010 could have been created by a simple spike,
    or by completion of backlog carried over from 2008, which would indicate the
    decline in 2009 was potentially deeper than originally reported.

  • The industry declined from its peak in 2008 ($13.0 billion) by 35.4%, to
    what we assume/hope is the bottom of the recession ($8.4 billion) in 2011.

  • Every channel experienced some degree of margin reduction in the 2009
    and 2010 reporting period. On average, it is estimated that the decline was 1.5
    points. Over 28% of the decline in 2011 is attributable to the margin decline
    in the distributor and contractor segments. The margin decline in the
    manufacturing segment is not known, but it is expected to be in the same range.
    In all likelihood, the decline in 2011 was closer to a 60:40 ratio—60% in units
    with 40% margin erosion. The growth in 2012 appears to be substantially all
    unit growth.

  • Accessory products on a dollar
    comparative basis to core insulation materials declined similarly in 2011 as in
    2010, at 11.2% and 11.9%, respectively, while core insulation product growth in
    2012 over 2011 was significantly higher, at 5.0% versus 0.9%, respectively. The
    breakdown of the 2011 decline is not known, but it is thought to be reasonably
    split between unit decline and margin erosion. The 2012 growth seems to
    indicate that growth in interior mechanical insulation systems, generally used
    in the commercial market, was greater than in the industrial market, which can
    require more extensive finishing systems.

  • Over 78% of the survey respondents provided input to the 2013 and 2014
    growth expectation questions. For 2013, the growth expectations ranged from 3%
    to 15%, with the average being 7%. For 2014, the range was 3% to 17%, with an
    average of 8.9%. If one omits the overly modest and confident respondents, the
    averages are 6.6% and 8.9%. Those expectations seem to be reasonably in line
    with the overall commercial and industrial construction market forecast.
    However, that also begs the question: has the mechanical insulation industry
    forecast taken into consideration the lag time between construction starts and
    mechanical insulation installation requirements? The industry forecast does not
    differentiate growth expectations between new construction, retrofits, or
    maintenance. Historically, forecasts of this nature include a blend of each,
    with new construction being the largest percentage. Regardless, the forecasts
    are optimistic and refreshing after four rollercoaster years.

  • Approximately 50% of respondents
    separated their growth expectations between unit and dollar growth. Based upon
    their responses, it appears that 60% of the growth for 2013 and 2014 will come
    from unit growth, and the balance in dollar growth. In other words, an increase
    in unit cost—or sales price, depending upon your point of view—is expected to
    represent 40% of growth expectations over the 2-year period. The ratio between
    unit and dollar growth is good news, as unit growth is important to sustained
    growth.

  • Unfortunately, the survey methodology does not allow for interpretation
    between the commercial and industrial market segments. As noted in previous
    surveys, the unit increases or decreases were probably led by the commercial
    segment, while the dollar increase may have been somewhat equivalent between
    the two markets. The decline in export product sales created by global economy
    issues would have contributed to the 2011 decline.

  • The survey readership always requests more information by segment,
    region, and a host of other meaningful categories. Obtaining that type of
    information, however, is dependent upon survey respondents choosing to disclose
    it.

The
last several years have been difficult; although signs of recovery were evident
in 2012, it was a challenging year. All
segments—manufacturing, distribution/fabrication, and contracting—responded to
the challenges, as they have in the past (although it is much easier, and more
fun, to respond to the challenges of growth versus decline). Though the economy
has been problematic in the past few years, the future is looking much brighter,
with the potential for sustained growth.

We
should not undervalue the impact the industry’s educational and awareness
initiatives have had. Without those efforts, the bottom may have been deeper
and the recovery even slower. I would like to extend a sincere thank you to
NIA’s Associate (manufacturer) Members who participated in the survey, the
individuals who contributed to the informal survey supporting data, and to all
the contributors to the NIA Foundation for Education, Training, and Industry
Advancement. The Foundation and your support are making a difference in the
industry.

Figure 1
Figure 2

We are not getting any younger. The day will come—sooner for some than others—when we have to hand over the reins of our company to… well, that’s the question, isn’t it?

If you own and operate your own construction company, chances are that you find yourself on the far side of 50. Chances are, too, that you have given some thought to the question above and are keeping an eye on recruitment—especially of younger men and women—not only into your own organization, but industry wide. There is a perception that these days we do not see enough young people choosing our industry as a career. This concern brings up questions about not only who will run your company after you retire, but who will lead the industry.

A Boring Industry?

Is construction as an industry less exciting or attractive than, say, advertising or architecture? Less glamorous than the attorney’s office? Less prestigious than the medical field?

The questions have two answers: In the public’s view, working in construction and related trades means “holding up a SLOW sign by the side of road construction” (to quote Chuck Taylor, director of operations at Englewood Construction, Inc., in Illinois). Those who actually do work in construction, where no 2 days are alike, see it as every bit as exciting as, and probably more rewarding than, advertising or lawyering (though perhaps not as prestigious as putting “M.D.” after your name).

<span ‘letter-spacing: -.1pt’>Although the construction industry is embracing advanced technology—e.g., Building Information Modeling (BIM), estimating software, integrated management and reporting platforms, and instant digital communication between field and office—the public at large, including today’s high school and college graduates, is unaware of how this work is becoming cutting edge.

Attracting the College Graduate

Why should a college graduate look to construction as a career?

“I think college students should follow their talents and ambitions,” says Greg Smith, vice president at Mowery-Thomason, Inc. in California. “But construction would be a good choice, since the work cannot be outsourced. It can be a very good career for ambitious young people who are not afraid to work.”

Tom Clerkin, president of Ceilings, Inc. in Pennsylvania, concurs: “Our industry is a high-salaried environment conducive to college graduates both in the office and the field. My company currently has apprentices who are college graduates.”

“Construction is becoming more and more technical by the day,” says Dave DeHorn, chief estimator at Brady Company/Los Angeles, Inc. in California. “Also, construction is always changing. If you are someone who likes variety, then the construction industry might be a good choice for you… Colleges have offered a construction management degree for the last 10 to 15 years,” DeHorn continues. “Some of the major general contractors throughout the United States are finding their workforce in these colleges.”

Adam C. Navratil, vice president of operations at J&B Acoustical, Inc. in Ohio, concurs: “I think that there is plenty of opportunity in the construction industry. While the economy is still slow, the need for tech-savvy employees will continue to grow as we move forward.”

“I think college graduates should consider a construction career,” says Chuck Taylor, “because the baby boomers that currently run this industry are approaching the end of their careers, which will leave many large holes to fill.”

“Today, many universities offer degrees in construction management,” says Eric R. Peterson, president of Dayton Walls and Ceilings, Inc. in Ohio. “In most cases, they partner with local construction companies to provide co-op opportunities for their students. This way, a graduate enters the workforce with a background that enables him or her to be productive almost from day one. I know; I have two such employees in my office… As for a career, most people in the construction field are very passionate about their jobs and their companies. At the end of the day, they have built something!” Peterson adds, “Lastly, in our industry, compensation and benefits are attractive even at the entry level.”

Brittni Daley-Grishavea, chief financial officer at Daley’s Drywall and Taping in California, also sees construction as a viable college graduate career choice. “Construction is one of the most interesting industries today,” she says. “You will never do the same project twice, and each day presents new challenges and opportunities.”

Richard Huntley, president at WeKanDo Construction in Puerto Rico, also stresses the challenging side of the industry: “Construction is still a fun and interesting industry, with no 2 days the same. You’re never bored with it; each job has its own challenges. Also, building things does give you a sense of accomplishment. Recently, we have worked some very interesting jobs, the kind that not only impacted our company, but other trades, and the island itself. Very fulfilling.” Huntley adds, “I have young kids, 4 and 2, and it’s a great feeling to tell them about what we’re doing, and to show them the buildings we’ve completed as we drive past—a real sense of accomplishment, a great feeling.”

“The way construction has changed over the past 10 years, I think that a person with an interest in construction should enroll in college programs that specialize in construction science and  technology,” says Mike Heering, president of F.L. Crane and Sons, Inc. in Mississippi. “It’s also important to note that our starting salaries are competitive with other industries.”

“The many technical aspects to both equipment and construction procedures these days would certainly provide the college graduate both opportunity and challenge,” says Roger Olson, president of Sig Olson and Sons Plastering, Inc. in Minnesota. “Also, there are more construction management positions available than ever before.”

In other words, a technically challenging, never-boring field that provides a deep and personal sense of accomplishment would be a good career choice for any college graduate.

The High School Graduate

What about those who choose not to attend college? Is there a career path for them in construction? Can they now, as in days past, start at the bottom and work their way to the top without a college degree?

“This is exactly the path I took,” says Smith, “and I believe that path still exists. Starting at the bottom means starting as an apprentice to acquire the valuable experience that can only be had in the field. However, those coming through the field ranks into management will have to learn the critical thinking skills the college folks obtain in school.”

“I believe they can,” says DeHorn. “However, I think it is getting harder and harder to do that each year. Today, there are so many facets to our industry that you need quite a few good people supporting the person at the top, and many of those have a higher education.” He adds, “I would not recommend starting at the bottom and working your way to the top without a degree. I would get the degree and then start at the bottom. Coming out of college and going into an entry-level construction job can be economically hard; however, if you are serious about this effort, you won’t stay at the bottom very long.”

“You can start at the bottom in field operations,” agrees Clerkin, “and work your way to a foreman or superintendent position, or at the bottom in the office and potentially work your way to ownership. However, I do not believe, in this day and age, that you can start at the bottom of the field as an apprentice and become the owner.”

“I tend not to think of it as starting at the bottom,” says Navratil. “Rather, I see it as working from the warehouse through the field. This path affords a person [a] valuable skill set [and] knowledge that a college education cannot provide. Also, you tend to make valuable and loyal employees out of those who are willing to work their way
through the ranks.”

“I think that the bottom is the only place to start,” suggests Taylor. “Even out of college, you have to start at the bottom, pay your dues. We have hired some engineers out of college, and we are starting them in the field as well, explaining to them why. And they do understand. Before you tell someone how to put up a sheet of plywood, you need to be able to put up that sheet yourself—always, always, always.”

“It certainly is not as common today as in the past,” says Peterson. “Today’s technology, for one, requires skills normally obtained at a higher education level than high school. However, hard work has been and always will be a major key to success in this industry; and if a person perseveres, they have a chance to get to any level.”

Daley-Grishavea also believes you can do well in the construction industry without having a college degree.
“While having a degree does give you a huge head start,” she says, “you can still develop a promising career without one.”

Rob Little, vice president at Little Construction Co., Inc., in Indiana, agrees. He says, “There is always a need for smart young people, especially with everything moving toward computers these days.”

“Absolutely,” agrees Huntley. “I know there’s the myth about needing a college degree if you plan to go anywhere these days, but it is not that important in construction. I believe that people skills and an ability to build relationships are much more valuable, and that you make sure to deliver the best product you can. If you can do that, you’ll make it, college degree or not. The construction industry is all about people.”

“You might be able to,” says Heering, “but not as easily as you could, say, 15 or 20 years ago. It will take someone who has set high goals for himself or herself and who is willing to do whatever it takes to gain expertise in the area of technology, which means some community college night schooling in computers, estimating, and management.”

“I believe you can,” says Roger Olson, “but a college degree combined with a trade skill would be a big advantage. Job-site experience is invaluable for those aiming for management positions, degree or not.”

John Hinson, division president at Marek Brothers Systems, Inc. in Texas, adds an observation from a different angle: “There is a shortage of E-Verifiable craftsmen and mechanic training programs in our region. I do believe our legislators are increasingly aware that the “college prep” high school classes are not suitable for all students,
and there must be a change in the future so that schools can get funded for vocational training as well as academic success.”

With the industry growing more technical and logistically demanding by the day, a career door that stood wide open only 20 years appears less so today; but the high school graduate who is willing to put in the extra effort and hours in both work and study can still make it to the corner office.

Values: Today Versus Yesterday

Because career choices are all about attaining what you consider valuable in life, addressing the next generation’s career opportunities also must address what they consider necessary for their happiness.

How do the values of today’s graduate, whether from high school or college, compare to those the older generation grew up with; and how should this be addressed at interviews or career-day presentations?

“The world is the size of a fist for these kids,” says Taylor, who also sits on a board of education in his area. “They look for instant gratification. You no longer fix things—like your cell phone or even television—you buy a new one. We have an attention-deficit generation on our hands? “We need to give these kids a sense of pride. We need to teach them the same lessons I was taught way back when training as a union carpenter: Construct it so well that you’re ready to put your name on it? “What we build will affect people’s lives, and we should be proud of having been part of these projects. You sleep better at the end of the day because of this.”

“In general,” says Craig Daley, president of Daley’s Drywall and Taping, “the youth of today seem to need more praise than we did. We were happy to have a good job and respected that, and we knew whether we did a good job or not, we did not have to be told. Of course, praise is nice, but lately it seems to have become a necessity? “Perhaps this is a byproduct of the social networks generation, of putting yourself out there, being judged, approved of or not, all the time.”

“I would say the values of today’s graduates are more corporate, and they look for a job where they can climb the corporate ladder,” says Daley-Grishavea (Craig Daley’s daughter). “Loyalty used to be a value, but I don’t think that is big with the new generation. For young people today, prestige is a bigger
thing than accomplishment. They usually see themselves being a lawyer or doctor, not having a construction-industry title? “Me, personally, I feel a huge sense of accomplishment in building things. That’s huge for me. Most young people do not appreciate the value of that.”

“I think it comes down to your upbringing,” says Huntley. “Each of us is an individual whether of a younger generation or not. That said, the older players always seem to take pride in their work, and they still always sweat the details to make sure the job comes out right. Some of the younger guys are only there for the money, and they will take shortcuts—but that’s true in all industries.”

“We visit high schools during career days,” says Heering, “and I like to tell them about the sense of pride
that I have looking at what I’ve created over the years. Today, I can drive by and show my kids some of the jobs I was part of, I can show them the buildings, and they remember that? “In construction, you create something that is a standing testament to what you’ve done. Compare this to going into an auto manufacturing plant, where all you are is another number to somebody. They will not know your name and what you really do, no identity—you work your hours and you’re out. Here, in our company, we’re like a family… “True, it’s not a gravy job. It can be hot and it can be cold. You have to have the passion.”

The values of loyalty, work pride, and a true sense of accomplishment at the end of the day run deeper than instant gratification and a quick buck—no matter how much you make. If you are to live a satisfying life, these values are not optional.

Industry Approach

What, then, should the construction industry as a whole do to attract younger talent?

“If people have an ambition for this industry, they will come regardless; and, frankly, those are the people we want,” says Smith. “They are here because they want to be here. They have a passion for building. If you come just for the money or the benefits or vacation, you won’t last long. But if you have the skill sets, ambition, and a passion for building, the money will follow.”

“We need to let career seekers know that this is an ever-changing and interesting field of occupation,” suggests Navratil.

Taylor adds, “We need to let them know about the sense of accomplishment you feel at the end of the day. Completing a job is kind of bittersweet: You’ve poured the foundation; it’s been your baby from the beginning; and now, no parades, just thanks. But even so, I feel a tremendous amount of pride walking down Michigan Avenue and seeing the buildings we have helped create. That’s a great feeling. That is something this industry offers way and above just about any other industry, and it’s something you cannot put a price tag on.”

“My company is working closely with vocational schools in our area to
change the perception of the industry,” says Peterson.

Adds Little, “That’s a question I have thought about for years and still cannot come up with a decent answer: How does a person change an entire generation into understanding that it takes hard work to be successful and not just have everything handed to them? ?”Money would help, but it’s a slippery slope if overhead costs go up too high. More benefits may help, but most young people don’t even understand the value of benefits. More vacation would help, I’m sure, but if they are always on vacation, how will they learn and get things accomplished? “?The construction industry needs to improve its image in order to make the younger generation see it as a great career choice. The medical, tech, and many other industries focus on glamorizing their fields. We need to follow suit. We need to do some serious marketing to the next generation.”

It is almost as if the great benefits of our industry—challenging, technically demanding, never boring, a constant source of personal pride—hide in a well-guarded secret. We must let it out of the bag.

Would you describe 2012 as a year that you are glad is in the
rear view mirror, a ho-hum year, or a year that exceeded your expectations? Is
2013 looking better, are you expecting more of the same, or are you worried
about the industry recovery slowing down? As you would expect, the answers vary
greatly by geographical area and the person you ask.

While the mechanical insulation
industry, and the economy as a whole, is rebounding, the challenges created by
the recent recession continue to impact the industry. Recovery is slow,
stretched out, and not uniform across market segments, the country, by region,
or even by or within a state. The good news is, the industry is slowly
recovering and the signs are there, although a bit weak, for continued moderate
growth. The industry is moving forward.

Politics

The gridlock on Capitol Hill over the past several
years has not helped, and may have hindered our nation’s recovery efforts. With
the general election and a portion of the fiscal cliff type issues behind us,
one can only hope that confidence in the economy will gain momentum and
bipartisan efforts will spur economic growth. However, realistically, there are
numerous difficult issues confronting the 113th Congress and the parties’
positions on many of these are vastly different. Those differences, and the
recent history of partisanship, will not help with the uncertainties many
businesses have in our economy. With the recent election, we again heard about
dissatisfaction with Congress and with politics in general. That message does
not appear likely to change anytime soon. Depending on the current Congress’
performance, officials hoping for election in 2014 could feel the impact of
that dissatisfaction. Clearly, meaningful and timely compromise is essential.

Thinking about the state of our industry, while we cannot ignore
politics and the economy, we should focus on what we can directly influence and
adapt to the economic trends in our market. There are reasons for cautious
optimism. Fundamentals are in place to deliver a slow, steady recovery for the
general economy and the mechanical insulation industry. Conditions are,
however, slippery; and in today’s environment, any event could affect the rate
and method of recovery.

Other Industry Factors

Analyzing the
industry across the board over the last year resembled
looking into a crystal ball while riding a
rollercoaster.
Fluctuating
market events did not present a clear industry picture. Consider the following:


  • A small number of relatively large
    projects in a given market area could indicate the market is robust, with no
    end in sight. However, further examination indicates that unless other project
    backlog increases, that area could and probably will be looking at a
    substantially different picture in the foreseeable future. This observation is
    not necessarily new, but the backlog cliff potentially is deeper.

  • The depth and breadth, volume, and duration of contractor backlog varies
    greatly. While it may be better than in 2009–2010, it is not close to the
    levels experienced in 2005–2008. In addition, the profit projection on that
    backlog is weaker than in the past.

  • Lower profit expectations are a direct result of increased competition
    in the number of bidders and normal securement pressures created by a
    recessionary environment. Not only are contractors looking at nontraditional
    markets, they are looking outside their normal geographical operating areas.

  • Generally, margins throughout all channels appear to be down 1 to 2
    percent or greater.

  • Operational cost reductions have been deep to offset the margin and unit
    sales reductions. Time will tell if those reductions will have a lingering
    impact on a company’s ability to maintain and grow market share in a recovering
    economy.

  • End of calendar year motivations to reduce inventory and/or achieve
    purchasing incentives can provide a false picture for the fourth and first
    quarters, potentially even carrying over to the beginning of the second
    quarter.

  • Attempts to obtain price increases throughout the channels over the last
    18 months have been extremely difficult. Renewed and committed efforts are
    expected to continue in 2013; however, price recovery is not expected to get
    easier.

  • With the economy showing signs of slow but steady recovery, projects put
    on hold in 2011 and 2012 could begin in early 2013. The impact of those
    projects on the mechanical insulation industry may not be felt until late 2013
    or early-mid 2014.

  • The industrial market has been soft over the last year, while the
    commercial market continues to show signs of a slow recovery.

  • Industry consolidation is alive and well, and expected to continue as
    the economy and industry recover. The distribution/fabrication segment has been
    the most active, as private equity investment and growth strategies have become
    an integral component of the industry. Time will reveal the success and
    sustainability of those strategies. The acquisition process is exciting, but
    the company culture and personnel integration process is where challenges
    appear-and where most of the industry chatter occurs.

Put all of the above factors
together and it appears the industry slowdown has hit bottom; and, while some
areas are not yet experiencing growth, the market appears to have stabilized. A
slow, moderate growth is forecast for 2013 and 2014. It is time to look ahead.

What are the
opportunities and challenges moving forward?

Each company has its unique profile of challenges
and opportunities. There are, however, a few overreaching industry challenges
that may or may not impact an individual company but are critical to the
industry as a whole.

Knowledgeable Employees

Over the last decade, and especially the last 5
years, the industry has lost a great wealth of experienced and knowledgeable
people. Whether the loss was due to attrition, down or right sizing,
consolidation, reorganization, the economy, etc. the loss is real and
impactful.

The loss and the challenges will primarily impact two areas.

1. Management and Sales

Marketing
personnel who not only understand their respective company’s strategy,
products, and markets but also the industry are vital. It may sound like a
cliché, but there is big difference between knowing your local market,
products, and customer base versus truly having an appreciation of the industry
as a whole, regionally and nationally. It is like understanding your role but
not how it impacts the bigger picture.

The solution is relatively easy but requires management’s commitment and
investment. Most company management understands the value to invest in people
in the form of continuing educational programs and networking with peers.
Unfortunately, in a down economy, the training and education budget is often
the first area to be cut and the last to be reinstated. Training, education,
and outreach initiatives may not yield immediate returns, but cutting their
budgets is somewhat short-sighted thinking if you are in the business for the
long haul. It is the age-old struggle between short-term earning demands and long-term
earning potential. There is a happy medium between the two, but too often
short-term demands rule.

Find that middle ground. Implement a continuing education program for
all levels in your company. Your program(s) should be inclusive of internal and
external training. Take advantage of industry in-person and electronic training
programs. Allow your team to obtain multiple views on the same subject; obtain
refreshers; and learn about new approaches, technologies, and resources that
are truly available at their fingertips.

Encourage your employees to participate in local, regional, and
national industry trade association meetings. Meeting industry peers,
suppliers, and even the competition is called “networking” and is of tremendous
value. Do not fear it—embrace it. Well-rounded knowledge and relationship
building in all industry segments is education at the highest real world level.
Unfortunately, not everyone can participate in all meetings. Not taking
advantage of the networking opportunities for your current and future
management team, though, is a waste of available and valuable resources, and
potentially restraining the capabilities of your key players.

The industry’s loss of
experienced and knowledgeable people is real, and it can only get worse over
time without a renewed and meaningful commitment to employee training,
education, and outreach programs.

2. Experienced and Talented Craft Personnel

Experienced, skilled people left the industry in
the past few years because of the economy and lack of work. Many believe this
is the major consequence of the recent recession and that, ultimately, a labor
shortage of skilled and experienced craft personnel will occur in the next few
years. Will a prolonged recovery attract them back?

This is a real-world problem that requires action and investment—sooner
than later. Those companies that invest now will differentiate themselves and
potentially have a competitive advantage going forward. As the saying goes,
anyone can obtain work, but profitable execution, schedule compliance, and
customer satisfaction is not a given—it must be earned. That is difficult, if
not impossible, without an experienced and quality workforce, which is not
something that is created overnight. Attracting, training, and retaining a quality
workforce should be of the highest priority for all contractors, regardless of
labor affiliation. Putting off addressing this topic could produce barriers
that may be difficult and costly to overcome.

Again, management struggles
between short-term cost and earnings versus long-term growth and potential
earnings. Without a doubt, it is a difficult topic; and at the forefront of
that discussion is the forecasting of “potential” future business: Will it be
there? If so, when? To what degree can you influence the potential? Will you
have time to obtain quality craft personnel; and, if so, at what cost? Will
that business be competitively attractive? How much business will be available?
These are basic questions all contractors—large or small—face every day. Some
would argue that small contractors have the advantage, for they have been able
retain their workforce where medium- to large-size contractors have not. Others
may agree with that observation but point out the problem of turnover for small
contractors over the last several years, and that the economy could make it
more difficult for them to rebuild.

An experienced and quality
workforce is not created overnight. It is strongly suggested that contractors
examine their workforce availability versus their future demand expectations.
If a potential shortage is a concern, working now to attract, train, and retain
craft personnel may be a wise investment that could yield a substantial return.

Mechanical Insulation Is a Prescriptive Energy-Efficiency
Solution Competing in a Holistic Environment

The need for holistic energy benchmarking and
measurement is being discussed in many circles, including code adoption,
building modeling, high-performance buildings (new and existing),
energy-efficiency tax incentives, and energy standards, just to name a few.
While holistic measurement is probably the most accurate means to monitor
energy use in buildings, there are problematic areas in designing new buildings
and in existing buildings, such as existing product minimum standards, current
codes, information disclosure, modeling assumptions versus real-world
occurrences, etc. This is not an easy discussion, but our industry would be
remiss in not appreciating the forces at work to create and implement holistic
designs and monitoring benchmarks.

Mechanical insulation in any
performance measurement arena is a proven energy-efficiency initiative that
delivers a substantial return. We can calculate the level of energy saved with
software, practices, etc., but how do facility owners or managers measure and
monitor actual results from a holistic perspective? If we know the building’s
total energy usage, we can—by knowing the scope of insulation and use
conditions—determine the savings being contributed by mechanical insulation.
The same would be true for determining the value of replacing missing or
damaged insulation, or upgrading proposed or existing systems. The bottom line
from a holistic perspective is that the success of mechanical insulation is
dependent upon the measurements of the whole building, which are dependent on
many variables. That reality is no different for lighting, windows, air
sealing, high-efficiency equipment, etc., so why is mechanical insulation not
given the same high-profile consideration?

Many of those other measures have, for a number of years, been investing
the resources to determine the impact they have holistically and how that can
be measured/monitored. They have aligned with other industry groups to promote
controls and measurements processes, and invested significant industry research
and marketing dollars within all channels. This is the world in which
mechanical insulation competes daily. Our industry is in a race, and we are
running behind. Acceleration is needed before we are left further behind.

Not considering the value
prescriptive measures like mechanical insulation bring to the table in the
holistic movement could result in significant energy loss as well the loss of
other benefits that affect a building’s performance. The industry needs to
address this challenge/opportunity sooner rather than later to ensure the full
value of mechanical insulation is understood and implemented in all holistic
energy measurement initiatives, from building modeling to code development, implementation,
and enforcement; benchmarking for high-performance buildings; maintenance and
retrofitting, etc. The industry is competing in a different environment than it
has before.

Interestingly, the entire
discussion about holistic initiatives has focused upon the commercial or
building sector. Given the energy savings potential in the
industrial-manufacturing sector, you would think a similar movement would be
afoot. Something to think about?

The Value of Mechanical Insulation for
Conservation of Energy and Water-the Energy and Water Nexus-Requires Attention
and Study

As the National
Institute of Building Sciences has noted, the value of water has never been
considered in making the business case for additional pipe insulation on
domestic hot water piping, thickness, or scope of work. While energy efficiency
is considered, the overriding driver typically is short-term economics,
dependent on frequency, duration, and pattern of usage.

History has proven thermal
insulation for mechanical systems is a simple and cost-effective technology for
reducing heat losses and gains in building systems. As energy codes and
regulations, prescriptive and holistic, become more stringent and building
owners, operators, and tenants strive for higher performing and more sustainable
buildings, designers and owners should focus on how and where to use more—not
less—insulation.

Initial studies and analysis
have demonstrated that pipe insulation can contribute toward conserving scarce
water resources, as well as energy, in domestic hot water delivery systems. The
expected useful life of buildings can be 50 years or more. It is significantly
easier and more cost effective to plan for and install proper mechanical
insulation systems at the time of construction than to retrofit or upgrade the
insulation systems later. Likewise, when facilities are being renovated or
repaired, the opportunity to upgrade mechanical insulation systems should not
be overlooked. Efforts to “trade-off” mechanical insulation levels to minimize
initial costs are counterproductive and are better focused on examining the
long-term performance of building systems.

With the anticipated shortage
and escalation of the cost of energy and water, combined with the long service
life of domestic hot water piping systems and the relatively minor incremental
cost of insulation, the potential impact of increased insulation can be
substantial and immediate.

Our industry needs to partner
with other interested parties to confirm the initial studies and determine the
impact of mechanical insulation on both energy and water use on domestic hot
and chilled water systems, and examine the business case and return on
investment. The opportunity is there. The industry needs to be a leader in this
area and not rely on others to do the leg work.

Emissions Reduction

The environment
and the need for emissions reduction have been a subject of much debate for
decades. The role mechanical insulation can play in reducing emissions has not
been fully recognized or appreciated by environmentalists, regulators, or other
interested parties. While the environment has been a center stage topic, its
importance may be gaining renewed attention by regulators.

There are many drivers behind
that renewed attention. Shifting weather patterns across the United States and
the unusual severe storms of the last few years certainly play a role. The
federal deficit reduction and budget discussions also may be impactful. As the
political parties debate the proper balance between revenue increases and cost
reduction, the concept of implementing some type of tax or penalty on emissions
could gain momentum. After all, if companies are taxed for positive behavior
(e.g., being profitable), why not tax them for negative behavior, such as
producing emissions beyond established permissible limits? The concept is
simple, but achieving consensus and implementing and monitoring compliance
raise complexities. Putting aside politics and addressing the complexities of
such a plan, however, could be beneficial to the industry.

Education at All Levels of Facility Design and
Management To Address the Deficit in Understanding of Mechanical Insulation
Systems

Buildings and facilities are complex systems built
from ideas, experiences, technologies, and practices brought together by different
disciplines, users, and needs. It is of critical importance that decision
makers at all levels understand the cost/benefit variables for mechanical
insulation systems to make informed decisions on which technologies to
prioritize and implement to achieve energy efficiency, emissions reduction, and
other goals.

Education and training within
the building professions should be aimed at facilitating the entire life cycle
of buildings, from concept to design, construction, commissioning, occupancy, modification/renovation,
and deconstruction. In each period within the life cycle, particular segments
of the building community must be engaged and have the requisite knowledge to
adequately address the needs of that stage. Historically, the primary education
focus has been in universities, colleges, and trade schools; but efforts have
been minimal in the case of mechanical insulation and, potentially, other
disciplines.

For years, a deficient understanding of what mechanical insulation is and how it could be used has impeded
policy makers, design professionals, facility management, and others in
industrial and commercial sectors in making a supportable case for increased
use and maintenance of mechanical insulation. To those in the industry, it is a
“no-brainer.” The frustration with others’ lack of understanding or
appreciation is real.

After a recent presentation, I received the following message:

“I wanted to let you know that
we are working on an energy audit for the local Veterans Administration
Hospital. They have missing insulation on multiple steam-to-hot water
converters and also on their chilled water pumps. I’m using your insulation
calculator today to arrive at numbers for those Energy Conservation Measures. I
probably would have let that slide before I saw your presentation.”

Without a doubt, an increased
educational focus on mechanical insulation is needed in the private and public
sectors, including higher learning institutions. Implementing and maintaining
an aggressive, meaningful, and sustainable education and promotional campaign
in today’s economy is not easy, given financial and other resource demands; but
if the industry wants to influence positive change and long-term, sustainable
growth, it cannot afford to sit on the sidelines. Education will provide
long-term benefit for all industry segments.

The Bottom Line

The economy is recovering. Many are forecasting
commercial and industrial construction to increase by mid-high single or
moderate double digits in 2013 through 2016. The question is not if, but at
what pace and where does the mechanical insulation industry fit in the recovery
cycle? The industry is historically one of the last sectors to feel the impact
of a downturn, and unfortunately one of the last to reap the benefits of a
recovery.

The potential for mechanical
insulation to play a significant role as a tool to achieve the goals of the
building community—energy efficiency, emissions reduction, sustainability,
water conservation, safety, personnel protection, improving the work environment,
etc.—is immense. However, the lack of sufficient data to support its potential,
combined with deficient understanding of what mechanical insulation is and how
it could be used, impedes policy and decision makers from making a supportable
case for increased use and maintenance of mechanical insulation. The
opportunities are real, and the need is now. The industry must recognize it is
competing in a different environment and not rely solely on historical
marketing and educational practices.

The National Insulation Association (NIA) and its members face
challenges, but these are stepping stones to a brighter, prosperous future. The
NIA World is abundant with experienced leaders, financial and human resources,
technology, the foundation for making change, and a rich history of addressing
and overcoming challenges. We need to harness our resources, work together, and
make things happen.

In last years’ State of the
Industry, I observed, “Unlike any other time in my tenure in the industry,
there has never been a more important time to come together and aggressively
address the opportunities disguised as challenges. The mechanical insulation
industry for years has been somewhat if not solely dependent upon the economy?
[We need] to accept and embrace whatever the economy provides, but we can also
positively influence the mechanical insulation industry’s role in the future
economy. We are in a position that we have never experienced. Mechanical
insulation needs a voice, and we need to be heard? The industry’s time to make
a difference, to influence the increased use of mechanical insulation, is NOW.”

This is an exciting time, and we need to invest in our future. The
industry is moving forward and your help is needed on many fronts. Don’t sit on
the sidelines—get involved.

For years, industry has viewed many maintenance activities as a necessary expense or barrier to obtaining profit objectives. This thought process is especially prevalent in a tough economic environment, which has certainly been the case in the United States since the recession began and even during recovery. Management has developed and applied justification methodologies to delay, or even abort, maintenance activities on facilities and processes. It appears that businesses require confidence in a sustained economic recovery before they commit to investing in endeavors such as maintenance of mechanical insulation. Maybe businesses, and/or governing bodies, are looking at mechanical insulation maintenance incorrectly.

Mechanical insulation maintenance is one of the few maintenance activities offering a definitive and attractive return on investment (ROI) that, in terms of short- and long-term energy cost reduction, increases profitability and creates direct, indirect, and induced jobs-the core component to sustained economy recovery. This article explores how increased focus on mechanical insulation maintenance will increase a company’s profitability, create jobs, help our country obtain its energy independence goals, and help stimulate our nation’s economy.

Mechanical insulation is most notably recognized for its inherent energy efficiency attributes, but energy efficiency measures are not always looked upon in a favorable light in troubled economic times. In an October 2012 white paper entitled “Energy Efficiency Job Creation: Real World Experiences,”1 Casey J. Bell, with the American Council for an Energy-Efficient Economy (ACEEE), observes, “The notion of energy efficiency as a driver for widespread,  sustained employment may not be immediately intuitive. Increasing energy efficiency means higher levels of productivity and output achieved through lower levels of energy use. At first glance, it may seem like producing less energy to accomplish the same amount of work would have a negative impact on employment. This view, however, falls short of recognizing the complete economic impact of redistributing saved resources.”

Bell notes that many energy efficiency initiatives take substantial human resources to plan, manage, and implement. Mechanical insulation maintenance, however, does not—nor does it take a significant amount of capital. It can be treated as an expense—an advantage from a tax perspective if potentially a deterrent to short-term profitability—but it provides ROI in many cases in fewer than 6 months. The exact ROI will depend on the application, but seldom is the yield lower than a 25 percent internal rate of return; and on many industrial or manufacturing applications, 200 to 400 percent is not uncommon.

The bottom line is that, as Bell observes, “a company that spends less money on its energy bills likely has more cash on hand to expand and hire.” In turn, that employment can translate into additional job growth in the local economy, which then impacts the regional and national economy.

The United States Bureau of Labor Statistics includes in its definition of “green jobs” those “in which workers’ duties involve making their establishment’s production processes more environmentally friendly or use fewer natural resources.”2 Insulation workers without a doubt perform green jobs. Mechanical insulation maintenance is an excellent example of green job opportunities that can be implemented within weeks or months, versus years. It can put tens of thousands of people to work immediately and retain existing jobs while contributing to the competitiveness of U.S. manufacturing, reducing our country’s dependence on foreign energy sources, improving our environment, and increasing profitability of private and public businesses and facilities.

Equally important, the majority of insulation contractors who install and maintain mechanical insulation systems represent independent small businesses in every state. Mechanical insulation is a proven technology. It does not require research and development, engineering, or design processes. Materials and skilled craft personnel are available now and ready to be deployed, and 95 percent of the materials are made in the United States.

The total number of jobs created by implementing a comprehensive mechanical insulation maintenance program extends well beyond the direct and indirect jobs that are created. The employed workers spend their earnings on a variety of products and services, stimulating growth in other sectors, providing those businesses additional dollars to spend on capital, expansion, or other projects as a result of reduced energy cost. Thus, the cycle of job creation is ongoing.

Using job multipliers derived from MIG’s IMPLAN model3, in the ACEEE white paper, Bell indicated that $1 million spent on energy efficiency in the construction sector supports
approximately 20 jobs. That number is potentially low for mechanical insulation maintenance opportunities because of the magnitude of the ROI. The National Insulation Association (NIA) estimates that implementing a comprehensive mechanical insulation maintenance program in the commercial and industrial market segments and going beyond the minimum standards in new construction, would lead to the following, on an annual basis:

  • Energy savings of 1.22 quads of primary energy, or $4.8 billion
  • ROI ranging from 25 to 100 percent
  • CO2 reductions of 105 million metric tons (MMTCO2)

What do those numbers equate to on a national basis?

Energy savings of 1.22 quads per year equates to:

  • 115 billion kWh of electricity—enough to power 10.8 million households (9.4 percent of  U.S. households) for a year, equivalent to annual output from 26,300 wind turbines
  • 207 million barrels of oil—enough to fill about 103 supertankers
  • 49 million tons of coal—enough tofill 490,000 railcars
  • 1,220,000,000,000,000 Btus (1.22 quadrillion Btus) of primary energy—about 1.2 percent of total U.S. annual consumption, or 4.5 days of energy consumption for the entire United States

105 MMTCO2 of CO2 reduction per year equates to:

  • Adding 4.6 billion mature trees (10.6 million acres of new forest, an area the size of Maryland and Massachusetts combined)
  • Removing 19.2 million cars from the roads, about 7.6 percent of the cars registered in the United States
  • Removing the emissions equivalent of 25 coal-fired power plants, or 3.7 percent of U.S. installed, coal-fired capacity
  • Installing 1.8 billion compact florescent light bulbs, equivalent to 6 light bulbs for every man, woman, and child in the United States

Examining the mechanical insulation maintenance opportunity, and applying the October 2012 ACEEE energy efficiency job creation methodology, approximately 153,000 total jobs would be created—more than double the actual direct and indirect jobs. Achieving these numbers cannot be accomplished overnight, but even with a relatively slow implementation rate, imagine what the numbers would be on a compounded basis over 10 or 20 years.

Some operational and maintenance managers have said that maintaining mechanical insulation is a never-ending process. They are probably correct, because people and/or Mother Nature are the primary causes of damage. Educating personnel as to the real cost of damaging a mechanical insulation system would yield long-term dividends. Most people truly do not understand or appreciate the effects of one small hole in a mechanical insulation system. They walk on the system; lay equipment and tools on it; run into the system with vehicles; hit it for some unknown reason; remove it for substrate inspection or maintenance of adjoining equipment and do not replace it, exposing the remaining insulation, etc. The list of issues is seemingly endless.

Mother Nature is another story. She can do extensive damage in a very short period time. Again, educating personnel as to the value of proper and timely repair of that damage will yield a substantial return.

To management, we can only encourage recognizing the ROI aspect with mechanical insulation maintenance—stop only looking at it as an impediment to the bottom line, and do not accept excuses to delay corrective actions. It is so easy to take insulation systems for granted and talk yourself into believing that delaying action for a few weeks is no big deal. Weeks turn into months, and eventually years, and then you could be facing major problems beyond that of replacing the insulation system. An insulation system failure is normally blamed for corrosion, operational cost increases, underperforming equipment, capital investment required, etc., when in most cases it comes back to taking the insulation systems for granted and delayed corrective action, not the insulation system itself.

While this may sound like common sense, you may or may not be surprised about the lack of respect mechanical insulation systems are given throughout the design, operational, and maintenance processes. Designing, installing, and maintaining a successful mechanical insulation system for below- or above-ambient applications, regardless of geographical location, requires a conscious and continual effort.

Policies, business decisions, and regulatory requirements typically revolve around numbers, so look at the numbers: Increased focus on mechanical insulation maintenance will increase a company’s profitability, create jobs, help our country obtain its energy independence goals, and help stimulate our nation’s economy. Whether you examine the numbers holistically or on a prescriptive basis, the equation does not change: Mechanical Insulation Maintenance = ROI = Job Creation = Energy Efficiency = Economic Recovery.

Sources

  1. www.aceee.org/files/pdf/white-paper/energy-efficiency-job-creation.pdf
  2. www.bls.gov/green/green_definition.htm
  3. “IMPLAN US Model 2009 All Sectors.” Hudson, WI: MIG, Inc.

Recently, I decided to tackle some long overdue
home improvement projects, including modernizing a number of lighting and
electrical fixtures. Clearly, I am in the insurance industry for a reason. As I
tried to decipher various electrical schematics, I thought to myself, this must
be what health care reform looks like to everyone else. That suspicion actually
had been raised a few months earlier. On November 7th, my phone began to ring—a
lot. Clients, bankers, accountants, coworkers, friends, and prospects all had
one thing in common: each hoped that the election would lead to resolution of
the issue of health care reform. In this article, we’ll tackle a few of the
big considerations and touch on information business leaders need to know as we
enter the Patient Protection and Affordable Care Act’s (ACA’s) implementation
home stretch.

How will your business be
impacted? That largely depends on how many people you employ. Overwhelmingly,
concerns about the “Pay or Play” penalties have been at the forefront. So let’s
start there.

Pay or Play Rules

The ACA brings many changes to employers and health
plans. One such change essentially amounts to a requirement for some employers
to offer a certain level health care coverage to their employees or face
penalties. While ACA does not explicitly mandate an employer to offer employees
acceptable health insurance, beginning in 2014, some employers with at least 50
full-time equivalent employees will face penalties if one or more of their
full-time employees obtain(s) a premium credit through an Affordable Health
Insurance Exchange (“Exchange”—addressed in more detail later). An individual
may be eligible for a premium credit either because the employer does not offer
coverage, or the employer offers coverage that is either not “affordable” or
does not provide “minimum value.”

Only large employers may be
subject to the penalties regarding employer-sponsored health insurance. To
determine whether an employer is a large employer, both full-time and part time
employees are included in the calculation. Full-time employees are those
working an average of 30 or more hours per week. The number of full-time
employees excludes full-time seasonal employees who work for less than 120 days
during the year. The hours worked by part-time employees (that is, employees
working less than 30 hours per week) are included in the calculation of a large
employer, on a monthly basis, by taking their total number of monthly hours
worked and dividing by 120.

Example—A company has 35 full-time employees
(working 30+ hours/week). In addition, the company has 20 part-time employees
who all work 24 hours/week (96 hours/month). The part-time employees’ hours
would be treated as equivalent to 16 full-time employees, based on the
following calculation:

20 Employees x 96 Hours/120 =
1,920/120 = 16

This company would be considered a large employer,
based on a total full-time equivalent count of 51. That is, 35 full-time
employees plus 16 full-time equivalents based on part-time hours.

What Happens if I Am Not a Large
Employer?

If, after completing the calculation above, you
determine that you are not a large employer, your business will not be subject
to penalties. Determining whether or not to continue offering health benefits
to your employees will be driven solely by your unique business environment.
Many employers will continue to offer benefits because they see those benefits
as a critical component of their compensation package that improves their
ability to attract and retain a quality workforce. Other employers will
discontinue their benefits offering, or they may elect to make a contribution
toward the insurance but allow their employees to make their own insurance
selections through their local Exchange.

Potential Tax Penalties in 2014 on Large Employers

Regardless of whether or not a large employer
offers coverage, it will be potentially liable for a penalty beginning in 2014
only if at least one of its full-time employees—those individuals working 30
hours/week or more—obtains coverage through an Exchange and receives a premium
credit.

Part-time workers are not
included in penalty calculations, even though they are included in the
determination of whether an employer is a large employer. An employer will not
pay a penalty for any part-time worker, even if the part-time worker receives a
premium credit.

In contrast, although seasonal
workers are not included in the determination of large employer status, if an
employer is determined to be a large employer without counting its seasonal
workers, it still potentially could face a penalty for each month that a
full-time seasonal worker received a premium credit for Exchange coverage.

Beginning in 2014, individuals
who are not offered employer-sponsored coverage, and who are not eligible for
Medicaid or other programs, may be eligible for premium credits for coverage
through an Exchange. These individuals will generally have income between 138
percent and 400 percent of the federal poverty level.

Individuals who are offered
employer-sponsored coverage can only obtain premium credits for Exchange
coverage if, in addition to the other criteria above, they also are not
enrolled in their employer’s coverage and their employer’s coverage meets
either of the following:


  • The individual’s required contribution toward the plan premium for
    self-only coverage exceeds 9.5 percent of household income;

    or

  • The plan pays for less than 60 percent, on average, of covered health
    care expenses.

Employer Safe Harbor

The Internal Revenue Service has provided an
“affordability safe harbor” for employers that offer health coverage, which is
available through at least the end of 2014.

To be eligible for the safe
harbor, an employer must meet certain requirements:


  • The employer must offer its full-time employees (and their dependents)
    the opportunity to enroll in minimum essential coverage under an
    employer-sponsored plan; and

  • The employee portion of the self-only premium for the employer’s lowest
    cost coverage that provides minimum value (the employee contribution) must not
    exceed 9.5 percent of the employee’s W-2 wages.

If the employer satisfies both
of these requirements for a particular employee, along with any other
conditions for the safe harbor, the employer will not be subject to a penalty
for providing unaffordable coverage with respect to that employee. This is the
case even if the employee receives a premium tax credit or cost-sharing
reduction to purchase coverage through a health insurance Exchange.

Penalty for Large Employers Not Offering
Coverage

Beginning in 2014, a large employer will be subject
to a penalty if any of its full-time employees receives a premium credit toward
their Exchange plan. In 2014, the monthly penalty assessed on employers that do
not offer coverage will be equal to the number of full time employees (minus
30) multiplied by 1/12 of $2,000 for any applicable month. After 2014, the
penalty amount would be indexed by the premium adjustment percentage for the
calendar year.

Penalty for Large Employers Offering Coverage
But Not Safe Harbored

Employers that do offer coverage still may be
subject to penalties if at least one full-time employee obtains a premium
credit in an Exchange plan because the employer’s coverage is unaffordable or
insufficient. To trigger a penalty, the employee’s required contribution for
self-only coverage must exceed 9.5 percent of the employee’s household income,
or the employer’s plan must pay for less than 60 percent of covered expenses.

In 2014, the monthly penalty assessed on an employer for each full-time
employee who receives a premium credit will be 1/12 of $3,000 for any
applicable month. However, the total penalty for an employer would be limited
to the total number of the company’s full-time employees (minus 30), multiplied
by 1/12 of $2,000 for any applicable month. After 2014, the penalty amounts
would be indexed by the premium adjustment percentage for the calendar year
.

What Are Health Insurance Exchanges?

One of the backbones of ACA is the call for
creation of state-based competitive marketplaces, known as Affordable Health
Insurance Exchanges, for individuals and small businesses to purchase private
health insurance. According to the Department of Health and Human Services
(HHS), the Exchanges will allow for direct comparisons of private health
insurance options on the basis of price, quality, and other factors; and will
coordinate eligibility for premium tax credits and other affordability
programs. ACA requires that Exchanges become operational in 2014.

Due to a number of factors,
states’ progress toward developing the Exchanges has been far from uniform.
There also has been uncertainty surrounding the structure of the Exchanges and
the role of entities that have been traditionally involved with the insurance
placement process, such as brokers and agents.

In addition to ACA’s Exchanges,
private health insurance exchanges are emerging to provide another way for
employers to provide health insurance coverage for employees.

Exchanges must be ready to
accept enrollees on October 1, 2013. Some states, such as Oregon, Colorado, and
Maryland—plus the District of Columbia—already have established Exchanges and
received HHS’ conditional approval for their Exchange plans. Other states that
intend to operate their own Exchanges starting in 2014 include Kentucky, New
York, Connecticut, Maine, Washington, Nevada, Idaho, Utah, New Mexico,
Minnesota, California, Mississippi, Vermont and Rhode Island. Some states have
announced that they do not intend to create their own Exchanges but will
partner with HHS to develop an Exchange. These states include Iowa, Arkansas,
Illinois, Michigan, West Virginia, Delaware, and North Carolina. A majority of
states will let HHS run an Exchange for their residents starting in 2014,
including Arizona, Texas, Louisiana, Wisconsin, Florida, Georgia, Ohio, and
Pennsylvania. A full list of state decisions is available online at http://statehealthfacts.kff.org/comparemaptable.jsp?ind=962&cat=17.

Summary of Other ACA Provisions To Be Aware of
in 2013

The two topics
above have generated the most interest, but there are a number of provisions on
the horizon that also should be on your radar, summarized briefly below. Be
sure to work with your broker or advisor to make sure your health benefits
program stays compliant as these provisions go into effect.

  • Uniform Summary of Benefits and Coverage and Notices of Material
    Modification


    • Applicable to: All non-grandfathered and grandfathered
      health plans

    • Effective:For plan years and open enrollment periods
      beginning on or after September 23, 2012

    • Details: Employers must provide a Summary of Benefits and
      Coverage to all plan participants and employees who are eligible to
      participate. The summary must be written in easily understood language and is
      limited to four double-sided pages. Any mid-year changes to the information
      contained in the summary must be provided to participants 60 days in advance.

  • Reporting Health Coverage Costs on Form W-2


    • Applicable to: Employers that file at least 250 W-2 Forms
      must comply with this reporting requirement for 2012. The requirement is
      optional for small employers (those filing fewer than 250 W-2 Form) for at
      least the 2012 tax year and will remain optional until further guidance is
      issued.

    • Effective: For 2012 W-2s to be issued by
      January 31, 2013

    • Details: ACA requires employers to disclose the value of
      the health coverage provided by the employer to each employee on the employee’s
      annual Form W-2, regardless of who pays the premium for that coverage.
      Employers should take steps to ensure that payroll providers are prepared for
      the new reporting requirement.

  • Limiting Health Flexible Savings Account (FSA) Contributions


    • Applicable to: Health FSAs (generally part
      of a Section 125 plan)

    • Effective: For plan years beginning after
      December 31, 2012

    • Details: ACA limits the amount of pre-tax salary reduction
      contributions to health FSAs to $2,500 per year.

  • Additional Preventive Care Services for Women


    • Applicable to: Non-grandfathered plans only

    • Effective: Plan years beginning on or after
      August 1, 2012

    • Details: Beginning in 2010, non-grandfathered group health
      plans and health insurance issuers offering group or individual
      non-grandfathered health insurance coverage were required to provide coverage
      for preventive care services without cost-sharing requirements. Effective for
      plan years beginning on or after August 1, 2012, the required preventive care
      services include specific services for women, including contraceptives;
      contraceptive counseling; breastfeeding support, supplies, and counseling; and
      screening for domestic violence.

  • Employee Notice of Exchanges


    • Applicable to: Generally all employers

    • Effective: Required by March 1, 2013

    • Details: Employers must provide a notice to employees
      regarding the availability of the health care reform insurance Exchanges. The
      notices will explain some of the benefits and consequences to employees if they
      choose to purchase through the state Exchange instead of electing coverage
      under an employer-sponsored plan. HHS has indicated that it plans on issuing
      model Exchange notices in the future for employers to use.

  • Additional Medicare Tax for High Wage Workers


    • Applicable to: All employers

    • Effective: January 1, 2013

    • Details:Employers are required to withhold an additional
      0.9-percent Medicare tax on an employee’s compensation in excess of $200,000. The
      additional tax does not have an employer matching requirement.

  • Comparative Effectiveness Research (CER) Fees


    • Applicable to: All plan sponsors (insurers will pay this
      for fully insured plans)

    • Effective: First payment is due by July 31, 2013

    • Details: Issuers and sponsors of self-insured health
      plans must pay CER fees to fund health care research. The CER fees will be
      effective for the 2012 through 2018 plan years. For plan years ending before
      October 1, 2013 (that is, 2012 for calendar year plans), the research fee is $1
      multiplied by the average number of lives covered under the plan. The fee goes
      up to $2 for plan years ending on or after October 1, 2013 and before October
      1, 2014, and will be indexed for future years.

  • Certification of Compliance to HHS


    • Applicable to: All plan sponsors

    • Effective: By December 31, 2013

    • Details: Group health plans must file a certification
      statement with HHS certifying that their data and information systems for the
      plan are in compliance with Health Insurance Portability and Accountability Act
      standards; and operating rules for health plan eligibility, electronic funds
      transfer, health claim status, health care payments, and remittance advice
      transactions. HHS intends to issue more guidance on this requirement in the
      future.

    Major Provisions Take Effect in 2014

    Several other important, additional health
    insurance reform measures will be implemented beginning in 2014 in addition to
    the individual and employer mandates, and the health insurance Exchanges
    discussed above.


    • Guaranteed Issue and Renewability. Health insurance issuers
      offering health insurance coverage in the individual or group market in a state
      must accept every employer and individual that applies for coverage in the
      state and must renew or continue to enforce the coverage at the option of the
      plan sponsor or the individual.

    • Pre-existing Condition Exclusions. Effective January 1,
      2014, group health plans and health insurance issuers may not impose
      pre-existing condition exclusions on any covered individual, regardless of the
      individual’s age.

    • Insurance Premium Restrictions.Health insurance issuers in the
      individual and small group markets will not be permitted to charge higher rates
      due to heath status, gender, or other factors. Premiums may vary based only on
      age (no more than 3:1), geography, family size, and tobacco use. The rating
      limitations will not apply to health insurance issuers that offer coverage in
      the large group market unless the state elects to offer large group coverage
      through the state Exchange (beginning on or after 2017). Also, these
      restrictions do not apply to grandfathered coverage.

    • Nondiscrimination Based on Health Status. Group health plans and
      health insurance issuers offering group or individual health insurance coverage
      (except grandfathered plans) may not establish rules for eligibility or
      continued eligibility based on health status-related factors.

    • Nondiscrimination in Health Care. Group health plans and health insurance issuers
      offering group or individual insurance coverage may not discriminate against any
      provider operating within their scope of practice. However, this provision does
      not require a plan to contract with any willing provider or prevent tiered
      networks. It also does not apply to grandfathered plans. Plans and issuers also
      may not discriminate against individuals based on whether they receive
      subsidies or cooperate in a Fair Labor Standards Act investigation.

    • Annual Limits.Restricted annual limits will be permitted until
      2014. However, in 2014, the plans and issuers may not impose annual limits on
      the coverage of essential health benefits.

    • Excessive Waiting Periods. Group health plans and health
      insurance issuers offering group or individual health insurance coverage will
      not be able to require a waiting period of more than 90 days.

    • Coverage for Clinical Trial Participants. Non-grandfathered group
      health plans and insurance policies will not be able to terminate coverage
      because an individual chooses to participate in a clinical trial for cancer or
      other life-threatening diseases, or deny coverage for routine care that they
      would otherwise provide just because an individual is enrolled in such a
      clinical trial.

    • Comprehensive Benefits Coverage.Health insurance issuers that
      offer health insurance coverage in the individual or small group market will be
      required to provide the essential benefits package required of plans sold in
      the health insurance Exchanges. This requirement does not apply to
      grandfathered plans.

    • Limits on Cost-Sharing. Non-grandfathered group health plans will
      be subject to limits on cost-sharing or out-of-pocket costs. Out-of-pocket
      expenses may not exceed the amount applicable to coverage related to Health
      Savings Accounts, and deductibles may not exceed $2,000 (single coverage) or
      $4,000 (family coverage). These amounts are indexed for subsequent years.
      Proposed guidance on this requirement indicates that the limits will apply to
      plans and issuers in the small group market only and not self-funded plans or
      plans in the large group market.

    • New Incentive Standards for Wellness Plans. Wellness programs can
      increase incentives provided for meeting health factor standards from 20 to 30
      percent of the total cost of the applicable coverage.

    • Transitional Reinsurance Payments. Insurance and third-party
      administrators will be required to pay, on an annual basis, a fee to support
      the transitional reinsurance program. This program is designed to stabilize
      premiums for coverage in the individual health insurance market. The fees will
      be distributed to insurers selling coverage in the Exchanges to offset the cost
      of covering individuals with high claims. HHS has proposed annual fees equal to
      $63 per covered individual/year.

    Closing Thoughts

    Needless to say,
    the schematic drawing of health care reform confounds nearly everyone. Even
    more challenging, it continues to change and will grow more complex as each
    state begins to implement its own rules and processes of Health Insurance
    Exchanges. This article only touches on a small part of the ACA puzzle. A great
    deal of health care reform will address Medicaid, Medicare, and other
    health-related components that do not immediately impact the business
    community. Other parts, specifically those that address how to measure employee
    service, exceed the scope of this discussion.

    At this point, many of the
    provisions lack integration. Grandfathering provisions do not impact the pay or
    play penalties. The nondiscrimination language scheduled to go into effect in
    2014 does not address an individual’s eligibility for credits or subsidies.

    What should you do? For
    starters, employers should begin by gathering information. Do you know which of
    your employees meet the definition of full-time employees? Does your waiting
    period need to be reduced to fewer than 90 days?

    Next, employers should assess
    potential costs to their organization. Will your business costs change if you
    begin offering coverage to those who work 30 hours or more? Does your
    contribution requirement of employees exceed 9.5 percent of your employees’
    wages?

    Finally, employers should
    consider their relationship with their employees. How will health care reform
    impact your ability to attract and retain a quality workforce? Arguably, this
    might be the most important consideration of all. At the end of the day,
    behaviors drive outcomes. What do you want your outcome to be? How important
    are your people in making that happen? If your people are critical to your
    future successes, health care reform may not be all that complex after all.

    SIDEBAR

    Six Employer Penalty Scenarios Beginning in 2014


    1. Scenario
      A
      Employer does not meet the definition of
      large employer. No penalty would be assessed.

    2. Scenario
      B
      Large employer offers coverage deemed to
      be both affordable and sufficient, qualifying them for the employer safe
      harbor. No penalty would be assessed.

    3. Scenario
      C
      Large employer does not offer coverage,
      but no full-time employees receive credits for Exchange coverage. No penalty
      would be assessed.

    4. Scenario
      D
      Large employer does not offer coverage and
      one or more full-time employees receive credits for Exchange coverage. The
      annual penalty calculation is the number of full-time employees (50, in this
      case) minus 30, multiplied by $2,000. In this example, the penalty would not
      vary if only one employee or all 50 employees received the credit. The
      employer’s annual penalty in 2014 would be (50-30) x $2,000, or $40,000.

    5. Scenario
      E
      Large employer offers coverage and no
      full-time employees receive credits for Exchange coverage. No penalty would be
      assessed.

    6. Scenario
      F
      Large employer offers coverage, but one or
      more full-time employees receive credits for Exchange coverage. The number of
      full-time employees receiving the credit is used in the penalty calculation for
      an employer that offers coverage. The annual penalty is the lesser of:


      • The number of full-time employees minus
        30, multiplied by $2,000 = $40,000 for the employer with 50 full-time
        employees; or

      • The number of full-time employees who
        receive credits for Exchange coverage multiplied by $3,000.


    Although penalties are assessed on a
    monthly basis (with the dollar amounts above divided by 12), this example uses
    annual amounts, assuming the number of affected employees is the same
    throughout the year. If the employer with 50 full-time employees had 10
    full-time employees who received premium credits, then the potential annual
    penalty on the employer for those individuals would be $30,000. Because this is
    less than the overall limitation for this employer of $40,000, the employer
    penalty would be $30,000. However, if the employer with
    50 full-time employees had 30 full-time employees who received premium credits,
    then the potential annual penalty on the employer for those individuals would
    be $90,000. Because $90,000 exceeds the employer’s overall limitation of
    $40,000, the employer penalty would be limited to $40,000.