Climate change
provides opportunities and challenges for the insulation industry.
High-performance insulation systems are vital for energy efficiency and
reductions in the greenhouse gases (GHGs) that contribute to climate change.
The consequences of climate change, such as heat waves, heavy precipitation,
high winds, flooding, and wildfires threaten the integrity and durability of
insulation systems. This article calls attention to the authoritative
information on climate change and suggests how the insulation industry can
contribute to the mitigation of and adaptation to climate change effects.
Climate, Weather, and Extreme Events
Weather,
climate, and extreme events are key considerations in insulation systems’
design and practice. Weather is defined as “the state of the atmosphere with
respect to wind, temperature, cloudiness, moisture, pressure, etc.” (NWS,
2013). Weather generally refers to short-term variations on the order of
minutes to about 15 days (NSIDC, 2012). Climate, on the other hand, “is usually
defined as the average weather, or more rigorously, as the statistical
description in terms of the mean and variability of relevant quantities over a
period of time ranging from months to thousands or millions of years” (IPCC,
2007). An extreme event is a weather event that is rare at a particular place
and time of year (IPCC, 2007). For instance, for Washington Reagan National
Airport on June 25 (Washington Post; June 26, 2013): the normal high
temperature is 87°F (climate), the high on June 25, 2013 was 93°F (weather),
and the record high was 100°F in 1997 (extreme event).
Scientists have reached a
consensus that weather, climate, and extreme events of the past generally will
not be representative of those of the future. Moreover, climate science is not
able to precisely forecast the climate, weather, and extreme events of future
decades. This uncertainty poses a challenge to standards that are based on the
assumption that the climate, weather, and extreme events observed in the past
will characterize those of the future.
A number of authoritative
sources (available free online) summarize the science on weather, climate, and
extreme events, and the links between science and decision making.
The U.S. Global Change Research
Program (USGCRP) involves 13 federal agencies and is headed by the White House
Office of Science and Technology Policy. USGCRP is preparing a National Climate
Assessment (NCA), which will be issued in 2014; a draft has been available
since January 2013 (NCA, 2013). The draft of the NCA was prepared by the
National Climate Assessment and Development Advisory Committee with over 240
contributors and authors including climate and social scientists as well as
engineers. It has chapters on urban systems, infrastructure and vulnerability,
U.S. regions, mitigation, and adaptation.
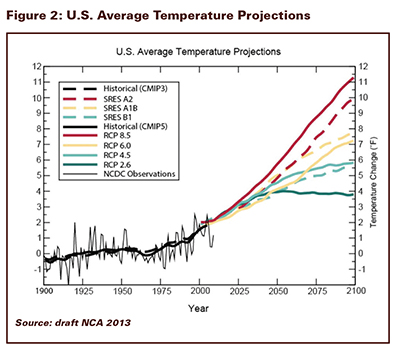
Figure 2, U.S. Average
Temperature Projections, taken from the draft NCA, illustrates both the
potential significance of climate change for insulation systems and why climate
science cannot now quantitatively forecast future climate, weather, and extreme
events.
The solid line for the 20th century shows an increasing trend,
amounting to about 2°F for the century, with the observed variations from the
trend as large as 2°F. The projections for the 21st century are
derived from global climate models that consider a variety of scenarios for
economic development and control of GHG emissions (Moss et al., 2010). The
lowest curve is based on GHG concentrations peaking at 490 ppm carbon dioxide
(CO2) equivalent and then declining; it leads to an additional 2°F
increase in U.S. average temperature in the 21st century. The
highest curve is based on emissions continuing to produce GHG concentration of
1,370 CO2 equivalent in 2100; it leads to an additional 9°F
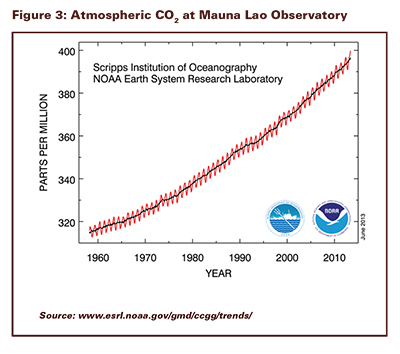
increase. The historical trend of atmospheric CO2 is shown in Figure
3. The CO2 data (red curve), measured as the mole fraction in dry
air from the Mauna Loa Observatory in Hawaii, constitute the longest record of
direct measurements of CO2 in the atmosphere. The black curve represents
the seasonally corrected data.
Greenhouse gas emissions in the 21st century will depend upon
worldwide actions, private and public behavior, and policy decisions and
actions, which are unpredictable, but can be represented by scenarios such as those
used in preparing Figure 2.
The Intergovernmental Panel on Climate Change (IPCC) is the leading
international body for the assessment of climate change. It was established by
the United Nations Environment Programme (UNEP) and the World Meteorological
Organization (WMO) in 1988 to provide the world with a clear scientific view on
the current state of knowledge in climate change and its potential
environmental and socio-economic impacts. The Physical Science Basis (IPCC,
2007) describes observational and modeling bases for projections of climate
change effects; an updated version is due for publication in the fall of 2013.
Figure 4, excerpted from Table 3-1 of “Special Report on Managing the Risks of
Extreme Events and Disasters to Advance Climate Change Adaptation” (IPCC, 2012)
provides guidance to future weather and extreme events that will affect
insulation systems.
The U.S. National Academies of
Science, Engineering, and Medicine have also studied climate change science,
mitigation, and adaptation (National Academies, 2011).
What Can the Insulation Industry Do?
Insulation
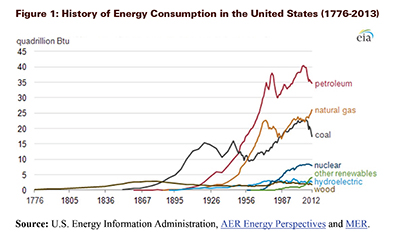
systems have always been strong contributors to energy efficiency. The
combustion of fossil fuels is responsible for over 80% of U.S. GHG emissions
(National Academies, 2011). If you consider U.S. energy use by sector,
buildings use 41%, industry uses 31%, and transportation uses 28%—thus, there
are significant opportunities for high-performance insulation systems to reduce
energy use.
Engineers and scientists from
the insulation industry can join in research with climate and weather
scientists to develop integrated models for climate, weather, and extreme
events (National Academies, 2012), which, combined with observations, can give
probabilistic guidance for the conditions for which insulation systems should
be designed, constructed, operated, and maintained.
Before such research is
conducted and its results incorporated in standards (a process that may take a
decade or more), what can the industry do?
There is useful guidance in the
concept “long life, loose fit, low energy” expressed by Alex Gordon, president
of the Royal Institute of British Architects (Gordon, 1972):
- Long life contributes to sustainability and reduction of GHG emissions
through conservation of materials and energy required for removal and
replacement. Long life can be promoted by siting and design to avoid
susceptibility to flooding and wildfires, and the use of systems and details
inherently resistant to extremes of temperature, wind, and precipitation.
However, shorter service lives, where economical, will provide opportunities to
account for better knowledge of climate/weather/extremes in design of future
replacements.
- Loose fit means making insulation systems adaptable to conditions that
could not be foreseen during the original design—a quality already widely
exemplified by older buildings in useful service today.
- Low energy, including the
embodied energy in original construction and the operating energy over the
service life, provides both economic benefits and reductions in the GHG
emissions driving climate change.
Members of the industry can and
should share their insights in adapting to climate change with case studies
published in Insulation Outlook and other media. They will guide the
evolution of standards and practices. Industry research, in collaboration with
climate and social scientists, can improve both observations of
climate/weather/extremes and modeling to provide a probabilistic understanding
of the changing nature of hazards, risks, and benefits as bases for
appropriately evolving insulation standards.
References
IPCC (2007), “Climate Change 2007: The
Physical Science Basis,” Intergovernmental Panel on Climate Change, available
at www.ipcc.ch.
IPCC (2012), “Special Report on
Managing the Risks of Extreme Events and Disasters to Advance Climate Change
Adaptation,” A Report of Working Groups I and II of the Intergovernmental Panel
on Climate Change, Cambridge University Press, available at www.ipcc.ch.
Gordon (1972), “Designing for
survival: the President introduces his long life/loose fit/low energy study,”
Royal Institute of British Architects Journal, vol. 79, no. 9, pp. 374-376.
Moss, et al. (2010), “The next
generation of scenarios for climate change research and assessment,” Nature,
463, pp. 747-756, [Available online at: http://emf.stanford.edu/files/docs/262/nature08823_proof1(2).pdf]
National Academies (2009), America’s
Energy Future, National Academies Press, available at http://www.nap.edu/catalog.php?record_id=12710
National Academies (2011), America’s
Climate Choices, National Academies Press, available at http://www.nap.edu/catalog.php?record_id=12781
National Academies (2012), A National
Strategy for Advancing Climate Modeling, National Academies Press, available at
http://www.nap.edu/catalog.php?record_id=13430
NCA (2013), “Federal Advisory
Committee Draft Climate Assessment” available at http://ncadac.globalchange.gov/
NSIDC (2012), Arctic Climatology and
Meteorology Glossary (http://nsidc.org/arcticmet/glossary/weather.html;
accessed October 9, 2012).
NWS (2013),
National Weather Service Glossary (http://w1.weather.gov/glossary/;
accessed on March 14, 2013